Help us improve your experience. See content that is made for you!
See how IBM increased their efficiency by up to 30%!

Help us improve your experience. See content that is made for you!
See how IBM increased their efficiency by up to 30%!


On a typical jobsite, there are hundreds of open issues, multiple trades onsite, dozens of RFI's to manage, and countless changes happening every day. Project leaders can struggle to understand where to prioritize their efforts. Instead, they spend their day reacting to issues that are now causing schedule or cost impacts.
Meanwhile, project executives are typically overseeing multiple projects and face their own challenges in knowing which projects may need the most support. While most issues on a project are preventable, the majority of project leaders and executives just don’t have good predictability into the highest areas of risk. In turn, these preventable issues that originate as early as design have a bigger impact on cost, schedule, safety, or quality during construction. As a result, project teams are left flustered and have to pick up the pieces with unhappy owners.
So, how can project executives and leaders start better predicting and mitigating this risk?
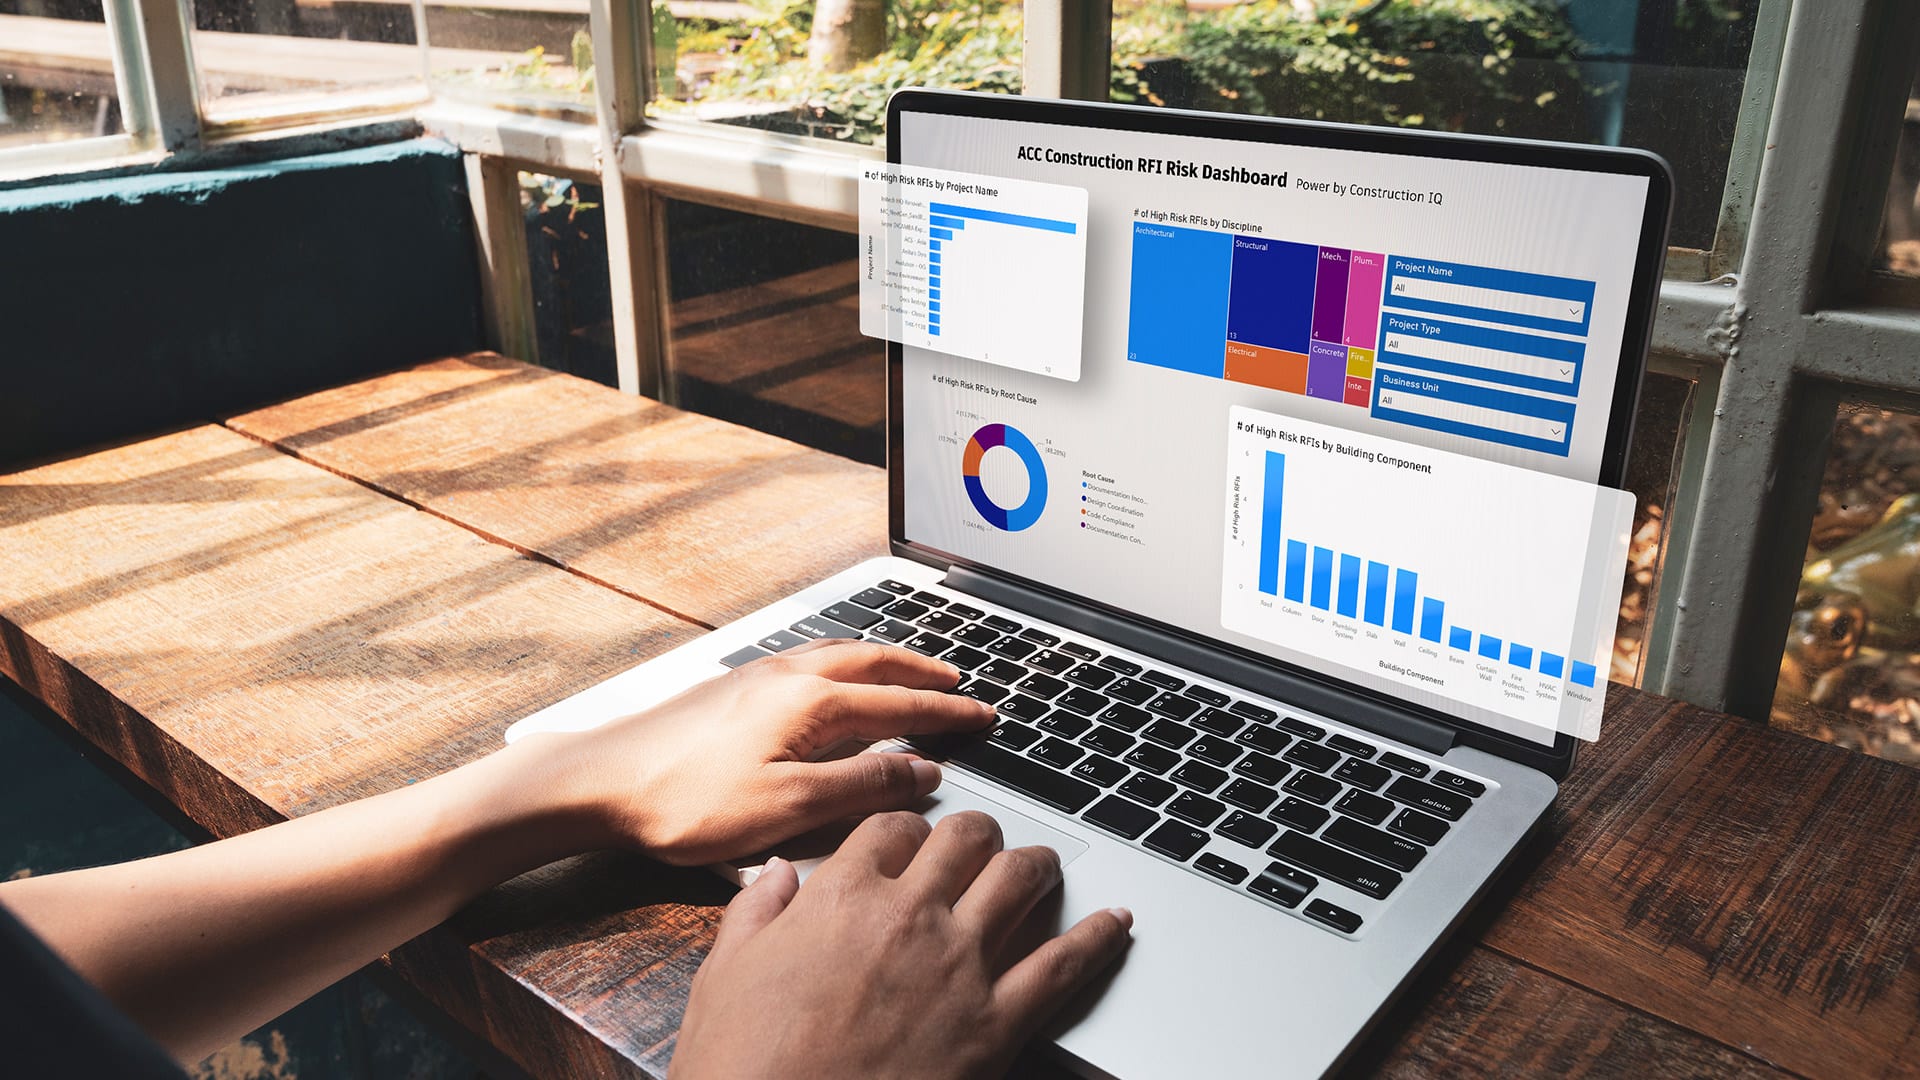
With the out-of-the-box dashboards powered by Autodesk’s Construction IQ, construction leaders can start to drill down to project level risk around safety, quality, design, and project controls. And now, with the ability to extract Construction IQ data via the Data Connector in Autodesk Build and BIM 360, teams can combine predictive risk analytics with other critical project data such as financial metrics and create custom dashboards in their own BI tool. This provides construction leaders with richer project analysis to proactively manage risks and prioritize efforts.

If you’re looking to leverage Construction IQ data extraction to maximize risk prediction, we break down a few examples to help you get started.
As a project executive, you may want to create a project health dashboard that shows subcontractor and quality risks, and high risk RFIs alongside financial performance data pulled from your ERP system. By connecting your data from Autodesk Build or BIM 360 into a business intelligence application like Power BI, you can now view both the risk prediction data generated by Construction IQ and the financial information from an ERP tool in a single view. This view provides you with a more wholistic understanding of project execution and financial performance.
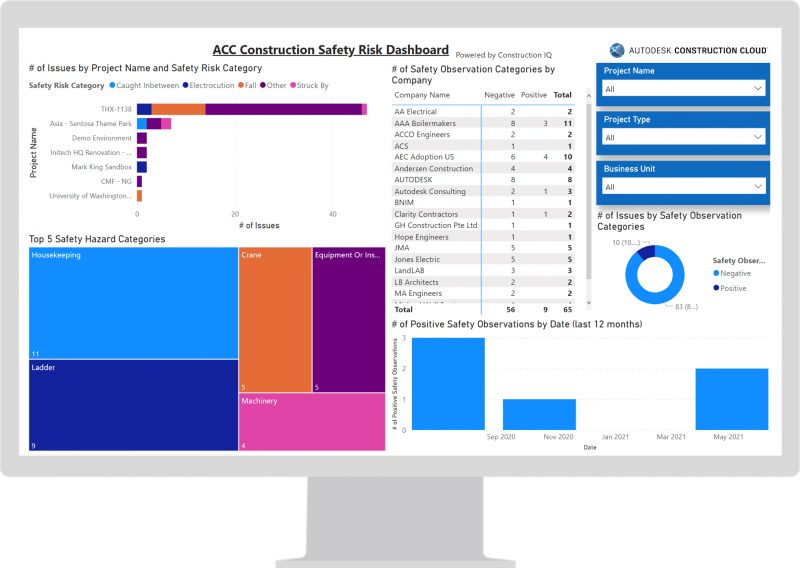
As mentioned, Construction IQ already leverages some great out-of-the-box project level dashboards. However, if you are a Safety Director, you may want to compare critical safety risks and hazards across multiple projects with your safety incident data. Better visibility into these trends can help you evaluate which projects to focus your attention on for safety training and awareness. With the ability to connect Construction IQ data into a BI tool, you can essentially create whatever cross project dashboards you want to better align with company goals or initiatives.
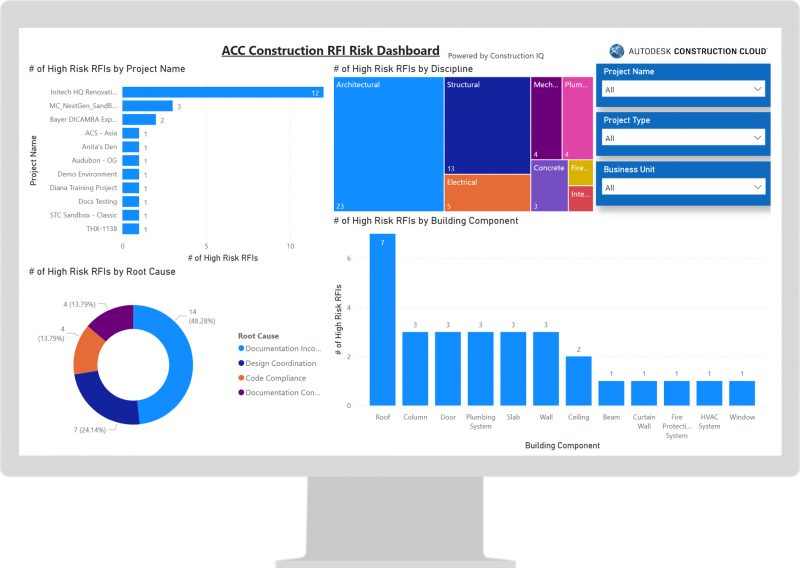
Understanding the root cause of any design issue or RFI is a big part of understanding how to resolve and avoid similar issues in the future. For example, as a VDC Director, you may want to understand the root cause of RFIs across projects so you can determine which projects experience a larger percentage of RFIs based on coordination issues during construction. By understanding which projects are struggling with coordination problems during field execution, VDC leaders can develop training and best practices to help teams avoid high risk RFIs in the future.

With the Data Connector, we gave teams easy access to their data so they can connect into other BI tools and customize dashboard to meet their specific needs. And now, with the ability to extract this risk data generated from the machine learning capabilities of Construction IQ, project and executive leaders can prioritize the right issues or projects and maximize prediction data to best align with their company needs.
Download Data Connector templates including the most recent one around Construction IQ.

May we collect and use your data?
Learn more about the Third Party Services we use and our Privacy Statement.May we collect and use your data to tailor your experience?
Explore the benefits of a customized experience by managing your privacy settings for this site or visit our Privacy Statement to learn more about your options.