As construction teams start to move from traditionally paper-based workflows and begin to adopt technology, more data is being collected every day. Today, teams are faced with a new challenge: what to do with all of this data.
Across the board, construction firms are starting to see the benefits of leveraging their data. Whether it is using out of the box dashboards to view trends like the number of safety issues on a project or taking data visualizations to the next level by using robust business intelligence tools, the shift towards data driven workflows is happening now.
But most of us don’t have any extra time to dedicate towards sorting and organizing large amounts of data. That is why our team at Autodesk is building tools that help construction professionals get instant data visualizations and simplify the upfront work so that project leaders can easily see trends and make more informed decisions.
With the release of Data Connector, we gave teams the ability to export all of their cross-project data in a single click so that they could import and use it with other robust business intelligence tools. This was a great first step toward empowering our users to customize dashboards and truly drive the visualizations they need.
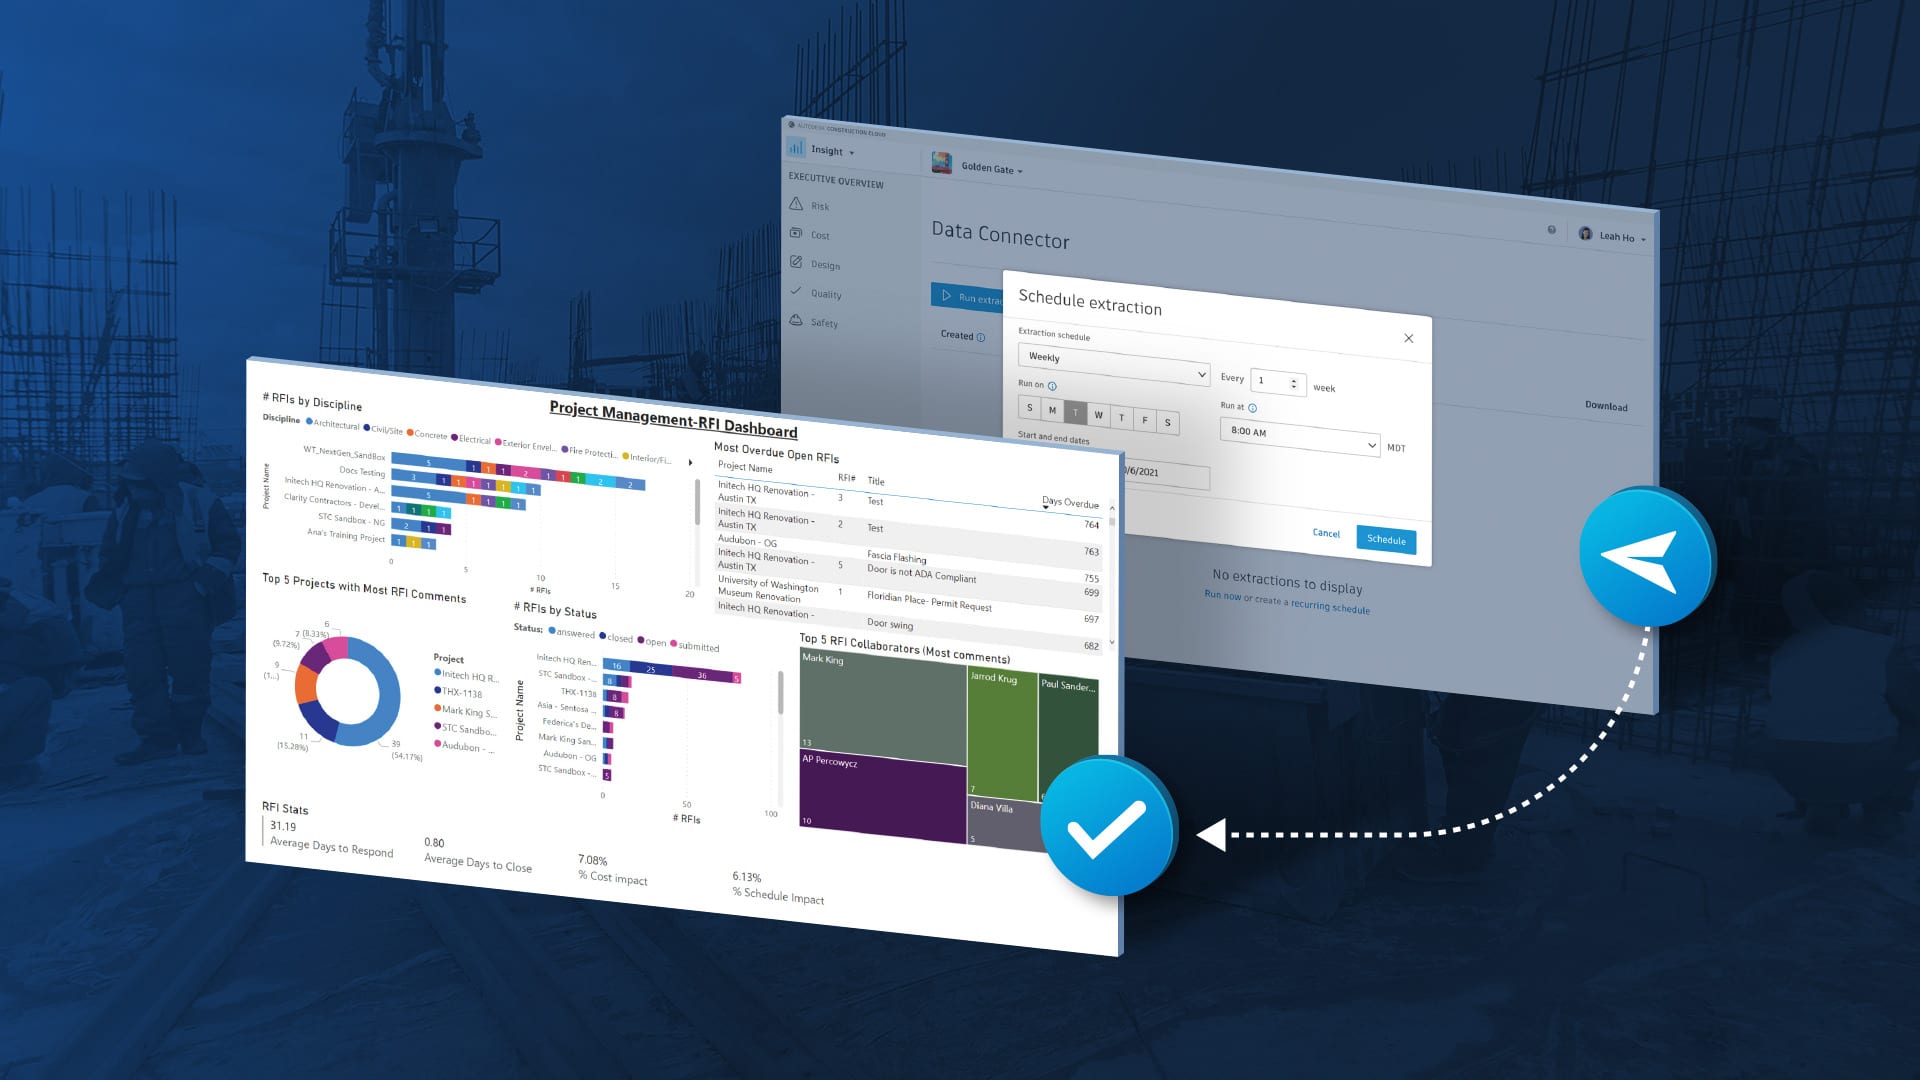
Now we are making it even easier with the Power BI Connector, a plugin tool that automates data extraction through Data Connector directly into Power BI. Once the Power BI Connector is downloaded and connected, users can schedule data extractions from the Autodesk Construction Cloud platform or BIM 360 and then click the ‘Refresh’ button in Power BI to see instant updates to dashboards.
The Power BI Connector is already helping teams save time and get more holistic views on companywide performance. We spoke with Ted Jennings, Senior VDC Manager at Barton Malow, and Dan Smolilo, Director of Process and Innovation at Walsh Construction, to understand how their project teams are using the Power BI Connector to drive business intelligence. Their responses ranged from streamlining information sharing to greater visibility into jobsite performance. However, there was one common thread: shared data on a unified platform drives better decision-making around resource planning and execution.
Construction is unpredictable, so key performance indicators (KPIs) are a must to maximize operational efficiency. Gaining visibility into what’s happening both on and off the jobsite provides clear direction for teams to be proactive rather than reactive to issues onsite. With information accessible in real-time, project teams can seamlessly unlock information across different applications, enabling faster decision-making with greater accuracy to drive project success.
“The Power BI Connector improves how we operate by providing real-time insight into jobsite performance,” says Smolilo. “With real-time analytics, we can drive better decision-making to optimize our workflows, as we can keep a pulse on what’s happening and manage jobsite activity accordingly. The data serves as a litmus test to validate the action that we’re taking on the jobsite while providing us with predictive insights, where we’re able to solve potential issues before they arise.”
Working across disparate systems hurts cross-team collaboration and can cause negative impacts on a construction project, including rework, delays, and cost overruns. With data directly synced and centralized on the Autodesk Construction Cloud platform, it’s pulled out of the platform and visualized in Power BI to broaden visibility between teams, removing silos to optimize project performance. By visualizing data in one location, teams can understand the project to communicate information clearly around RFIs, assets, and issues to drive more predictable and successful project outcomes.
"The direct connection between Data Connector and Power BI is helping to simplify the process of getting cross-project and cross-discipline insights together on one platform,” says Jennings. “By eliminating data silos, we can make faster and more informed business decisions that wasn’t a possibility with disparate solutions. Direct access to data also lowers the barriers to entry and alleviates the need for API integrations or IT infrastructure for data warehousing."
Effective construction reporting helps projects stay on schedule and budget. With the Power BI Connector’s automated data syncing, project stakeholders can stay up to date on the latest information and its impact on the project. With customizable templates, teams can analyze and gain insight into specific areas of the project to resolve issues more quickly, resulting in faster and more efficient project delivery.
“We are leveraging the Power BI Connector across our entire organization to visualize the data and drill down into specific details to identify correlations,” says Smolilo. “With the ability to grasp a detailed understanding of project data, we can manage our project more efficiently and share detailed levels of reporting with our clients and project stakeholders to maximize project delivery.”
The construction industry generates an enormous amount of data. But for data to drive business intelligence, it must be captured and interpreted accurately. With the ability to understand data through the Power BI Connector, teams can find patterns, trends, and correlations in project data to empower smarter decision-making across projects.
"Project teams routinely use the Power BI Connector to further dig into project information to understand key trends about their project,” says Jennings. “In addition to project teams, departments such as Safety, Quality, Account Administration, and VDC leverage the data to understand global trends within the company to make better decisions and take action.”
Click here to download the Power BI Connector, or learn more about Autodesk Construction Cloud’s Data Connector tool as well as download our Power BI Templates to help you get started.
