While there are commonalities for the chief causes of burst pipes – frozen pipes, water pressure, corrosion – the impact of each pipe burst will vary depending on the burst size, duration, location, time of the day, and many other parameters.
Knowing which are the most critical pipes in the network with regards to burst events (eg, in terms of customers affected by the potential failure) facilitates the planning of the maintenance activity, allowing for adequate resources allocation for critical assets.
Given the large number of parameters involved in the assessment and the extent of the pipework, the identification of critical pipes can be problematic, but we have a scalable and reproducible method to perform a burst criticality assessment within InfoWorks WS Pro.
Modeling pipe breaks with InfoWorks WS Pro
InfoWorks WS Pro provides the ability to model pipe bursts either as a pressure-dependent demand (break option), constant flow added to US and DS nodes (flow option), or to simulate a complete pipe rupture.
You can specify the type of break and the location in the pipe, or alternatively you can use the ‘Break Picker’ toolbar button to choose the burst location within the GeoPlan view. WS Pro will automatically calculate the distance from the pipe starting point and fill that information in the property sheet.

The burst can be set to last for the entire duration of the simulation or just for a certain period (start and end time).
Depending on the type of break you select, WS Pro will automatically compute the break volume and apply it as additional flow to US and DS nodes.
Assessing burst criticality with Generalized Multi-Run
We’ll start by assuming that the average response time for a pipe burst is 1 hour.
Performing this type of analysis for all the pipes in the network could well be an insurmountable challenge. In addition, we want to be assessing against the worst-case scenario of a burst occurring at peak time, corresponding to a minimum pressure. The definition of peak time is not unique throughout the network but specific to the asset that we are considering. Because of that, we’ll need to be able to change the burst start/end time for each scenario according to when the minimum pressure occurs.
We can run an SQL Query to return the minimum upstream node pressure value for each pipe as well as the time when it occurs. This will be the start time of our burst event. We are simply adding 1 hour to define the burst end time.

The manual definition of the different scenarios could be extremely time consuming, almost impossible when the network size goes above a certain threshold.
InfoWorks WS Pro provides the right tool to support you with the definition of different modeling scenarios, which is called Generalised Multi-Run (GMR).
GMR is essentially a wrapper around standard simulation types which causes the standard network to be run many times, each time modifying one or more values. Each one of these runs is called a Test Case. A GMR wizard allows the user to quickly define test cases from either selection list, CSV file, or output from a SQL Query.
With this, we are going to create a new GMR object based on the output of the SQL Query. This can be done through the ‘Mapped CSV Import’ option under the GMR object.

The Mapped CSV Import will add a test case for each pipe in the network (named us.node.ds.node.suffix).
Each test case will be made up of 6 rows to assign (1) break enabled, (2) break type, (3) break start and (4) end time, (5) break diameter, and (6) break distance along the pipe.
As you can imagine, the process will generate a consistent number of test cases (simulation scenarios). Those will be run as independent jobs using the remote agent technology to boost performance. The analysis will also leverage on the GMR post-processing tool to generate a summary report instead of saving all of the time-varying results.

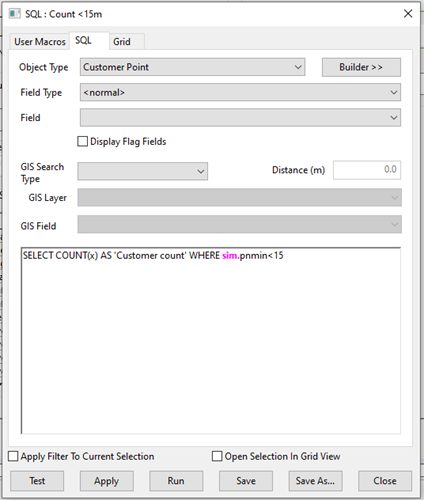
In the analysis tab, you can see that we are using a SQL Query to count the number of Customer Points where the minimum pressure goes below the 15m threshold during that day. This will allow us to assess the pipe criticality by looking at the number of customers affected in each case and easily compare results across different pipes.

We could extend the scope of this analysis adding more test cases to account for variation of burst entity (i.e. from 50mm to 100mm) and burst duration (from 1hr to 3 hrs).
For each test case, the summary report will list the number of customers affected by low pressure returned by the ‘Count < 15m’ query.

We can build our analysis on this number and apply against each pipe an equivalent number of customers affected. This information can then be used to color-code the pipes in the network based on criticality.

Now, it’s your turn
You can download this transportable database containing all the necessary elements to perform this analysis on your own network.