& Construction

Integrated BIM tools, including Revit, AutoCAD, and Civil 3D
& Manufacturing

Professional CAD/CAM tools built on Inventor and AutoCAD
2 min read
In the depth of winter in January 2018, the City of Livonia, Michigan experienced a master meter failure that caused several water main breaks, closed a major highway, and triggered a city-wide boil-water advisory.

Read the case study
Read all about a messy water main pipe break in our latest case study and how it led to OHM Advisors helping Livonia create digital dashboards with InfoWater Pro for faster response times.
Emergency situations like this have unfortunately become more common. According to a study by Utah State University, water main pipe breaks were up 27% in the six years prior to their latest survey of US and Canadian water utilities. The biggest reason is simple: aging infrastructure.
To help fix that problem, in October 2018, Congress passed America’s Water Infrastructure Act (AWIA), which requires community water systems that serve more than 3,300 people to develop or update risk assessments and emergency response plans (ERPs). Water systems are now tasked with:
At the time of Livonia’s water main break, this legislation was still being drafted, but Livonia had already embraced the idea and were already on their way to improving planning for future events.

The City of Livonia turned to Susan Knepper of OHM Advisors to help them create a modern digital plan using GIS-based hydraulic models that could be shared and updated with water utility engineers and operators to reduce customer impact during emergency situations.
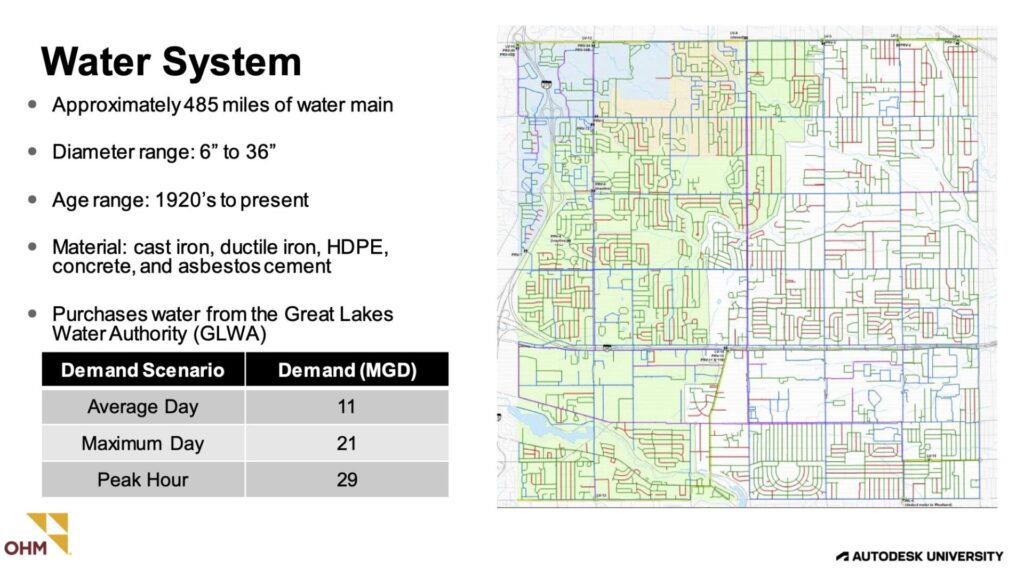
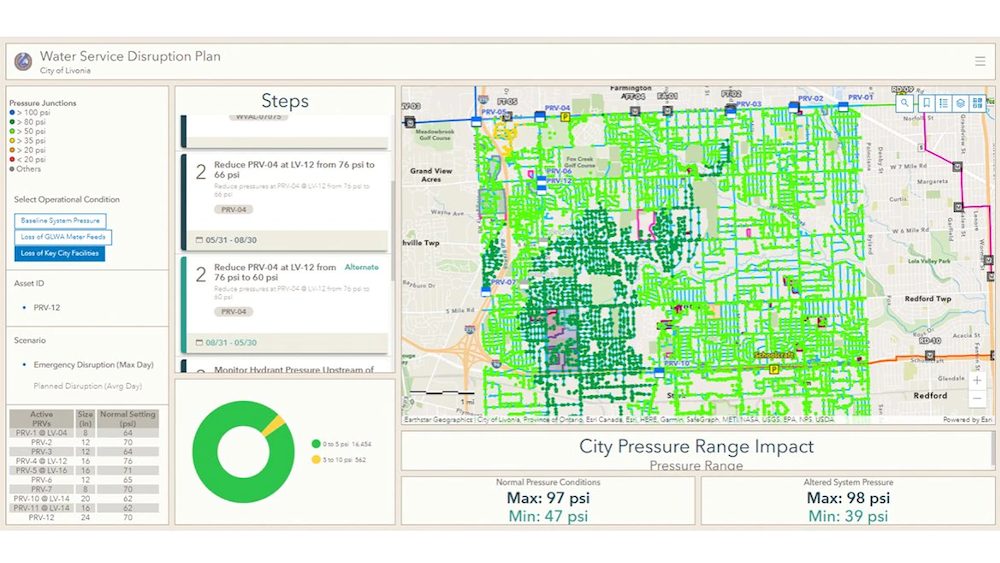
OHM Advisors began by building 40+ scenarios using InfoWater Pro, our hydraulic modeling solution for clean water distribution. In the past, the city might have published scenarios like this in binders and filed them in a central location, but OHM recommended including as much information as possible directly inside ArcGIS Pro dashboards so employees can have the right information close at hand.

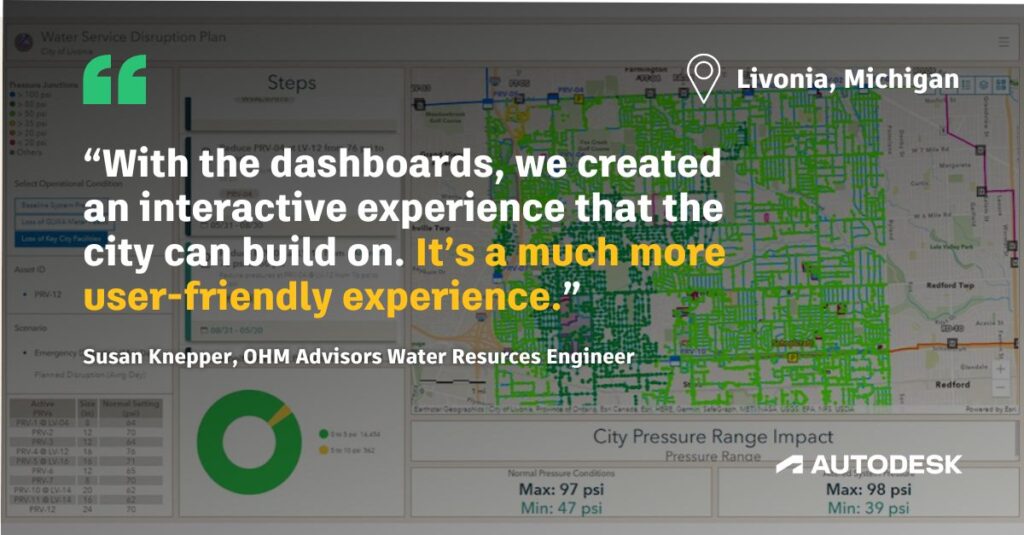
“With the dashboards, we created an interactive experience that the city can build on,” Knepper says. “It’s a much more user-friendly experience.”
Now, instead of consulting paper binders hidden away on shelves in centralized offices, Livonia DPW engineers and crisis coordinators from other city departments can quickly and easily access and use their digital dashboards to view scenarios, find meter locations at a glance, and review step-by-step guidelines for responding to low water pressure situations.
The ease of use also extends to communicating with critical customers. The ArcGIS Pro dashboards include contact information for healthcare facilities and other locations whose special water pressure needs are detailed for each possible scenario. By clicking on the contact information stored in InfoWater Pro, a template email can be automatically generated, which the city can then send to critical customers like hospitals with details about an emergency or planned maintenance event.
Susan Knepper joined us for a Water Talk about the project, which you can wath right here. 
Sign up for the One Water Blog newsletter, and we'll keep you updated about our top stories, along with the best content we find online. We only send out a newsletter when we have something interesting to share.
May we collect and use your data?
Learn more about the Third Party Services we use and our Privacy Statement.May we collect and use your data to tailor your experience?
Explore the benefits of a customized experience by managing your privacy settings for this site or visit our Privacy Statement to learn more about your options.