Global Launch at Autodesk is the time of year that marks the release of the latest innovations for our software.
We are excited to announce several new features that we’ve added to Info360 Insight, our SaaS-based software for helping you drive more efficient water and wastewater network operations — and better high-level decision making.
Build a library of analytic templates
Analytic templates provide a foundation for users to work with, allowing them to make specific changes and adjustments based on their individual system and analysis needs. You can now create customizable templates for simple analytic processes – or even more complex custom analytics that incorporate multiple data streams.
Our new template libraries make it easy for you to distribute and share insights with internal teams or engineering service providers, streamlining data sharing and increasing collaboration. As an admin, you’re in control of which templates can be shared, so you can make it as open or restricted as you need.
Enhanced I&I wastewater analytics
One of the biggest wastewater system problems to solve is understanding the effects of unwanted infiltration and inflow (I&I) from sources other than the intended wastewater discharge – sources like stormwater, infiltration from groundwater, defective pipes, or illegal connections. Minimizing I&I is always a top objective for utilities and councils.
I&I analytics in Info360 Insight can play a vital role in helping you understand the performance of your wastewater network and help you minimize I&I. Using Info360’s flexible analytic toolsets on SCADA and IoT monitors, you can find areas where I&I are highest and focus your maintenance, inspection, and capital planning activities accordingly.
Pump performance analytic enhancements
We have improved our pump performance workflows with enhanced data exploration tools to allow you to view all data at all intervals at any time range. The pump performance toolset in Info360 Insight also now supports booster pumps, allowing you to assess performance relative to manufacturer specifications. Your team members can now configure input suction pressures and add fixed corrections for physical offsets of pump sensors.
The Pump Performance Chart now allows you to visualize a whole new set of additional pump performance metrics:
- Observed Flow vs Pressure
- Manufacturer specs for Flow vs Pressure
- Observed Flow vs Energy
- Manufacturer specs for Flow vs Energy
- Manufacturer specs for Flow vs Efficiency
Optimizing your pumps can save you an enormous amount of energy – and money. Read how Stantec used Info360 Insight to help Wellington Water save 20% on electricity costs.
A direct connection with ArcGIS Online
ArcGIS Online’s interactive web mapping tools have become indispensable to many water professionals. Now you can connect to ArcGIS Online and bring spatial layers, asset geometry, and information into Info360 Insight and integrate your ArcGIS Online geospatial data with Info360 analysis and visualisation tools.
Admin users can quickly and securely set up the integration by providing their ArcGIS user credentials. Once set up, this direct connection to ArcGIS Online eliminates the need for data duplication or exporting, helping you improve your data accuracy and preventing errors in data management.
In a future release, we plan to implement the reverse process, giving you the ability to publish content from Info360 applications to ArcGIS Online. You can stay updated on what’s coming next by following along with our public roadmap.
OPC-UA connection for SCADA platform integration
The Info360 Insight data connector now supports the OPC-UA protocol and direct interfacing with OSI PI historians, simplifying the integration and configuration with existing SCADA systems data historians and reducing the time for deployment and value for users accessing data from multiple data sources.
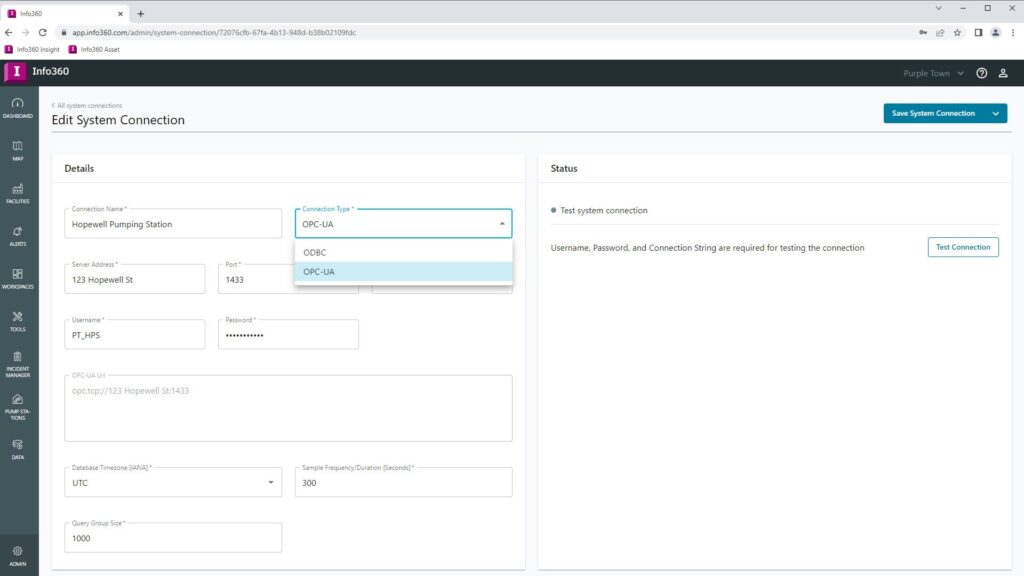
By adding more database support, including SQL, Oracle, MySQL, OSI Pi, and now OPC-UA, we know we can make it easier for our customers to get the most out of the data they collect – in the format that they prefer.
Candlestick charts
Candlestick charts have been added to tank and reservoir analysis in Info360 Insight. These candlestick charts provide a visual representation of sensor data movements over a specific period of time, enabling you to identify trends and patterns in tank and reservoir data.
Each candle on the chart represents the opening, closing, high, and low values for the time period being analyzed, allowing you to make informed decisions based on rich visualisations of your data.
Get started with these updates
We are excited about these latest developments in Info360 Insight and will continue working with our customers and engineering service providers to provide the best possible experience. You can get started with these new enhancements by signing into Info360.com.
Special thanks to Technical Marketing Manager Youssef Al Fahham and Product Manager Peter McIntosh for their help in compiling this update.