Utilities sometimes spend large amounts of money on non-revenue water. If you spend hours developing annual water loss reports to track the money you spend on non-revenue water, you may be eager to find a leakage strategy to reduce these losses throughout your water network, for both transmission and distribution.
While leakage strategies may mean different things in different countries, different utilities, and even different departments, broadly speaking, a leakage strategy can be broken into three key areas:
- Strategic overview
- Zonal planning
- Operations
Let’s explore these three areas.
1. Water loss and leakage strategy overview: how to create one
In reviewing an assessment of the full network to assess current levels you need to be able to quantify the leakage and where the highest areas are. This is widely done using Infrastructure Leakage Index (ILI), mass balance, and minimum nightly flows to estimate background leakage from available flow and pressure data. These calculations, when done on each area, can enable a systematic approach for reducing water loss.
By proactively managing and performing calculations on a frequent basis, leakage and target areas can be assessed and a project programme can be developed. In addition to using Autodesk software, an operational analytical platform can simultaneously be creating reporting and assessments in near real-time.
Hydraulic modelling can leverage such assessments with the enhancement of more detailed network results and analysis. InfoWorks WS Pro allows connection of field telemetry data to be linked to assets within the model. This allows a comparison of modelled expected data and live data in a geographical platform.
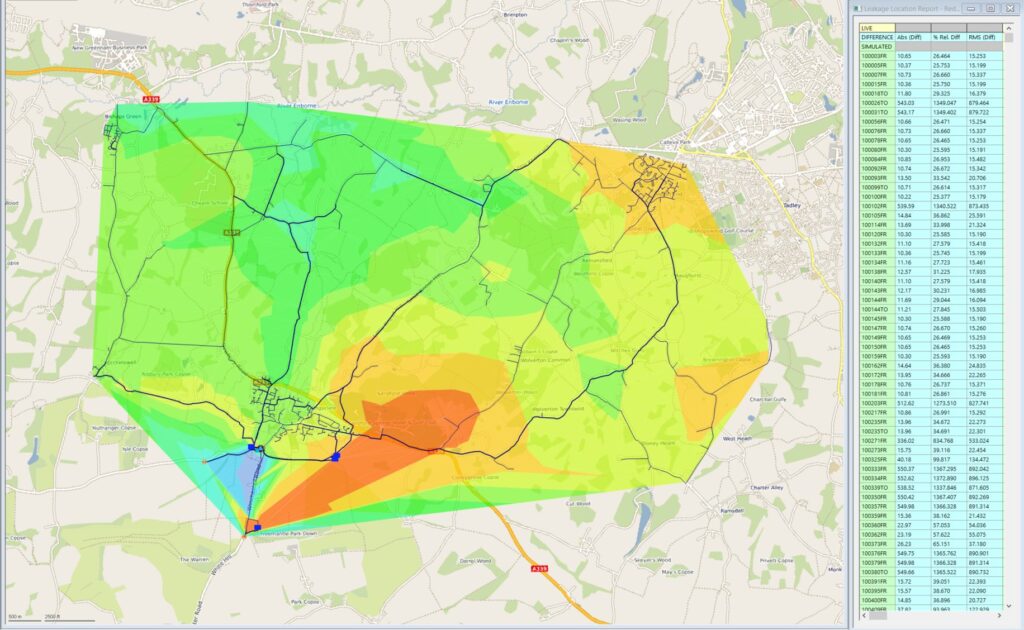
The connection of this data enables applications within the software such as Leakage Locator, which can help identify an area of a suspected new leak. Using a leakage flow rate, the leakage locator simulations can be used to narrow down the area in which the leak is most likely to be located, by comparing simulated and observed pressures at monitored locations.

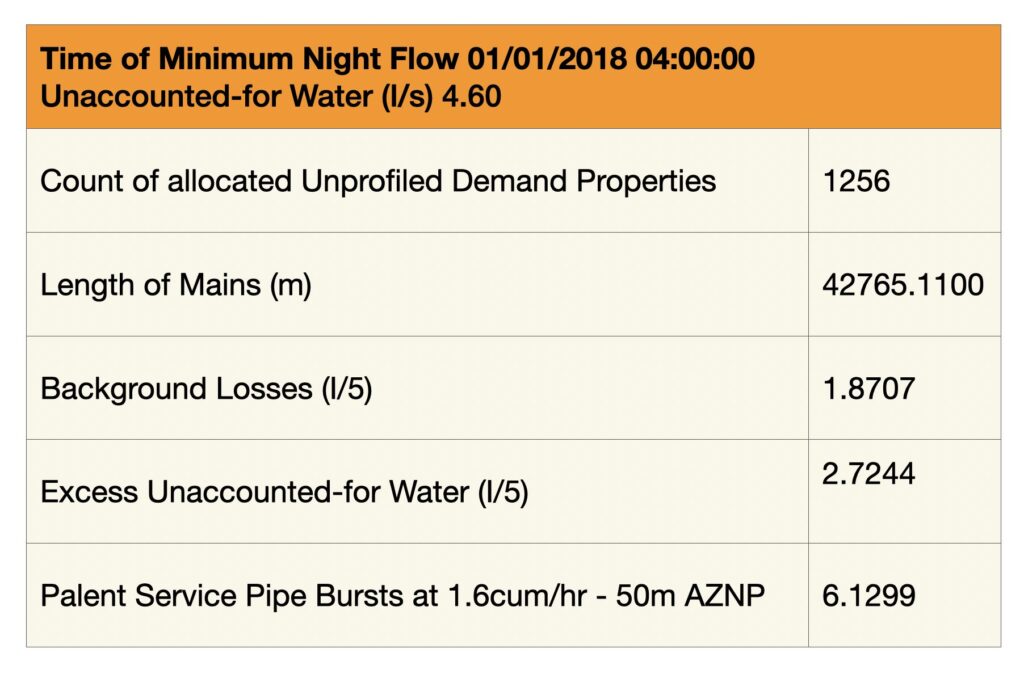
Demand assessments can also give an indication of the volume of excess revenue water and the volume that can be reduced in each area. The Demand area analysis function in InfoWorks WS Pro provides a deep analysis on the water consumed within each Demand Management Area (DMA). This allows all water supply areas to have the background losses/expected leakage calculated using the customers and mains length.
The total non-revenue water can then be calculated as well as the calculation for each area what the excess unaccounted for water is. This can help drive the focus of project programmes to the areas where leakage can be reduced the most and which areas can be tackled to achieve targets the quickest. Leakage reduction can then be achieved by prioritising rehabilitation or pressure management taking into consideration the leakage rate in each DMA.

2. Developing zonal planning and resiliency
Zonal planning and resilience can be a key factor in reducing leakage, yet it is often overlooked. It enables a better understanding of the full network so investment can reduce leakage within areas of the network and can also be directed towards other schemes that reduce leakage, bringing benefit to other areas. Zonal planning can also benefit site surveys where there are questions over network configuration and deploying more live data sensors to capture data that can be assessed for leakage levels, helping users narrow down their analysis and begin to evaluate leakage rates in different branches with the same DMA.
Hydraulic modelling can provide assessment of critical network pipes which are the most at risk for affecting large populations. This process helps to direct projects to ensure resilience if there is a burst to look at other valving options. Having the capability to assess these critical pipes and simulate the effects on the network is a great advantage of hydraulic modelling.
Pipe break analysis means you can replicate leaks and bursts on pipes of differing size (diameter and volume). Subsequently, this will enable you to monitor the supply and pressure customers will achieve. By replicating current leaks that are found, the volume of water loss can be calculated and can help with reporting towards reduction goals.
In addition, asset management tools such as Info360 Asset allows operators and managers to evaluate the structural conditions of their networks by conducting risk and reliability analysis based on likelihood and consequence of failures. It also assists in developing optimised rehabilitation and maintenance plans taking into consideration a lifecycle cost analysis.
Hydraulic and structural conditions combined to the criticality of failure for each element within the network allow a much better planning and a more efficient pressure management and consequently a leakage reduction.
Pressure management is a global network design method to reduce leakage in specific areas of the network with pressure reducing or sustaining valves. These can be modelled using the in-built valves and valve curves within InfoWorks WS Pro in order to achieve the optimal location, pressure and design for the network.
Pressure vary throughout the day and can be configured to maintain pressure based on a point within the network (most commonly critical point).
The proprietary engine within InfoWorks WS Pro allow for the accurate modelling of these planning exercises for the full network. Simulation parameters such as drain down, recharge, and pressure-related demand functionality allows the system to use demand and pressure in the system to gain a more accurate result. In some other modelling packages, as soon as there is an isolated area, results show no pressure and supply instantly, but this isn’t realistic and can generate inaccurate results.
Innovyze’s water distribution modelling software allows these assessments to be carried out quickly and on the whole network due to unique functionality enabling simulations to be performed in parallel on remote computers as well as in the cloud.
3. Operation: isolate and fix
As the programs and plan generated from some of the points above the operations team are used to isolate and fix that leak. There is a range of technology on the market to find the exact location of background leaks including acoustics when assessments, as discussed above have found the general area of high priority and biggest benefit.
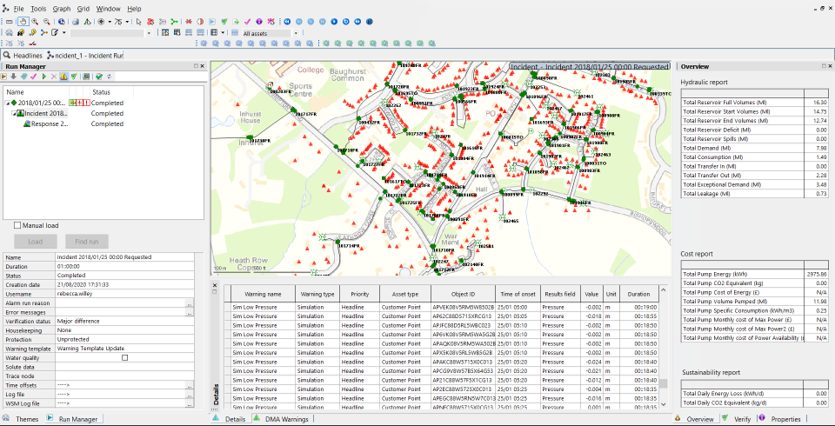
Moving forward, there should be continuous monitoring of assets and leakage to ensure that low leakage levels don’t increase. Leveraging the power of hydraulic modelling, operations teams can connect telemetry/SCADA systems with demand forecasting to run forecasts of the network behaviour into the coming hours and days.
User-defined warnings and alerts are generated to identify operational problems in real-time, including leakage, forecast network conditions and testing for the optimal “what-if” scenarios to understand the best outcome before the problem occurs or if a leakage plan was being implemented on the network.

Models also allow for emergency planning to be tested in advance, a large burst, main failure or isolation may require valve settings to be overwritten, pump configurations to change. These can all be tested in a hydraulic model and a process compiled to ensure this is done as efficiently as possible with minimal effect and that customer service is maintained.