In 2016, an outbreak of campylobacter in the Havelock North community of New Zealand resulted in four deaths, 50+ people hospitalized, and over 8,000 illnesses — affecting about a third of people in the community and surrounding area. The likely culprit was sheep faeces draining into a shallow aquifer after a heavy rainstorm event.

Considering that only 63.9% of New Zealanders drink “demonstrably safe” water, this was an excellent opportunity for the New Zealand government to respond strongly, which they did by creating a brand-new governing water services regulator called Tauata Arowai, which is responsible for regulating quality for drinking water, wastewater, and stormwater. Since then, this group has worked diligently to institute an assurance that requires water providers to regularly monitor and report on the quality of their water, which they’ve begun doing through a new online platform called Hinekōrako.
A web-based portal for reporting water quality
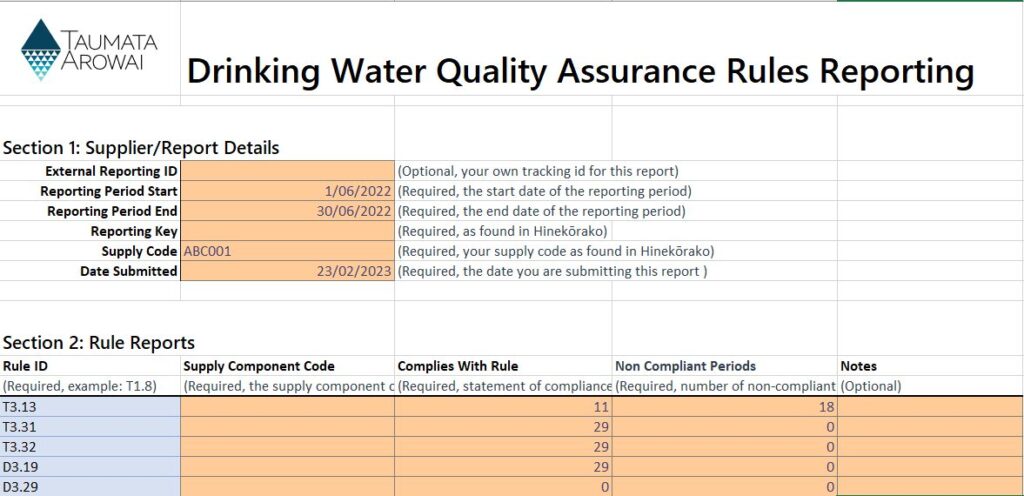
The web-based Hinekōrako portal is designed so that water providers can upload specially formatted Excel spreadsheets as regular reports, but the portal goes even further by encouraging laboratories to share information and by making much of this collected data available as a public registry. Citizens can also use this portal to check up on the record of their water provider and even provide complaints and feedback about the quality of their water.
Taumata Arowai Data and Insights Manager Michael Howden has been instrumental in creating the portal reporting service. I saw him present about this topic earlier this year at SWAN’s APAC Alliance workshop in Melbourne. Michael spoke passionately to the role technology provides in bringing compliance reporting into the 21st century and the significance of Taumata Arowai’s place in New Zealand’s water data ecosystem.
Efficiency depends on standardisation
And, indeed, the building of Hinekōrako shows an impressive level of innovation and transparency. Software-based technologies like this can improve the lives of both water providers and water consumers, without the need to invest in or rebuild expensive infrastructure.
From a water provider’s perspective, this scheme makes sense. If it saves lives and makes the water supply safer, it’s absolutely worth the effort. But any new regulation that requires them to share data presents a basic organizational problem that needs to be solved: Who in our organization will be responsible for gathering data and submitting the reports? How do we ensure we always submit those reports correctly — and on time?
While we may all be accustomed in our contemporary lives to looking up and using similar websites, this kind of publicly available resource for water that relies on partnerships between public and private entities to share data requires easy-to-follow processes to be successful. For water providers, that usually means submitting reports formatted as Excel spreadsheets.
The good, the bad, and the Excel
While not perfect, Excel is perhaps the water professionals’ best friend. It’s a ubiquitous format that engineers regularly turn to because it’s so familiar. Indeed, many regulatory bodies provide Excel templates to water providers as meticulously formatted spreadsheets because it is easy for regulators to import data from Excel into a wide variety of databases – provided the water provider compiles their spreadsheet correctly.

But this process isn’t always easy for water professionals. You may need to collect supporting data from multiple disconnected systems and manually input the data or copy and paste with varying levels of success. You may be able to write scripts that can ease the burden of transferring some data into your spreadsheet, but it can be difficult to create a reliable scripting workflow that won’t occasionally break. Also, the way to compile these reports isn’t always internally documented sufficiently so that others inside an organization can perform this siloed task, which means this workflow can suffer from bottlenecks.
Version control and auditability issues can also arise when multiple people have circulated multiple copies, resulting in multiple people working with multiple spreadsheet files. Data integrity is an issue that arises from the human challenges alone – even before considering data quality from the field. This can be exacerbated by an ever-increasing volume and complexity of data.
These are the kinds of operational problems we seek to solve with Info360 Insight. If you’re tasked with this kind of regular reporting, we want to help you make this kind of regulatory reporting as automated and efficient as possible.
How Info360 Insight excels at reporting
To illustrate how to solve this kind of problem easily and reliably using Info360 Insight, we created a fictitious water provider, Emerald Water Utility to show how a New Zealand water provider could directly report on Taumata Arowai’s Drinking Water Quality Assurance Rules (DWQAR).
The dashboard for Emerald Water Utility shows the entire treatment process that raw water will follow, along with the plant’s overall capacity and key metrics from the last 24 hours.

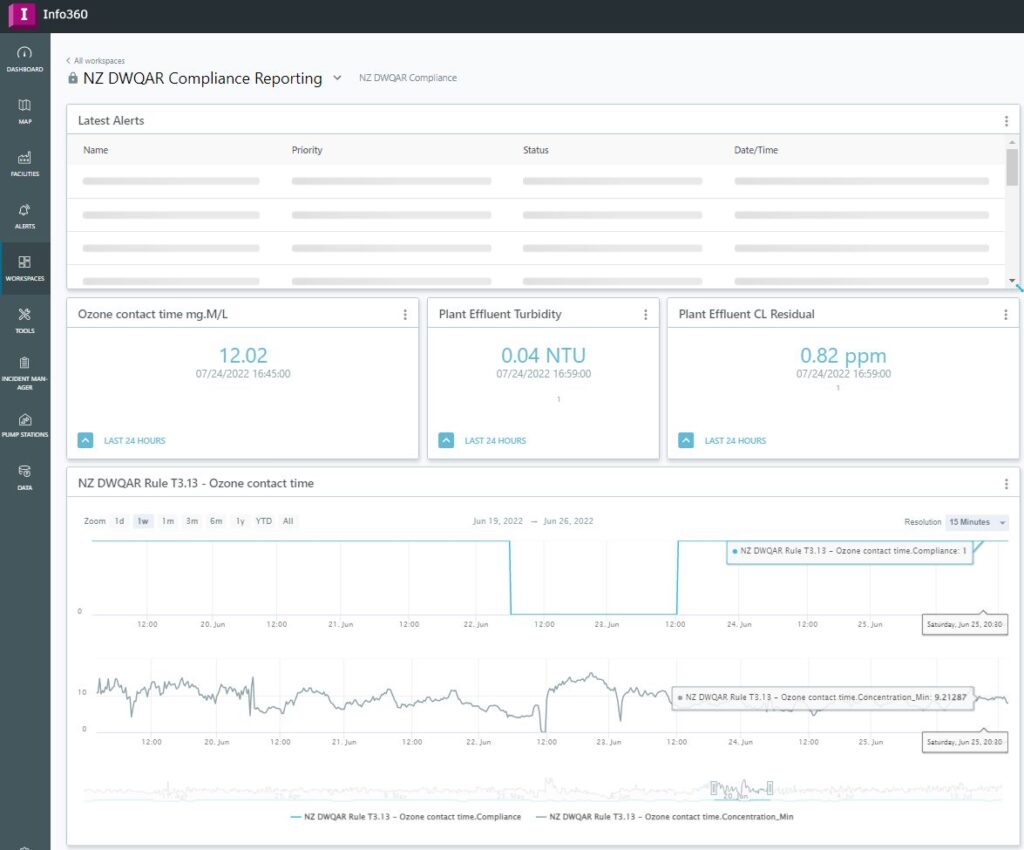
As a proof of concept, we created a Workspace to track water quality that is explicitly based on the Excel template that Hinekōrako provides, and we which we are calling “Drinking Water Quality Compliance”. We included key metrics, specific compliance rules that need to be met, historical charts, and even handy notes (in red) to help users interpret or understand important details about the results.
In our example, we’ve included specific details water providers in New Zealand need to track like coagulation, flocculation, sedimentation and filtration process, and disinfection with ozone. For example, DWQAR Rule T3.13 concerns ozone contact time. We’re showing:
- Details of the rule that must be followed
- A simple returned value (1 = compliance; 0 = non-compliance) to determine compliance.
- Notes for users in red with any added context to help them interpret the results.

Deep analytics and handy alerts
User-built analytics are how you embed your compliance rules into an automated data process for viewing in digital workspaces and for outputting to your reports. The analytics you choose to track will process and calculate raw data from various sources, such as laboratory results and sensors, and generate compliance scores or values, allowing utility workers to track water quality compliance in real-time and dig down into specific historical analytics.
Falling into a state of non-compliance must be avoided, which is why we built user configurable alerts. For example, you could create an Effluent Turbidity Alert with a High priority to inform you if turbidity ever rises above 0.5. You can set up email alerts for individuals (yourself or others – even non-users) so email notifications fire when water quality metrics approach or breach compliance targets. By setting these alerts proactively, you can be confident that you can intervene and rectify any issues before they escalate.
Easy output whenever you need it
The big strength in Info360 Insight is in the reporting. When it’s time to submit your compliance report, simply generate the report as an Excel file populated with all of the right information for your chosen time period. Then, it’s simply a matter of uploading the file to Hinekōrako.
Having the ability to output a compliance report with this level of accuracy – and with this amount of ease – is powerful. As more and more water regulators move towards electronic submission, this will become an increasingly necessary option for water professionals, but even if your water regulator isn’t as progressive and forward thinking as Taumata Arowai, it’s easy to see how you can utilize this kind of capability on a regular basis.
If your water regulator insists on Excel, this capability will surely provide you with big productivity gains, but even if you don’t have to submit regular reports of this nature, having all this data at your fingertips will make you more confident, more organized, and more able to examine and improve your processes at a moment’s notice.
Special thanks to Solutions Engineer Brad Thompson and Product Manager Javier Cantu for their work contributing to this post.