With our latest updates, Info360 Asset introduces new features designed to enhance geospatial mapping capabilities and integrations with Esri. Plus we’ve added functionality to better incorporate work tasks from your field teams so maintenance, repair, and rehabilitation work is captured and available for risk and rehabilitation modeling.
A new mapping option: Esri basemaps
Earlier this year, we began integrating with Esri apps to push CCTV data to ArcGIS Online and to bring geospatial data into Info360 Asset so you can integrate it with your asset condition and performance data. Now, we have a big announcement for Esri enthusiasts: Info360 Asset maps now include the option for Esri basemaps, allowing you to align your map views in Info360 Asset and ArcGIS Online.
Esri basemaps are foundational map layers provided by Esri, the water industry’s most widely used geographic information system (GIS) software system. These basemaps serve as the backdrop for various GIS applications and include a variety of map types such as street maps, satellite imagery, and topographic maps.
Esri basemaps provide essential geographic context by displaying features like roads, terrain, water bodies, and landmarks. These maps can be invaluable for enhancing the management and analysis of water and wastewater networks, giving engineers the confidence to know the precise locations of network components and provide detailed geographic context for mapping network infrastructure such as pipes, valves, pumps, and treatment plants.
Admins can add Esri basemaps in Admin > General Settings. This will change the default for all map components throughout Info360 Asset. You can change the basemap on the Network Map by opening Layers and scrolling down to the list of basemaps.
Spatially filter asset selections
We have also improved the ability to locate assets on the map by applying spatial filters. You can use the polygon tool to draw an area where you want to examine multiple assets or by choosing an asset list. The asset list method allows you to find and select assets by applying additional filters or by selecting specific assets.
Query work tasks in rehab decision trees
When field crews conduct maintenance activities, they collect valuable data on pipe condition, identifying issues like blockages and structural defects and cleaning and repairing pipes and manholes. You can now bring this valuable field data into Info360 Asset’s risk and rehabilitation models by importing task from your current work order management system as CSV files. This can incorporate specific work tasks such as inspections, maintenance, and repair and rehabilitation activities into both your risk and rehabilitation analysis. When you integrate field data to update your asset risk profiles, you can prioritize work orders based on risk analysis, ensuring your high-risk assets are addressed first.
How does it work? Within Info360 Asset, user-defined work tasks have been added as a data type in LoF and CoF modeling. To apply a risk score to your assets based on data from work tasks such as repair type and cleaning method, create a component and select a task to represent a work order task. Select the Task Name and the specific Field you want to use based on the tabular fields you mapped when importing the work tasks, and Info360 Asset will use the data from the most recently completed work task for each asset.
You can also now bring work tasks into your rehabilitation decision trees. For example, let’s say you’ve created a simple query that searches the network for all pipes with root intrusions. To include work tasks for within your rehab decision tree for rehabilitation modeling, within a new query (while configuring a new rule) select “Task” and its associated repair type.
Apply a risk score to your CCTV defect codes
We’ve also now added the ability for you to specify risk scores for individual defect codes as part of the condition category within your LoF risk modeling calculations. This will make it easier for your sewer and drainage network risk analysis to be based on the actual condition of your assets.
You can create components for defect codes within Info360 Asset in your LoF setup to score pipes according to observed defects. When you navigate to the LoF setup section within Info360 Asset, input the specific defect code you want to include in your risk assessment (defects include collapsed pipe, large hole, pipe break, minor crack, root intrusion, etc), then assign a risk score to each specified defect code based on its severity. We’ve applied a “Worst Defect Score Rule” to ensure that risk scoring is based on the worst observed defect score from the latest approved PACP inspection for each pipe.
New risk analysis calculation options
Thanks to customer feedback, we have adjusted the risk model calculations to have a maximum score of 100. Previously, the highest fidelity you could assign LoF and CoF within your setup for each respective risk category was a value of 10. Extending the maximum values associated with each, from a maximum value of 10 to 100, allows for a wider scope of defining relative risk.
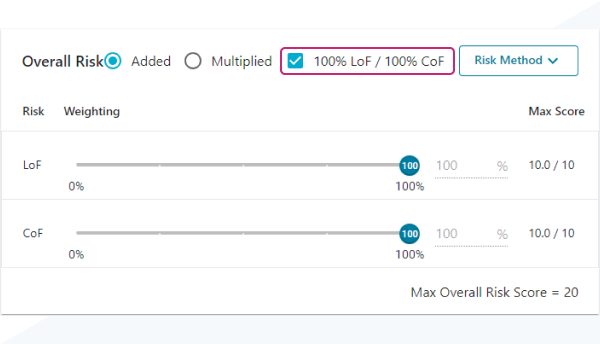
For a given asset within your network, when you want to look solely at LoF or CoF, you can now choose to use 100% of both LoF or CoF in your given risk score. Simply toggle the ‘100% LoF/ 100% CoF’ option within your risk score setup.

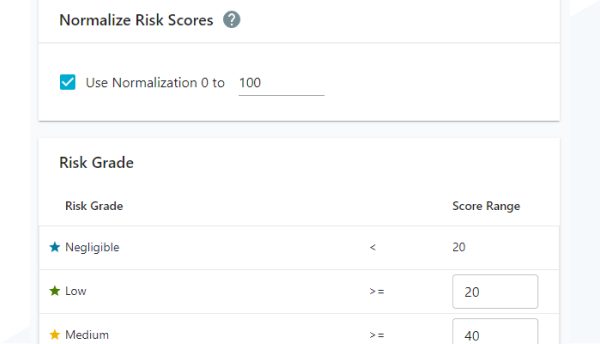
When you need to look at the relative risk of your assets, meaning for a given pipe or manhole, you may want to know what is the risk of that particular asset relative to the highest risk asset for your network? Risk scores can now be adjusted based on the normalization value you enter. Selecting a normalization value of 100 will allow you to represent your assets on a percentage basis relative to your highest risk asset, providing you with a view of a specific pipe’s risk score in comparison to your highest risk asset.

Your feedback has a meaningful impact
Your feedback played a big contribution in enabling improvements between Info360 Asset’s tabular and map views, applying detailed spatial filters, customizing risk scores with greater precision, and incorporating field maintenance data into risk and rehab planning. We always want to hear your feedback on the Autodesk Water Feedback Portal. And, of course, you can follow along with the progress of all our apps on the Autodesk Water Solutions Roadmap.