& Construction

Integrated BIM tools, including Revit, AutoCAD, and Civil 3D
& Manufacturing

Professional CAD/CAM tools built on Inventor and AutoCAD
& Entertainment

Entertainment content creation tools, including 3ds Max and Maya
Discover the main functionalities of Autodesk InfoWorks WS Pro, which helps hydraulic modelers effectively plan, design, and operate water distribution systems.
Multiple users can edit the same model simultaneously, with conflict resolution and version control
Build digital twins with automatic updates by connecting to third-party data like geographic information system (GIS) and Info360
Infer missing network values from existing data to fill in data gaps with reasonable values
Assign customer point and area-based (land use) demands to nodes in the network using various methods
Use the connection to telemetry to perform demand area analysis, calibration, and leakage simulations
Share computing resources across teams with multi-core simulations to maximize hardware resources, or leverage the cloud
Run a simulation many times using cloud scalability, modifying one or two values each time
Improve water systems, including fire flow, water quality, flushing, and pipe shutdown
Realistically represent pump and valve controls and demands, and model elements (hydrants, meters) explicitly
Find customers affected by an incident and show where parallel pipes can add resilience with criticality link analysis
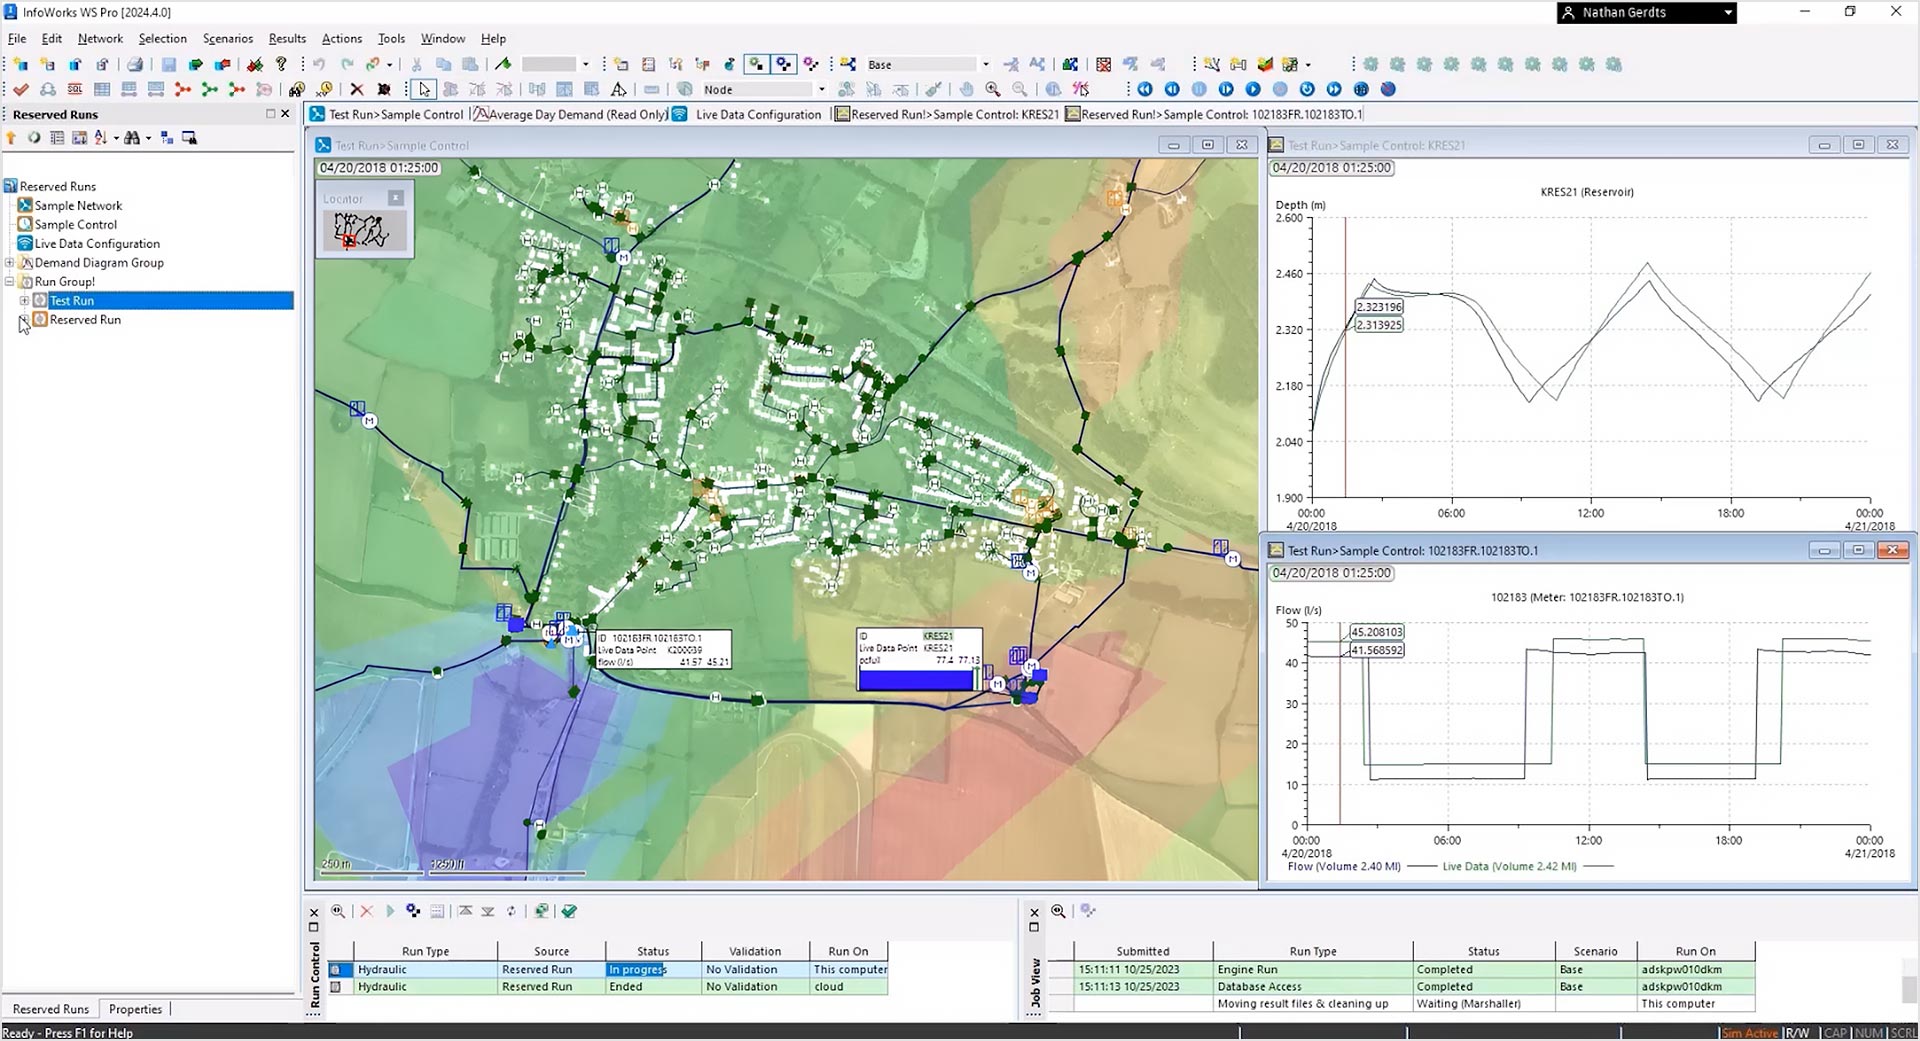
Color-coded contours and thematic maps of the network clearly show element properties and results
Use a built-in library of SQL (Structured Query Language) queries to review results and add as many queries as you need
ENHANCED
Improved model skeletonization
The InfoWorks WS Pro Skeletonizer tool is now enhanced with several improvements to reliably reduce complexity while ensuring consistent and accurate hydraulic behavior. In several test models, the improved toolset reduced 90% of the network in a single repeatable round of reduction. (video: 54 sec.)
NEW
Model Diagnostics
Simulation diagnostic information for each run’s engine log file is now available in an easier format to review, sort, map, and query. The Diagnostic tables summarize snapshot stability, nodes with the greatest imbalance of flow, unstable or unreliable regulator valves, pump and reservoir operation information, and suppressed demands. (video: 1:07 min.)
Database cross-version compatibility
InfoWorks WS Pro supports different versions of the database—enabling backwards compatibility—by toggling on available features and off unsupported functionality. When changing the version, you get a warning message that includes the impact of updating a master database. (video: 2:05 min.)
NEW
EPANET import
You can now import multiple EPANET models or files in one InfoWorks WS Pro model as scenarios. This update enables you to bring .inp files into InfoWorks WS Pro with ease, streamlining the transition process to InfoWorks WS Pro if you have data captured in other tools like WaterGEMS, InfoWater, Mike+, and EPANET.
Import and export of SQLs
By importing and exporting, users can now share the InfoWorks WS Pro subset of SQL between models and teams to select and update network objects using specified criteria.
Large data management
Import, track, audit, and interpret the large quantities of data associated with complex projects quickly and easily.
Tracing tools
Tracing tools (including Upstream/Downstream, Boundary, Connectivity, Proximity, and Isolation Trace) help you locate problems or anomalies in the network, identify isolated areas, and understand system layout.
Update demand patterns
from telemetry
As an essential part of the calibration process that precedes a simulation, InfoWorks WS Pro calculates a domestic demand profile within a demand management area (DMA). Automate this calculation to derive the patterns directly from observed telemetry data.
Demand area analysis
Demand area analysis interrogates live data to provide a time series of water usage, unmetered consumption, and water losses, including leakage.
Compare model elements
Compare elements and results in graphs, long section profiles, and annotations displayed on your network for a better understanding of the model.
