00:00
InfoDrainage is very powerful in its ability to calculate the appropriate sizes
00:08
and types of stormwater drainage system elements for you.
00:11
This is why, once you have successfully imported a CAD file that was started in Civil 3D,
00:17
you can complete the hydraulic design in InfoDrainage.
00:20
In this example, the manholes and pipes are all set at the same level and depth, all the way down the slope.
00:26
This is because they have not yet been designed to handle the correct amount of runoff for this area.
00:32
To begin, review the data for the first catchment.
00:36
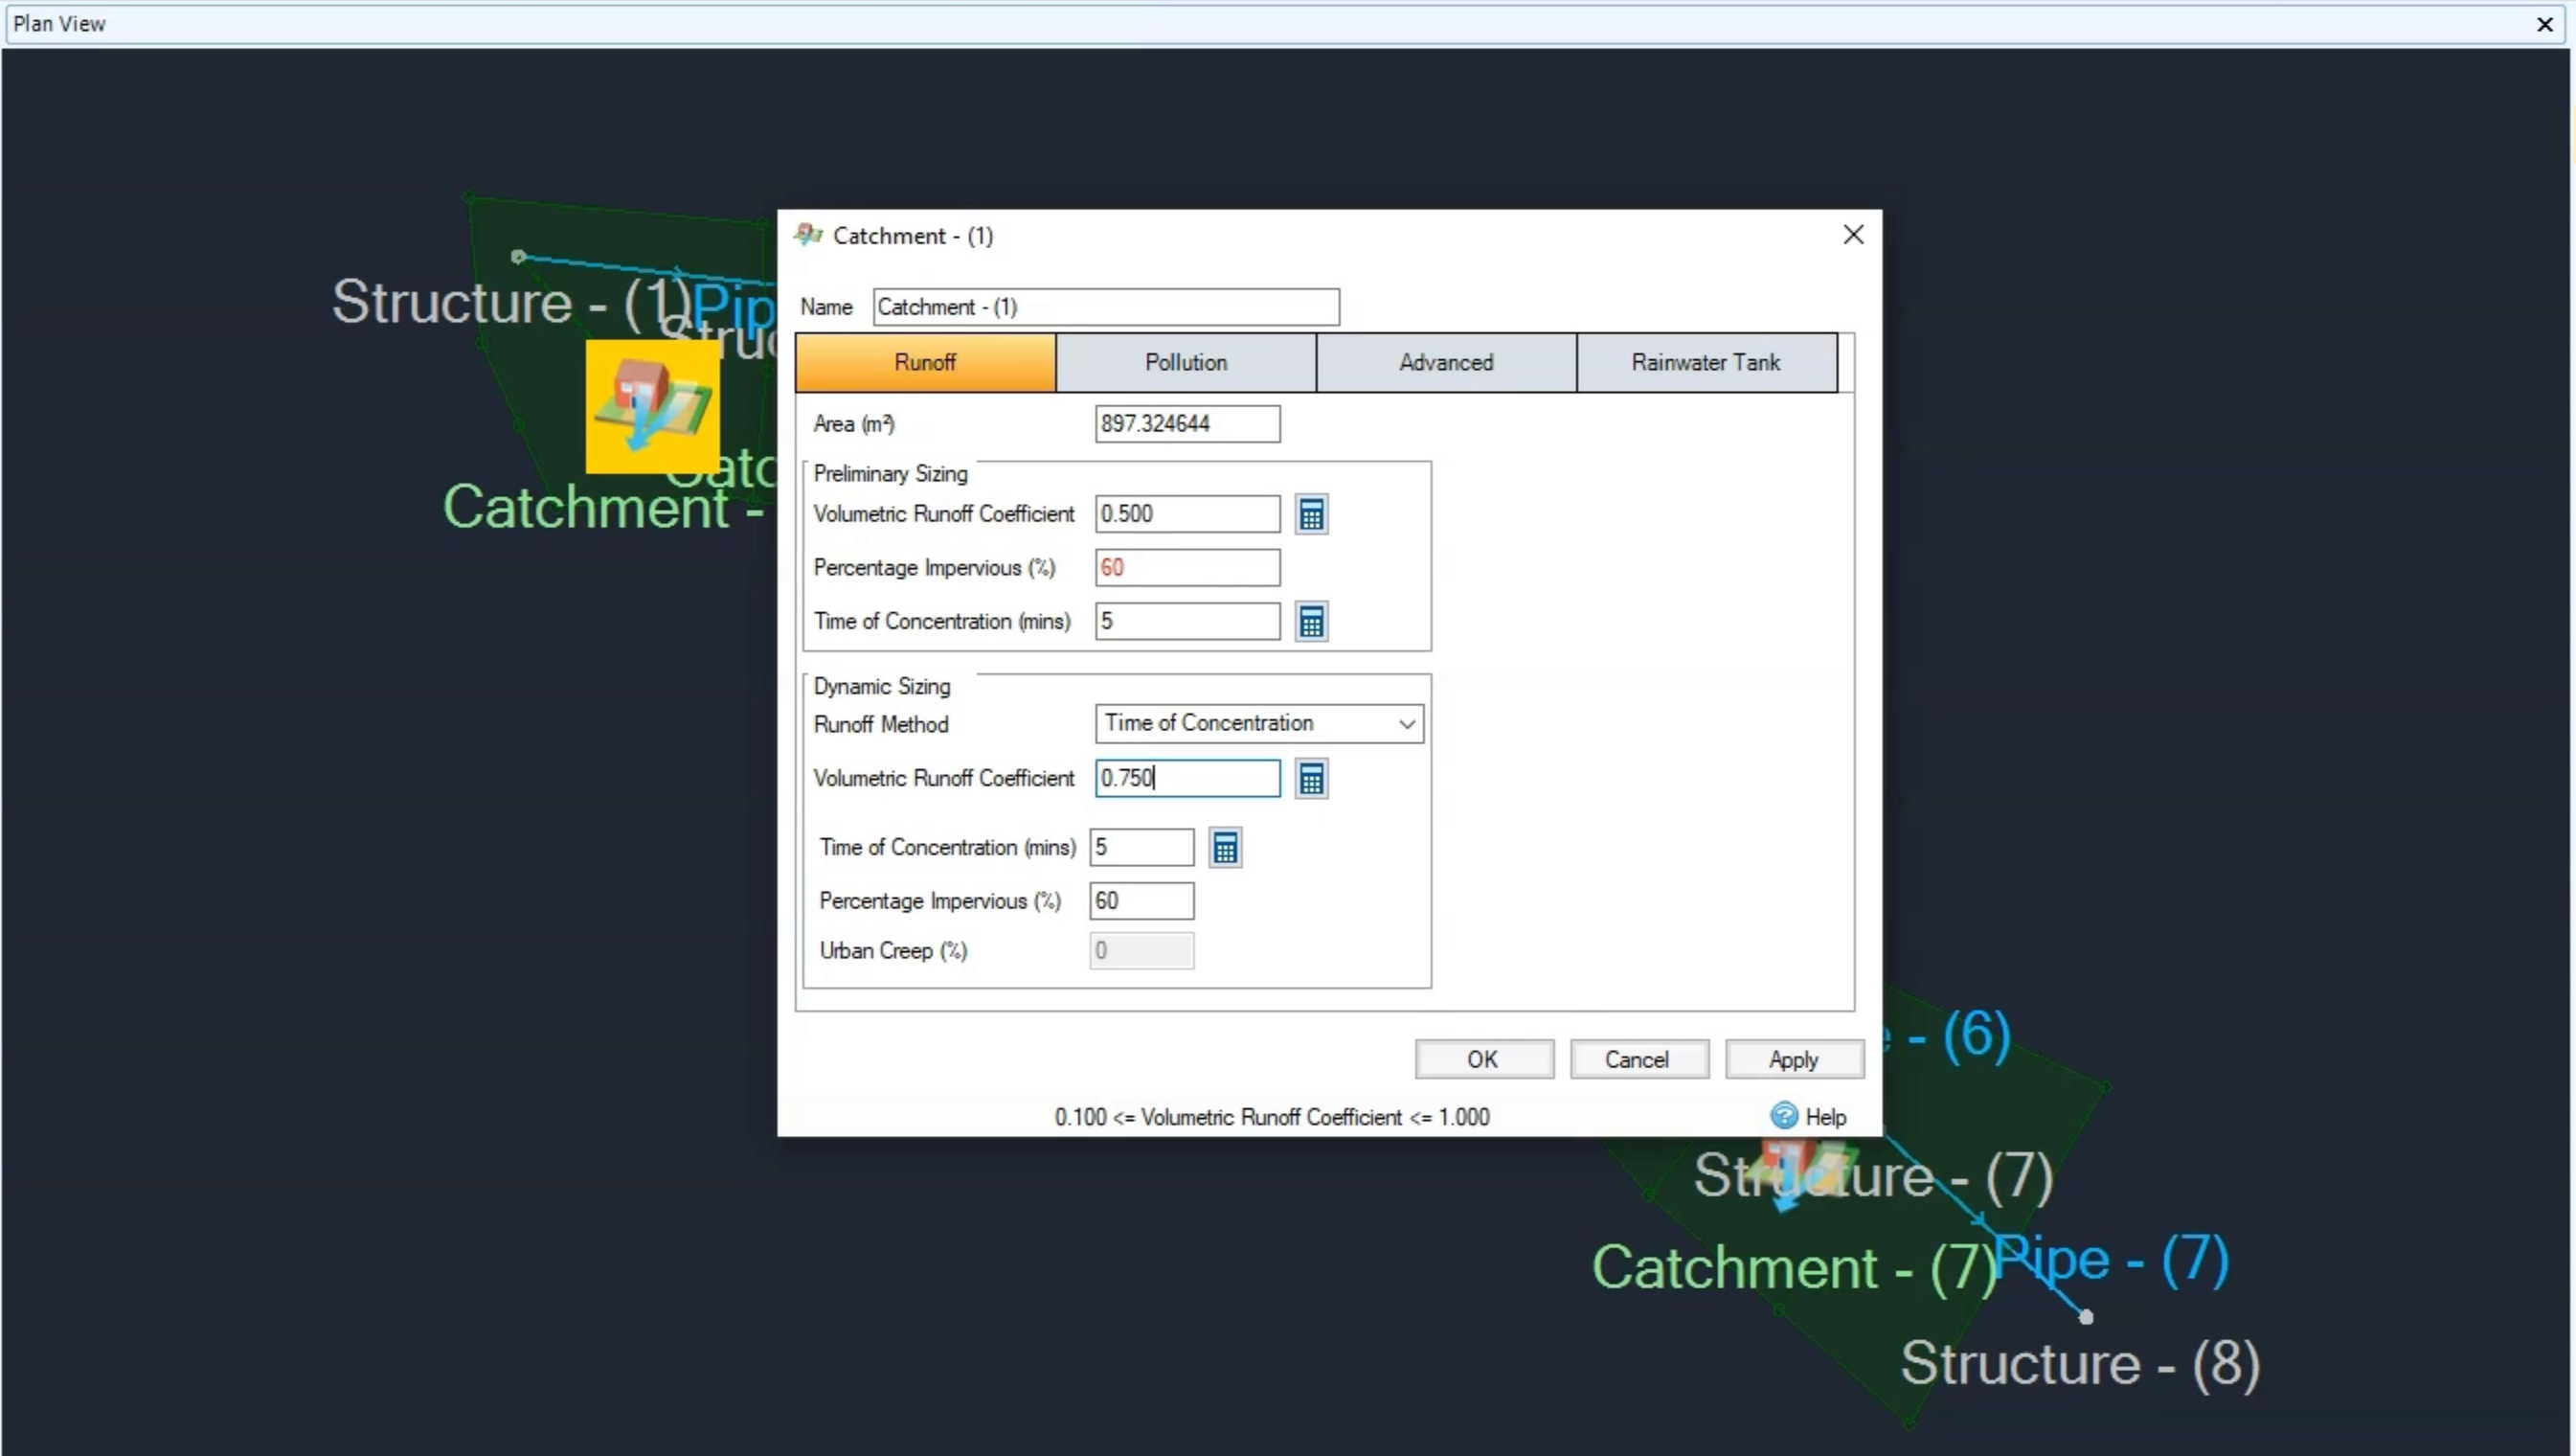
Place your cursor over the catchment icon and click to open its properties.
00:41
In the Catchment – (1) dialog box, on the Runoff tab,
00:45
you can see that the Volumetric Runoff Coefficient has been set to 0.500,
00:50
and the Percentage Impervious is set to 100.
00:53
However, since this is a typical suburban development and only the hardstanding areas contribute to the percentage impervious,
01:04
Optionally, you could perform a more detailed assessment of your subcatchments.
01:09
You could show the background surface data for all the roads and roofs
01:12
and then calculate the individual percentage impervious values for each subcatchment.
01:17
But for this exercise, the average value will suffice.
01:22
Next, enter a Time of Concentration of 5 minutes.
01:26
Also, set the Volumetric Runoff Coefficient to 0.75.
01:31
Again, these are typical values for these types of subcatchments.
01:35
The main idea here is that you do not need to accept the values that Civil 3D has provided.
01:41
You can change them to precise calculations or known values for the local area you are working on.
01:47
Rather than edit each subcatchment one at a time, you can make all your changes in a table.
01:53
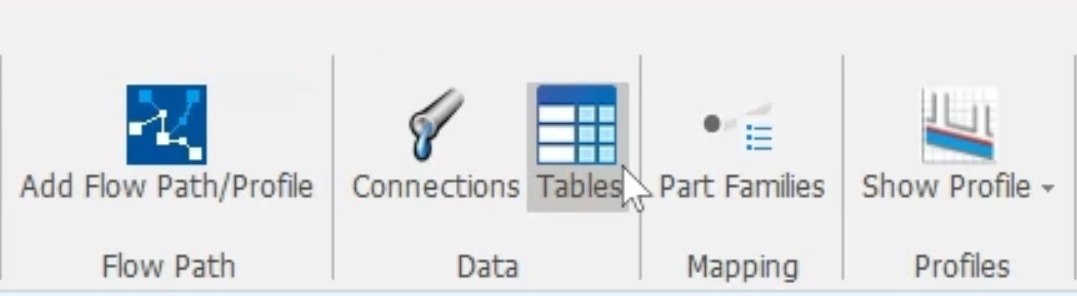
On the ribbon, Build tab, Data panel, click Tables.
01:58
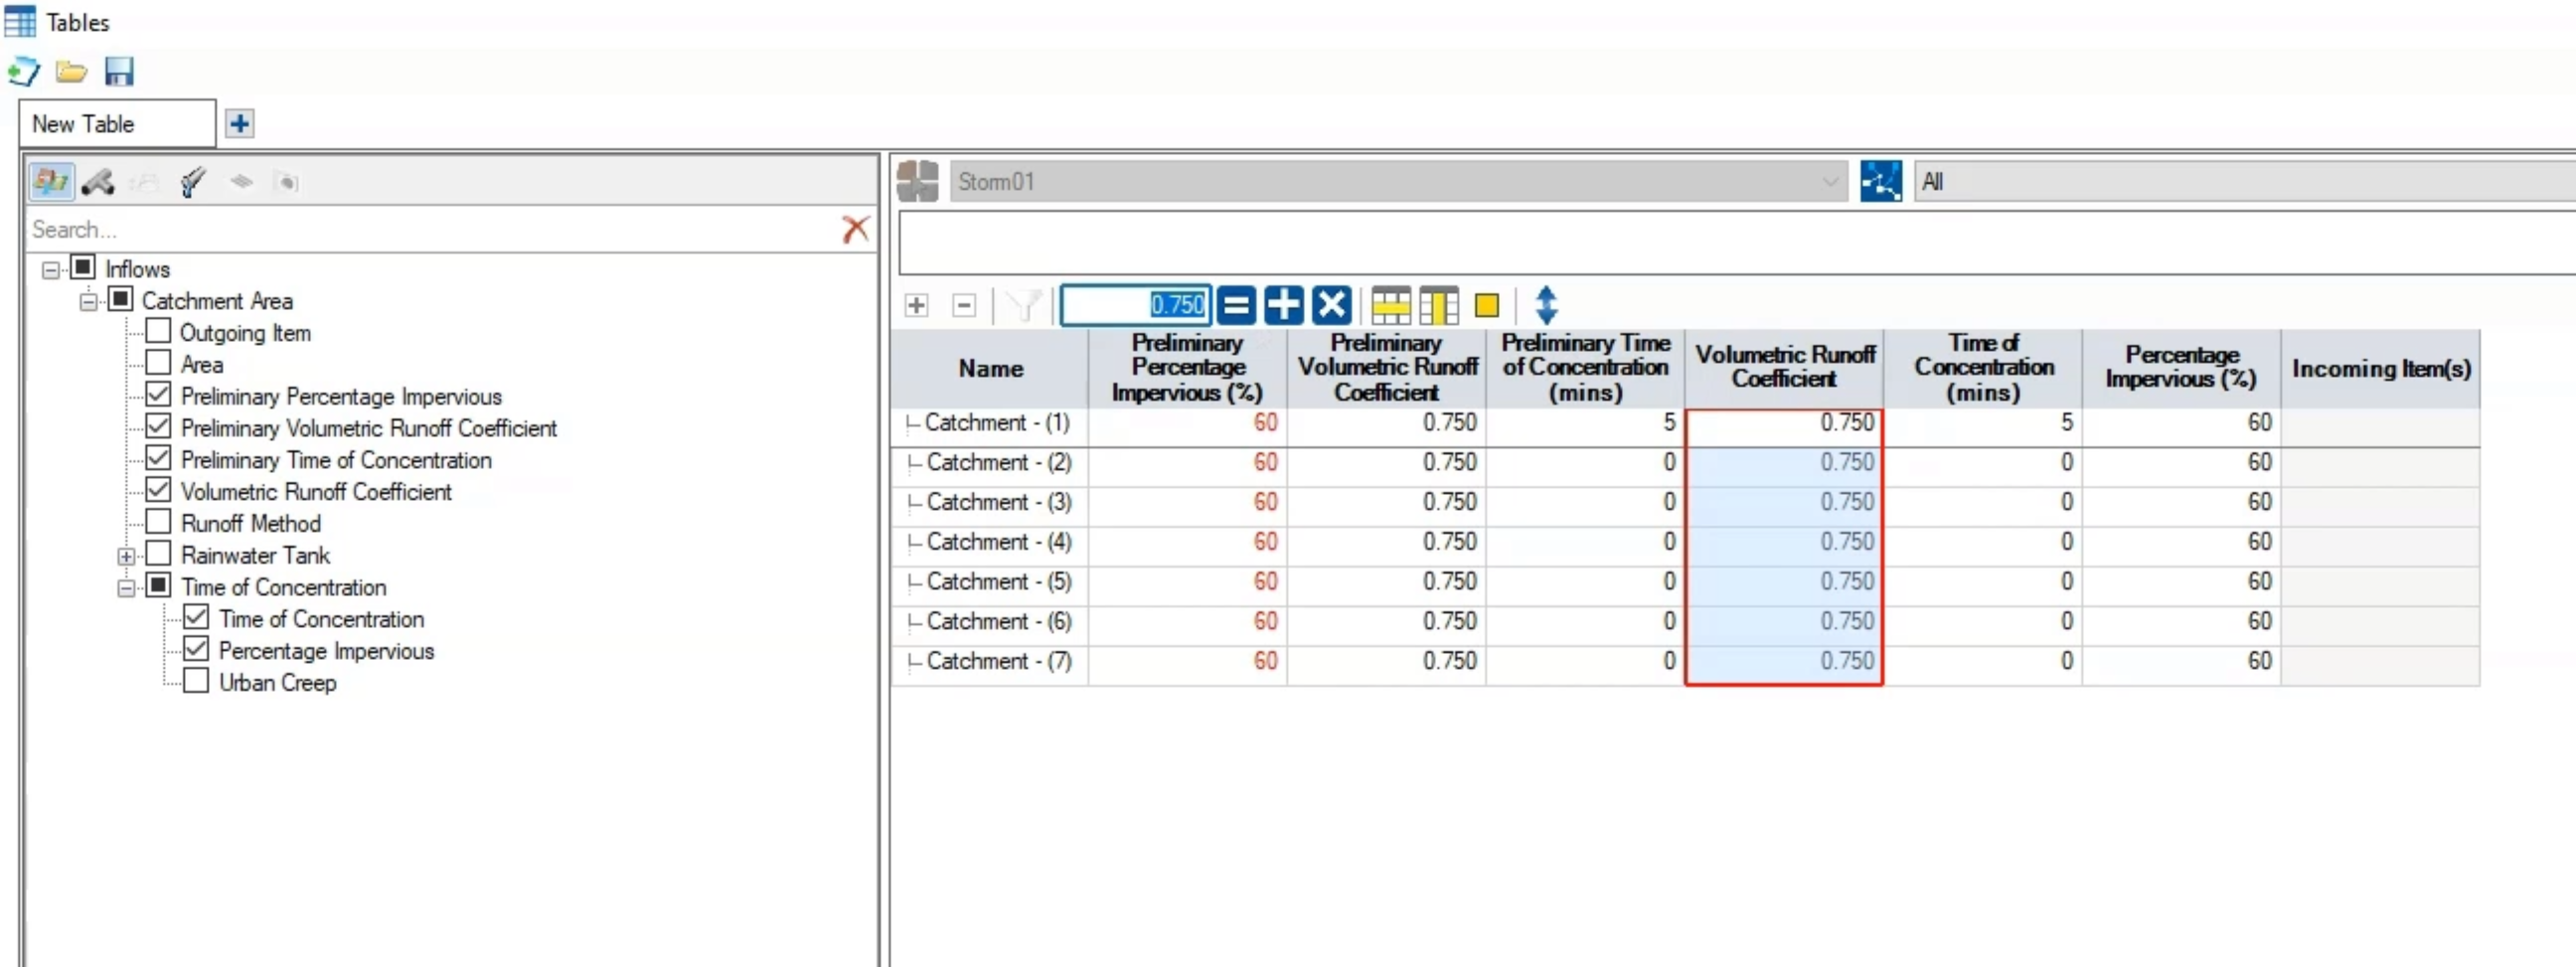
In the Tables dialog box, select the Inflows tool.
02:04
In the left pane, expand the Inflows node, and expand the Catchment Area node.
02:12
The options here control what data appears in the table.
02:15
Enable Preliminary Percentage Impervious, Preliminary Volumetric Runoff Coefficient,
02:21
and Volumetric Runoff Coefficient.
02:24
Then, expand Time of Concentration and enable Percentage Impervious.
02:29
In the Percentage Impervious column, select the first cell,
02:34
then click and drag to select all the cells.
02:37
Then, in the toolbar, enter 60 into the box and click the equals sign (=).
02:42
This changes the percentage impervious value for all the catchments in the model.
02:48
Notice that it automatically set the Preliminary Percentage Impervious value to 60 as well.
02:54
Next, select all the cells under the Volumetric Runoff Coefficient
02:58
and change those values to 0.75.
03:02
Notice that the Area values have all been calculated for you.
03:09
Now that the rainfall data and catchment parameters have been set up,
03:13
you can bring these together by configuring the analysis.
03:17
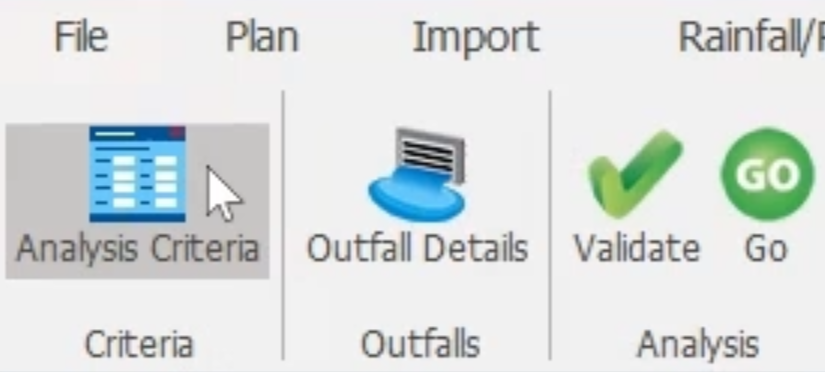
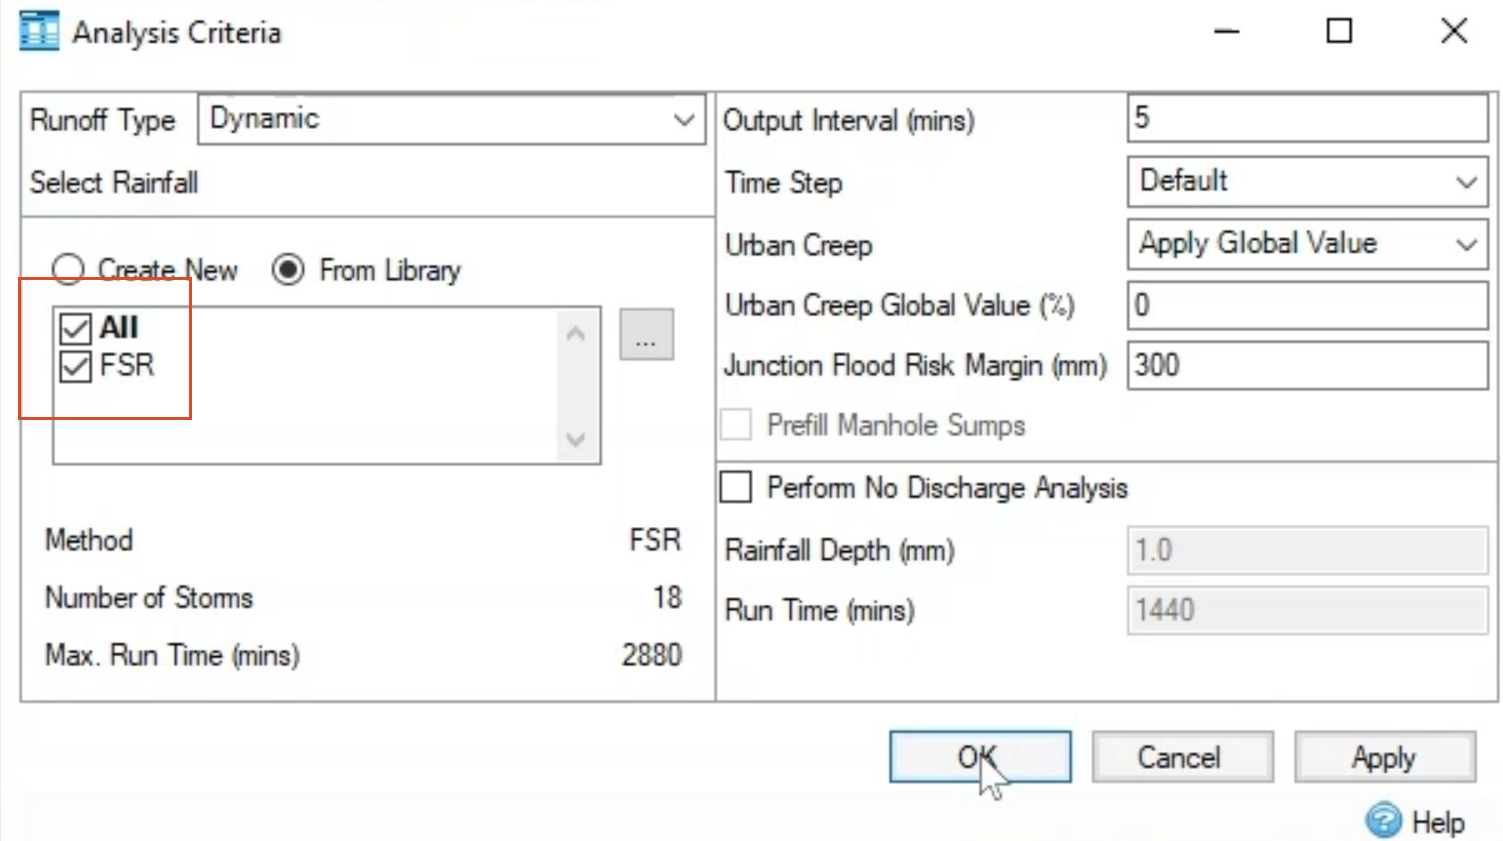
On the ribbon, Analysis tab, Critera panel, click Analysis Criteria.
03:23
In the Analysis Criteria dialog box, select both the All and FSR rainfall studies to enable them, and then click OK.
03:33
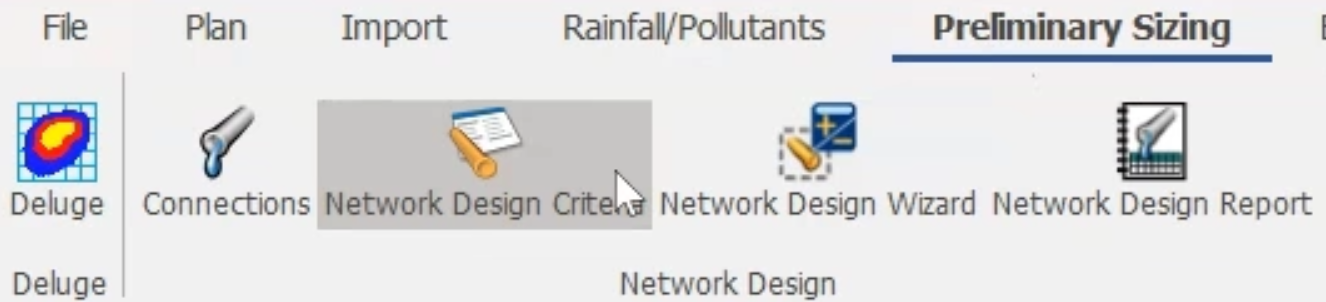
Next, you need to set up the preliminary sizing for the pipes.
03:37
On the ribbon, Preliminary Sizing tab, Network Design panel, click Network Design Criteria.
03:45
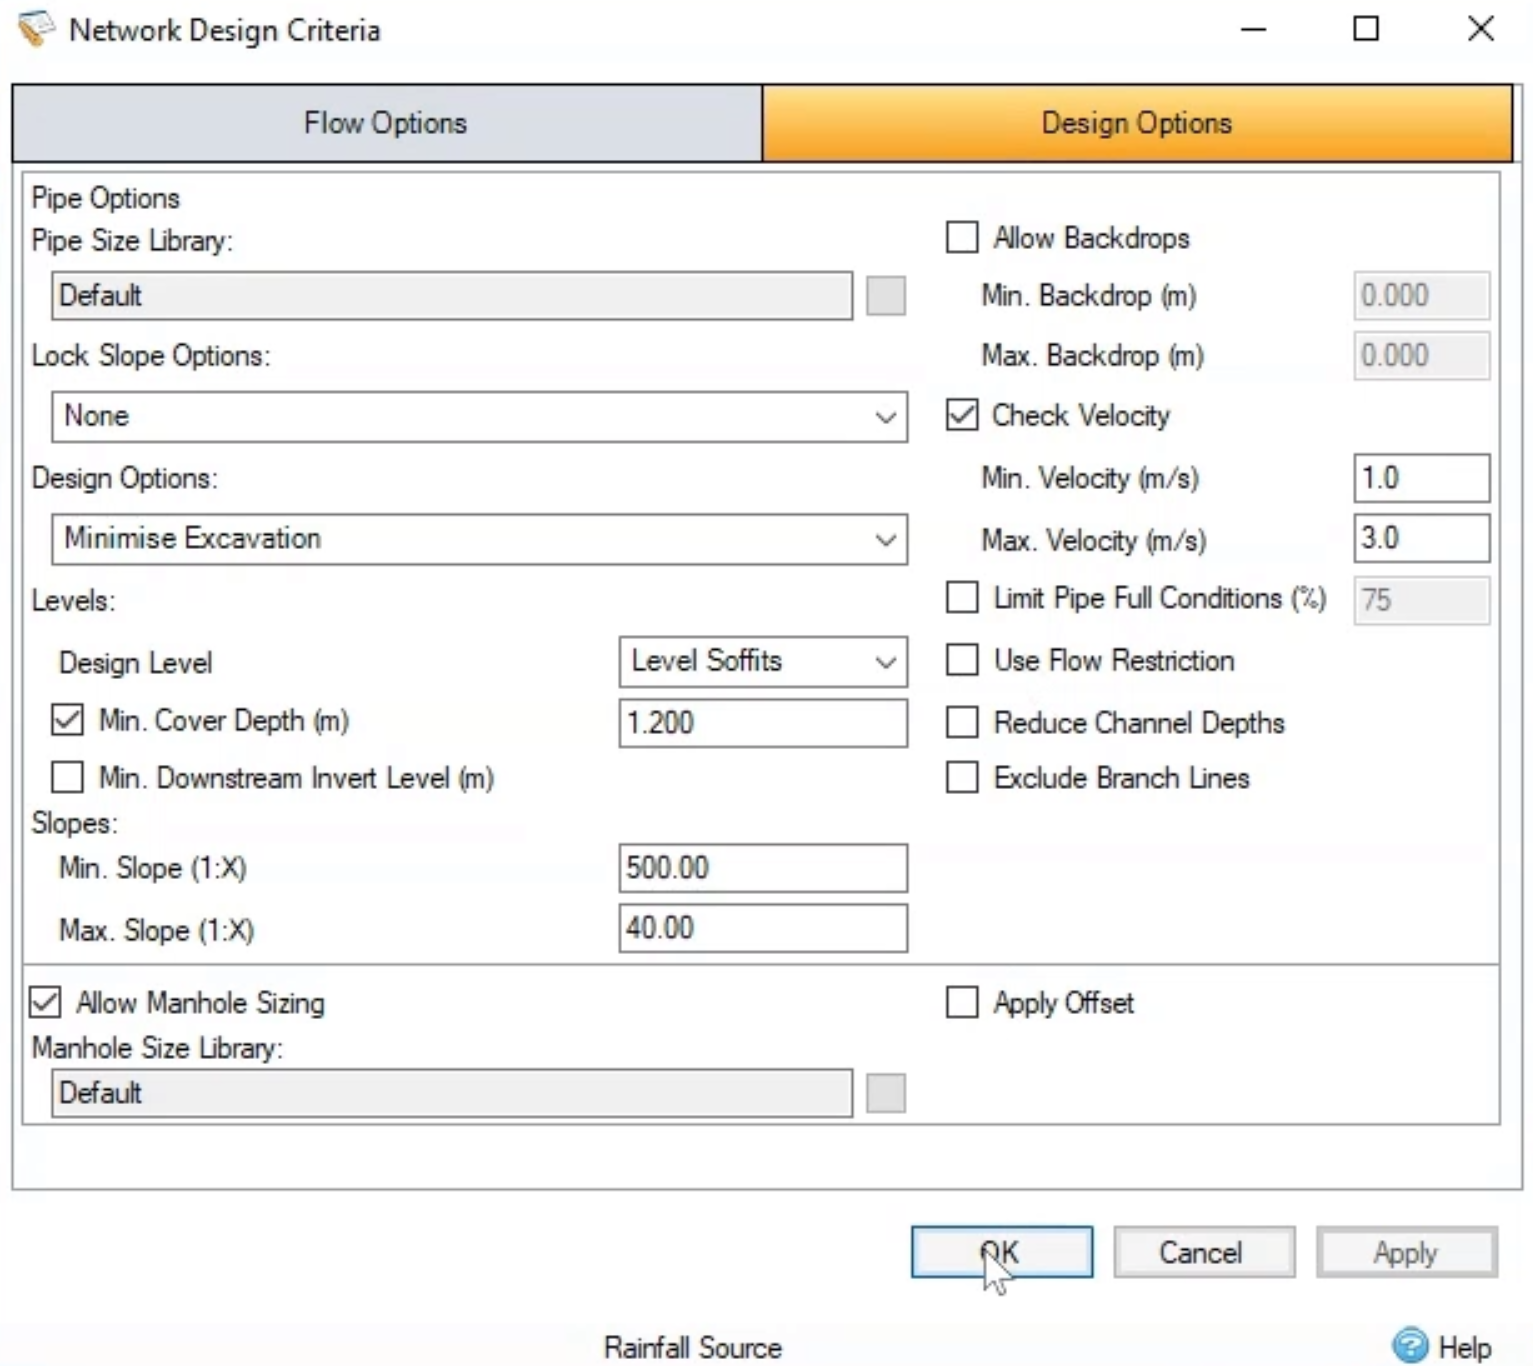
In the Network Design Criteria dialog, Flow Options tab,
03:49
expand the drop-down and select FSR.
03:53
Click the Design Options tab.
03:56
Here, you can choose to set a variety of pipe options,
03:60
including the pipe library, slope, level, backdrop, and velocity options, among others.
04:08
For this exercise, simply accept the defaults and click OK.
04:12
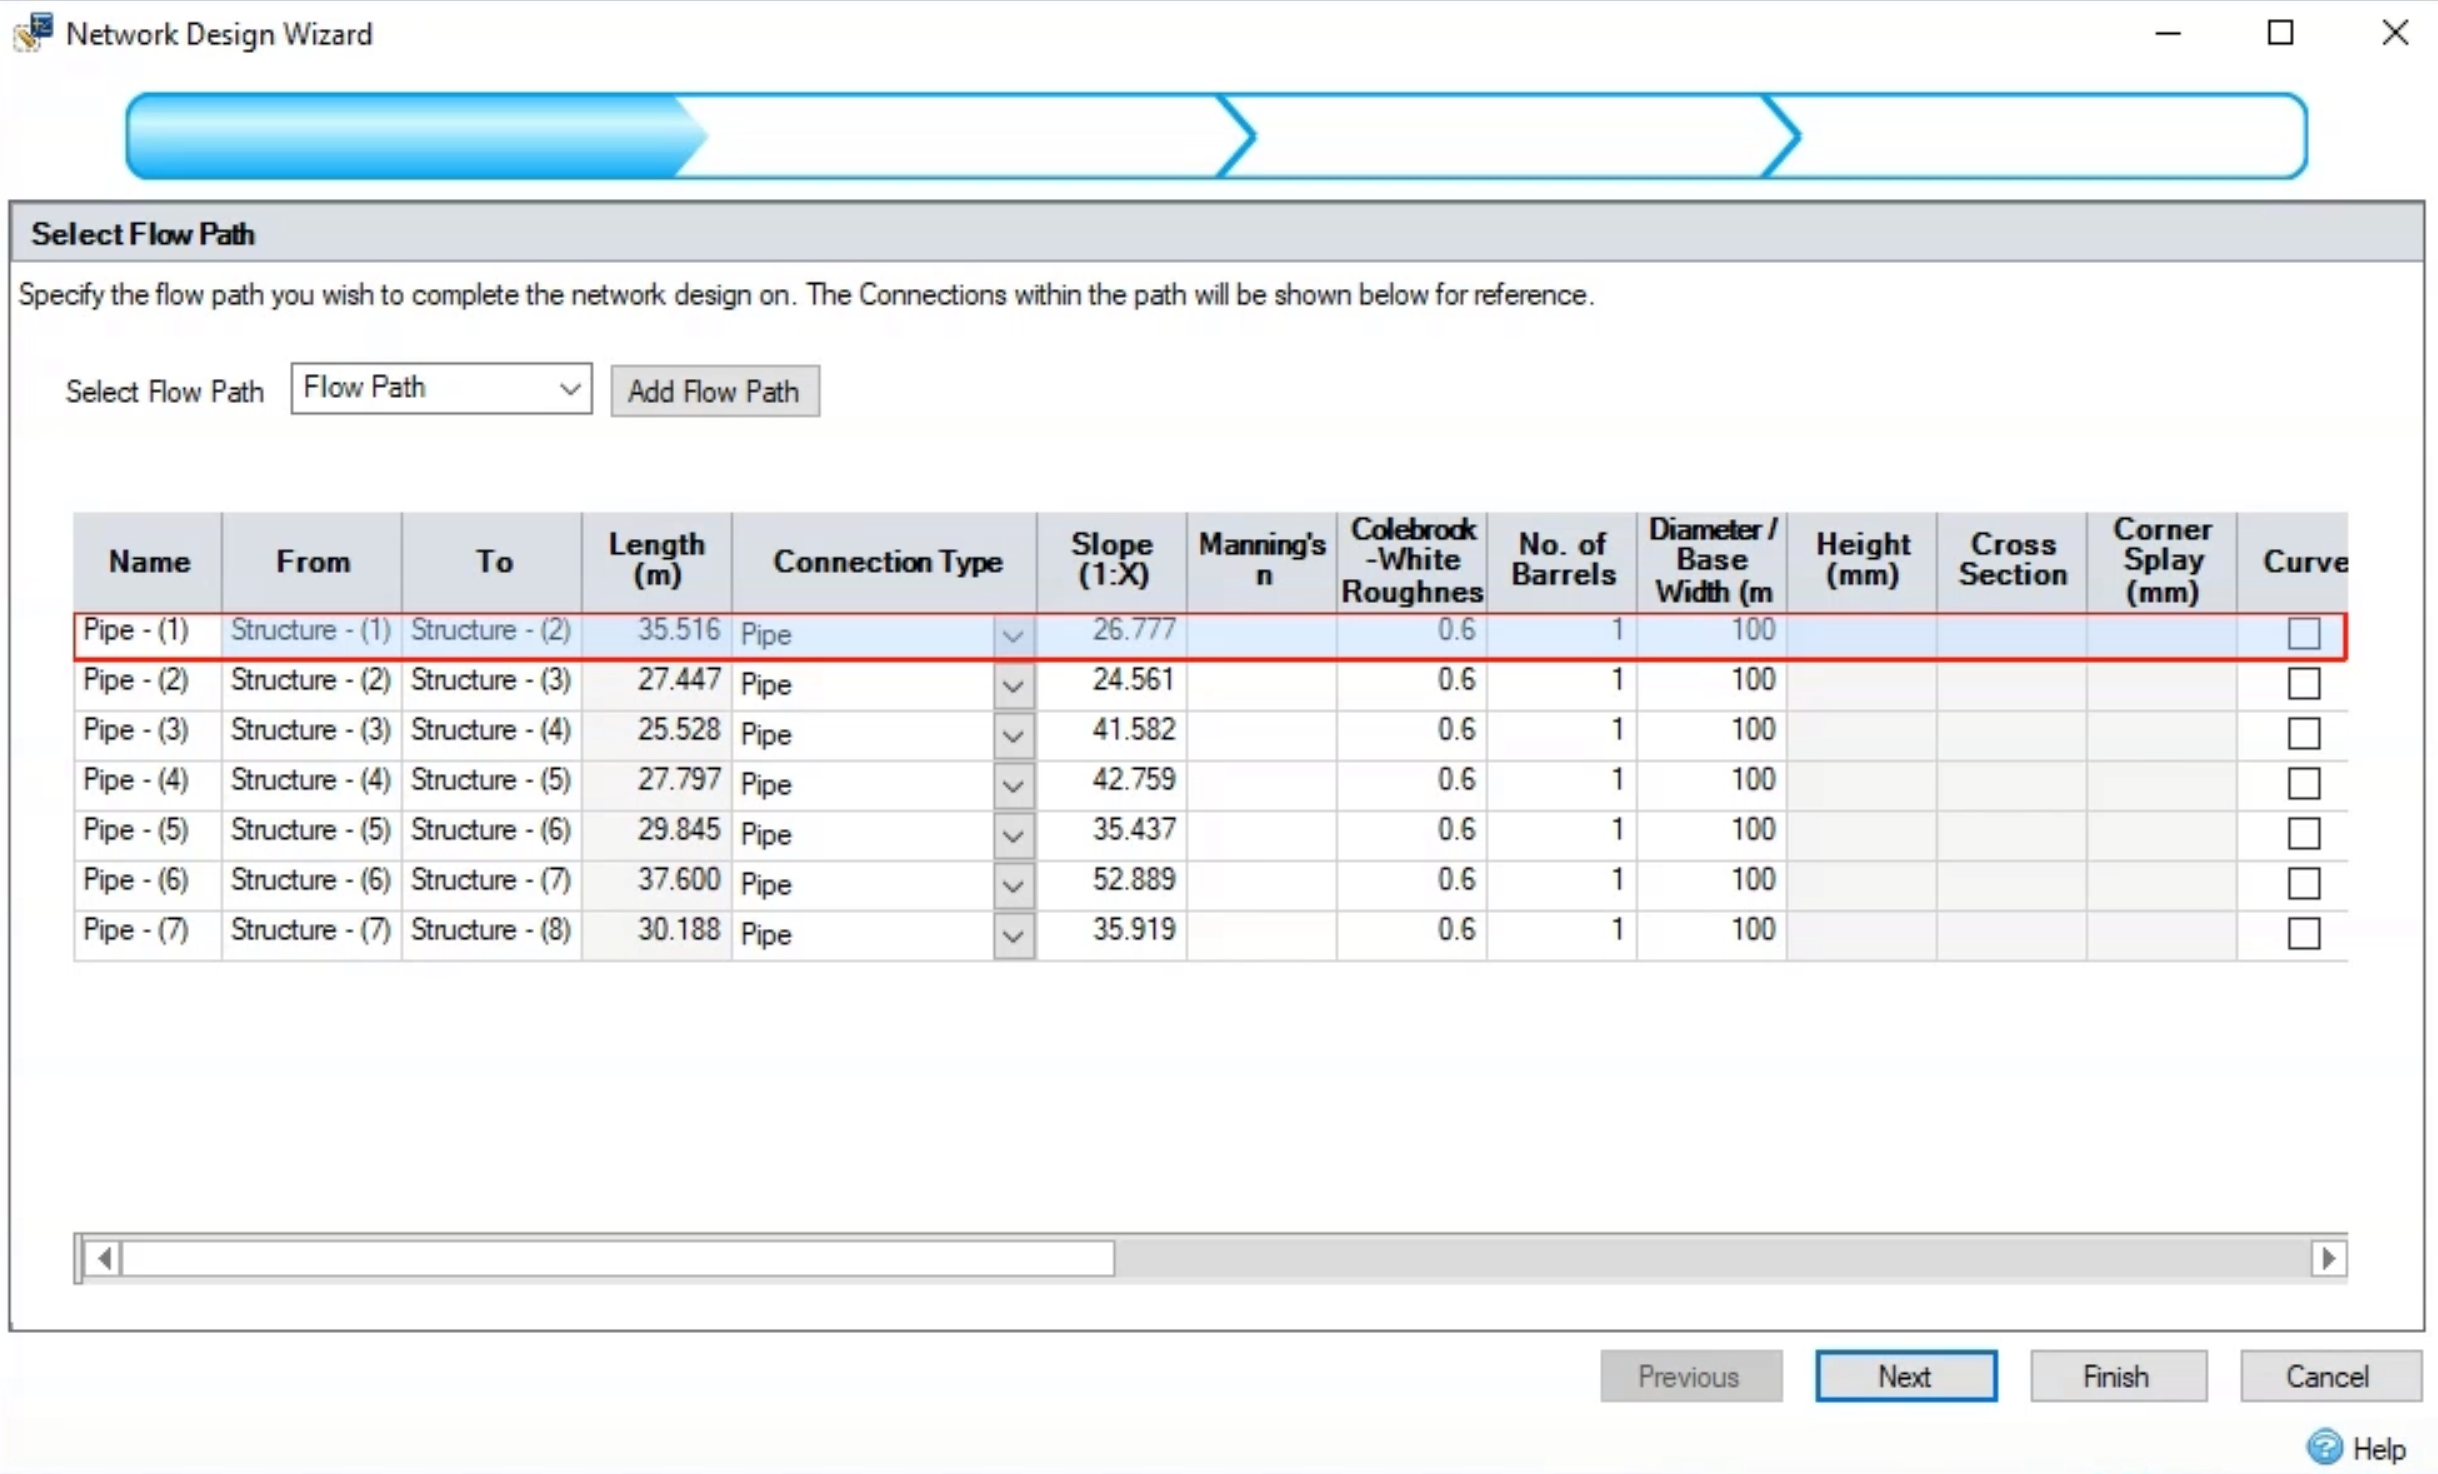
On the ribbon, Preliminary Sizing tab, Network Design panel, open the Network Design Wizard.
04:20
On the Select Flow Path page, you determine which pipes you want to design.
04:26
In this case, it is all of them, so click Next.
04:30
For the Enter Flow Criteria page, again, accept the defaults for the rainfall and click Next.
04:36
On the Enter Design Options page, accept the default options for the flow path and its network and click Next.
04:43
Lastly, on the Summary of Changes page, you can review the changes made during the network design.
04:52
The Network Design Report opens, to provide you with a summary of the new pipe capacities
04:57
and flows for this drainage system.
05:02
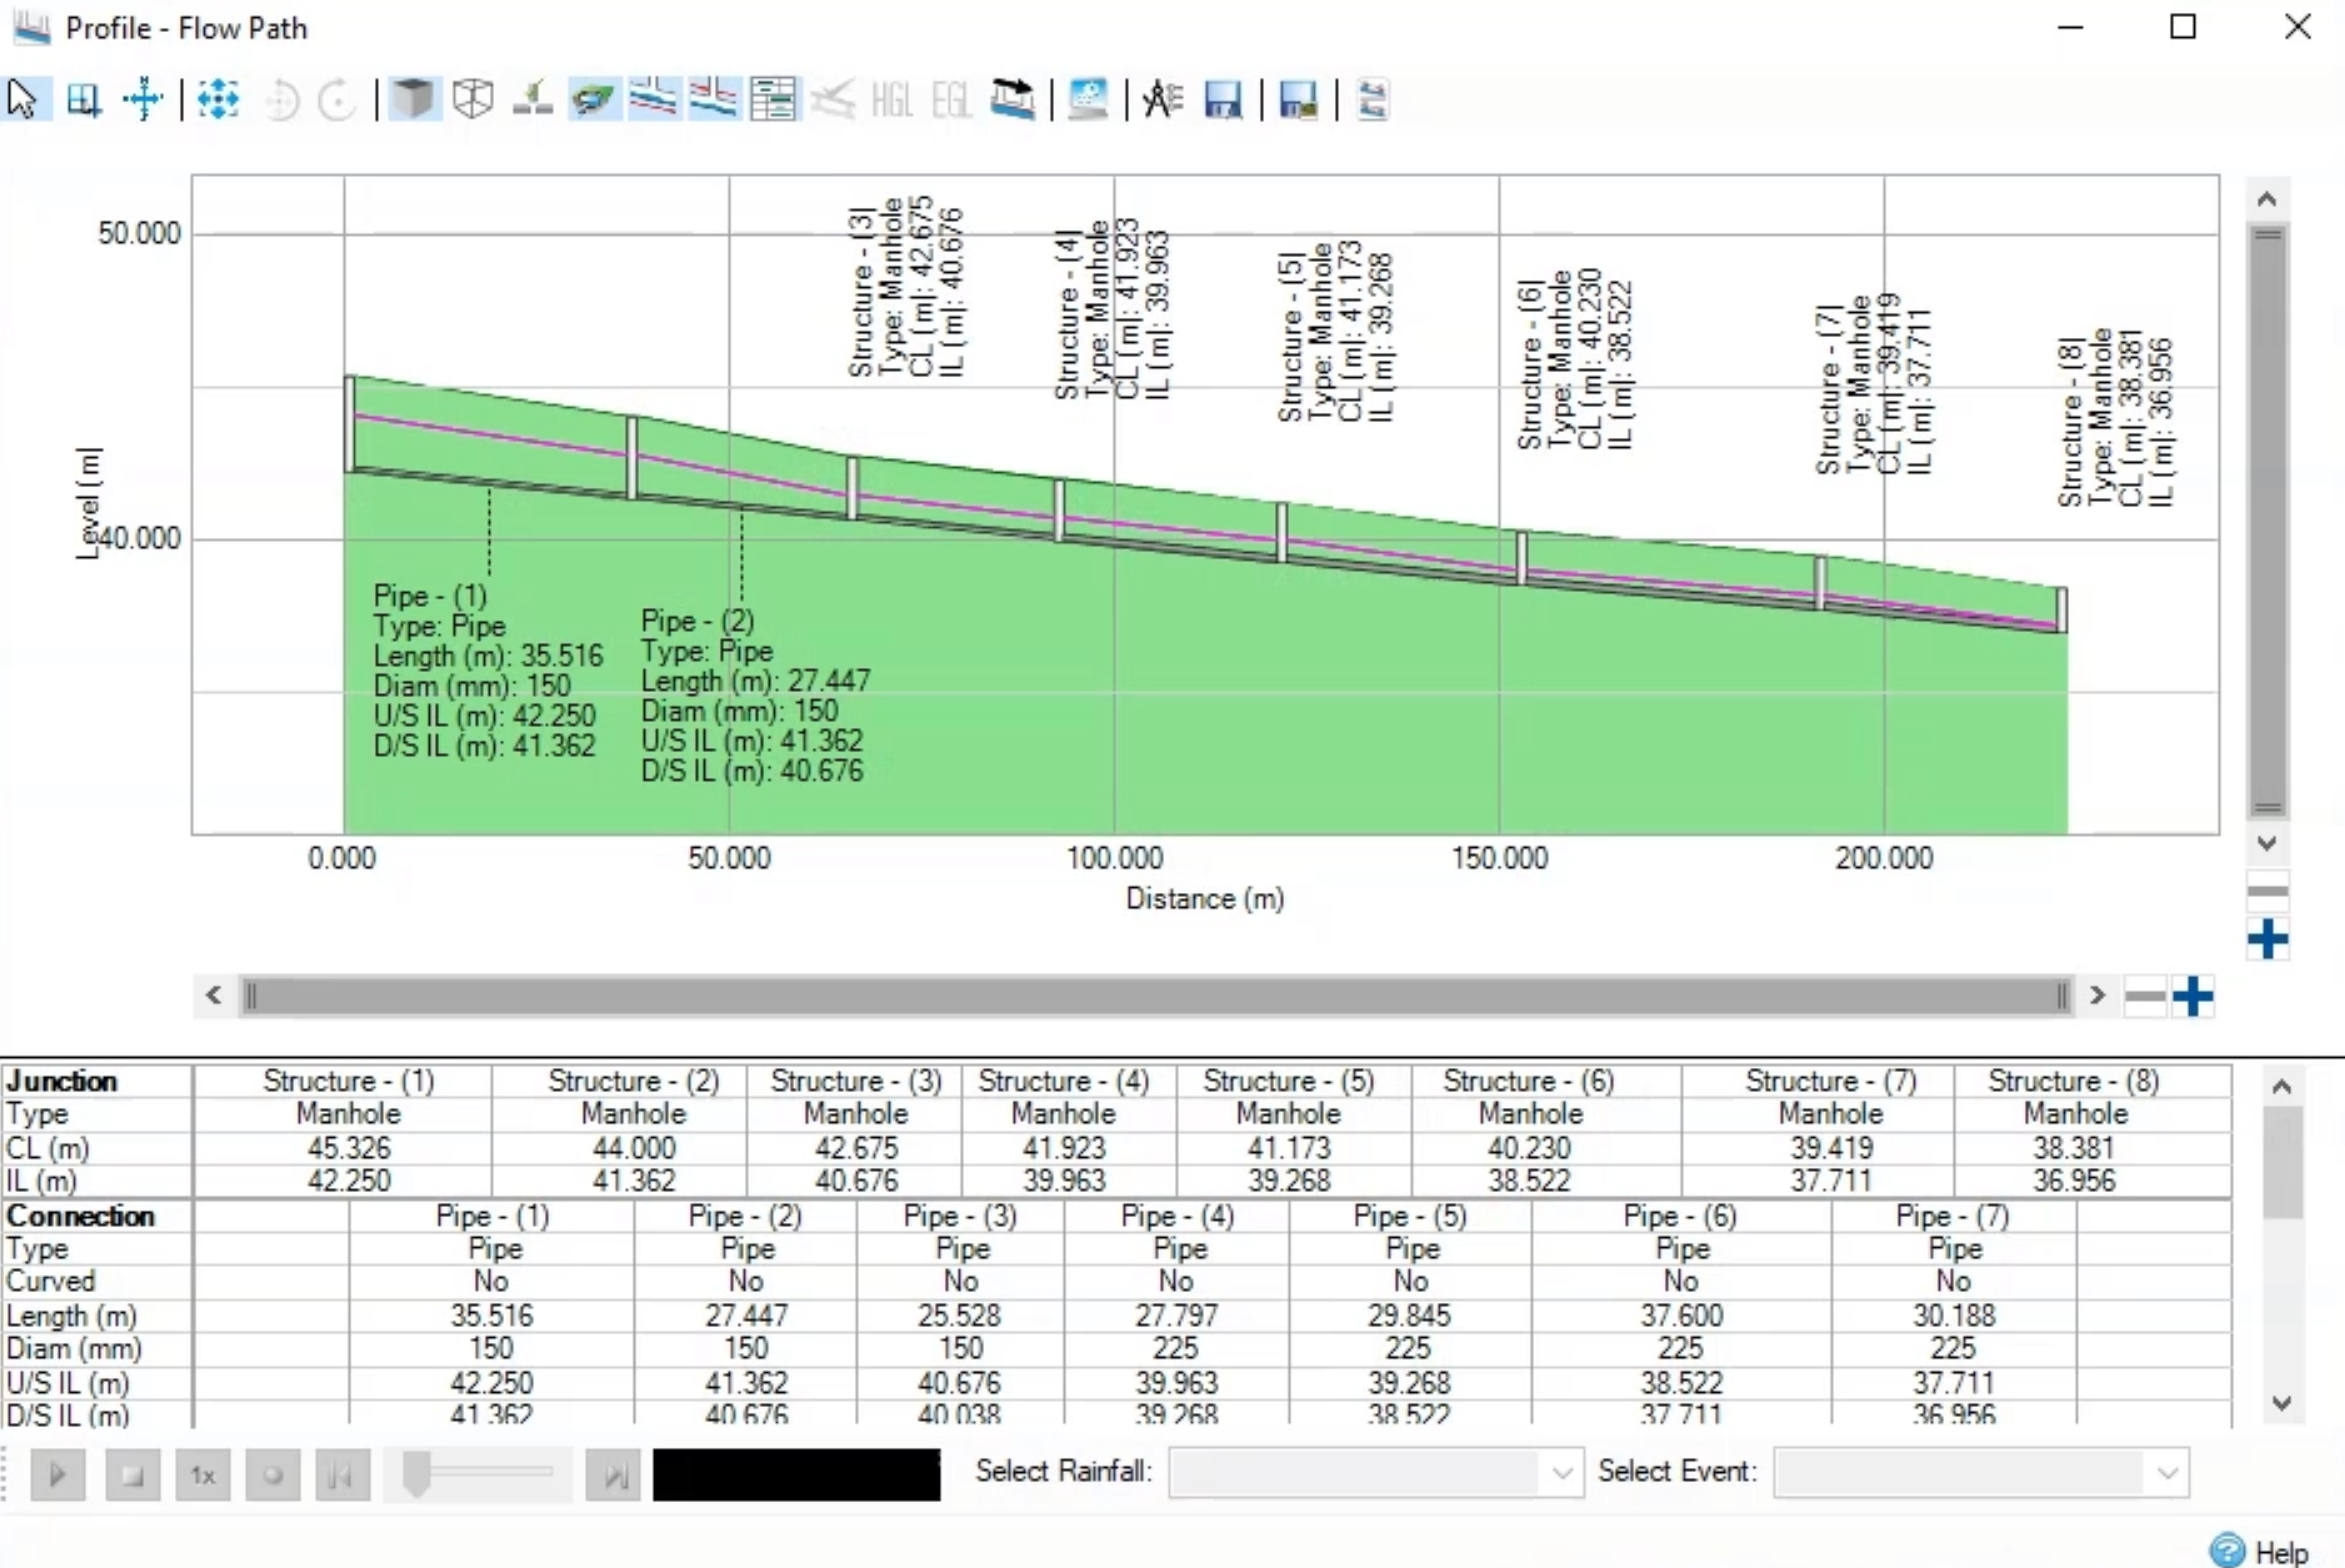
Review the pipe profile again to see the changes to the flow path.
05:06
In the Tree View, click Flow Path, then right-click it and select Show Profile.
05:12
In the Profile – Flow Path dialog box, you can see how the design has changed.
05:17
There is a different gradient and the pipes are different sizes, both of which indicate the system has now been hydraulically designed.
05:24
To see the system data in greater detail, on the ribbon, Build tab, Data panel, click Tables.
05:32
To see the pipe data, click the Connections tab.
05:37
The table populates with the new pipe data, and specifically, the Diameter / Base Width column contains the new pipe sizes.
05:47
Now, with the design all done, save the network in InfoDrainage as Hydraulic Design,
05:51
so that you can bring it back into Civil 3D to complete the design.