Step-by-step:
Data can be imported into InfoDrainage from several different sources and in different orders, allowing you to customize the process of building a drainage model.
- Click File > New to start a new project.
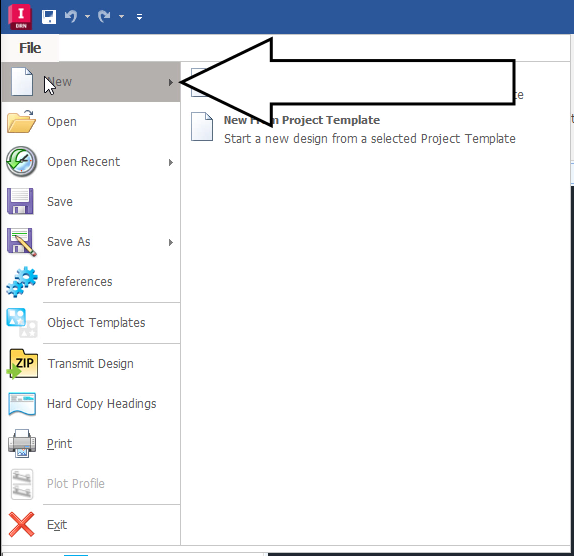
- Click File > Save As.
- In the Save dialog box, save the new project as “Exercise 4”.
- On the ribbon, click the Import tab to see the different types of information available to import, as well as their sources.

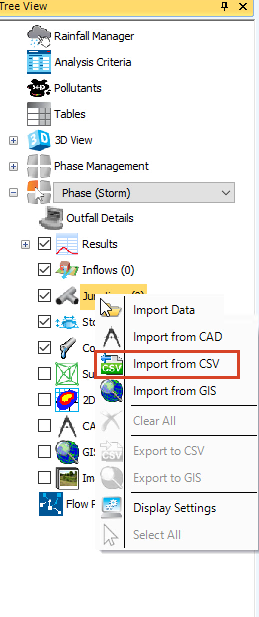
- In the Tree View, right-click Junctions and select Import from CSV.
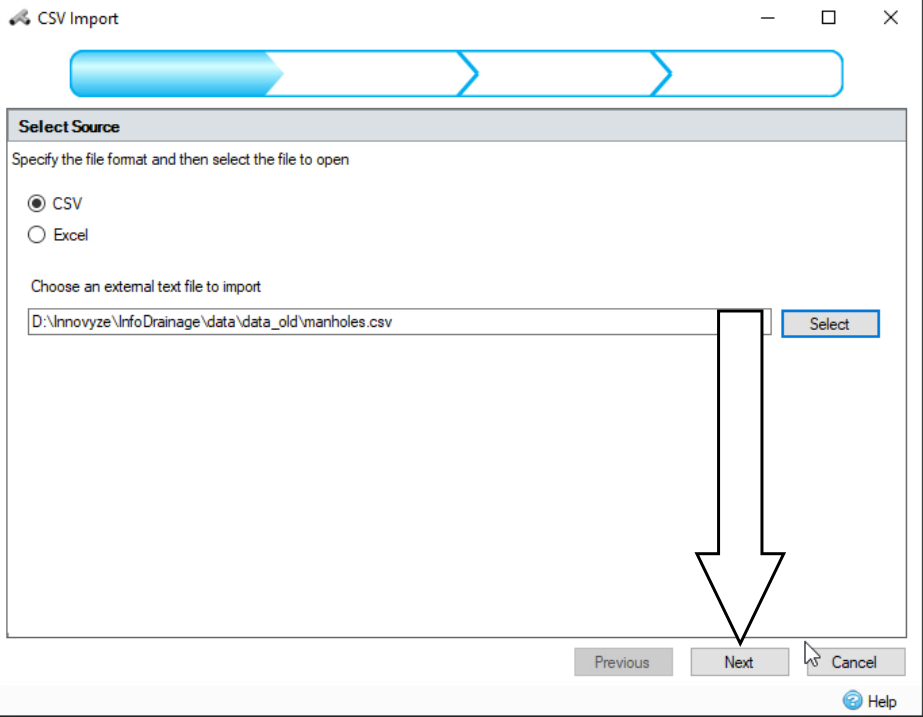
- On the Select Source page, select CSV.
- Click Select.
- In the file browser, navigate to the data folder and open manhole.csv.
- In the CSV Import dialog box, on the Select Source page, click Next.
- On the File Details page, next to Number of Header Rows, enter a value of 1.
- Select the Comma delimiter option.
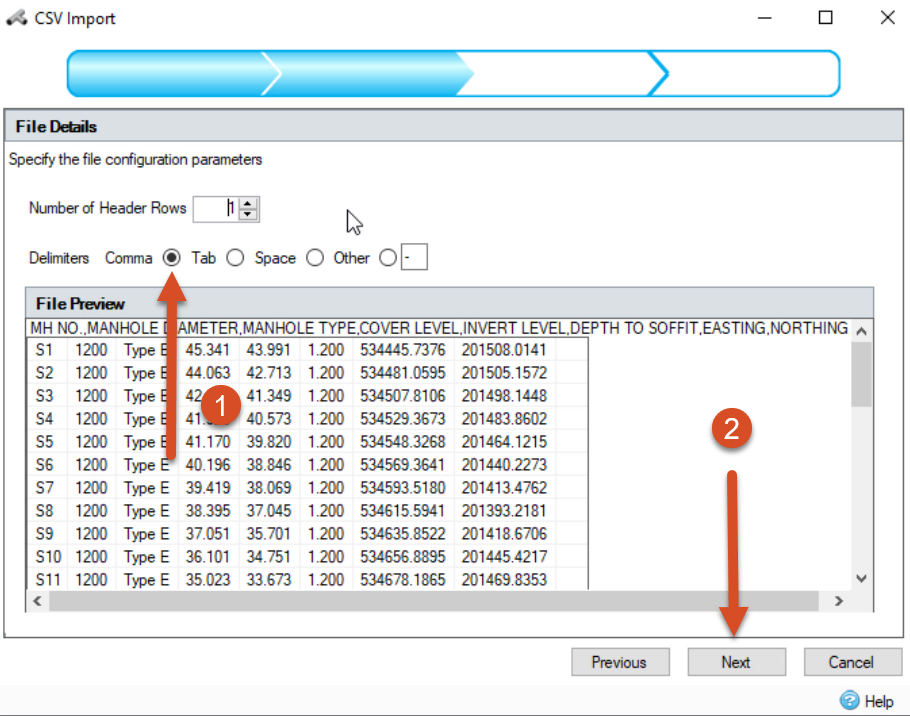
- Click Next.
- On the Select Template page, enable the Manhole
- Click Next.
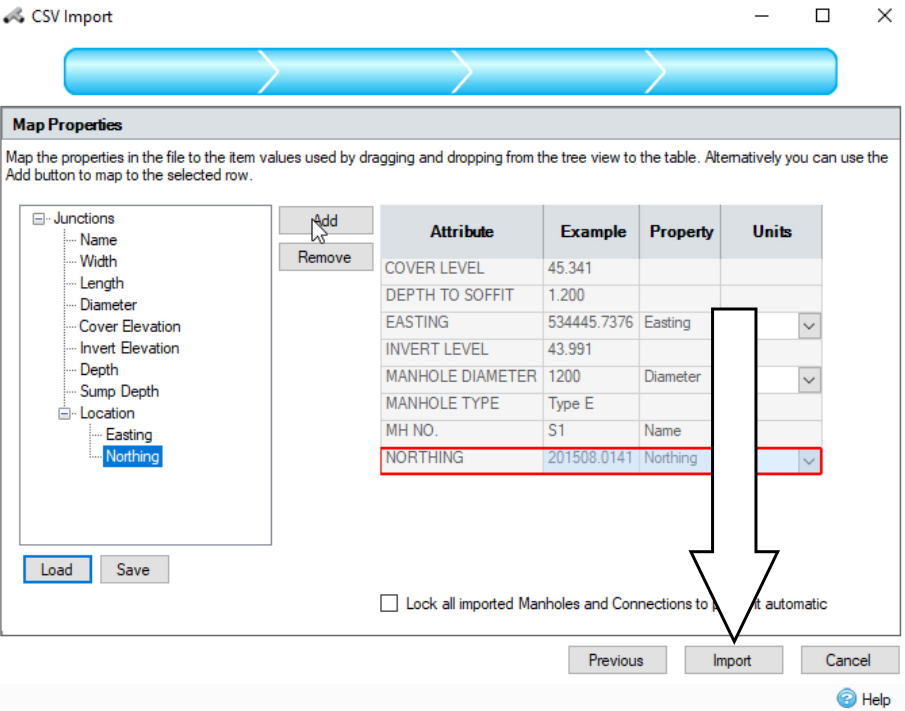
This opens the Map Properties page, where you must map the properties in the file to the item values being used. In the left window, the tree view shows the information InfoDrainage requires, and on the right is the information from the imported CSV file.
- To map the properties together, in the left pane, click ‘Name’.
- Click the MH NO. heading.
- Click Add.
Note that the column heading does not need to exactly match the junction information headings on the left.
- Match Diameter on the left with the MANHOLE DIAMETER heading on the right.
- Click Add.
- Set the unit value for the manhole diameter to mm.
- Match up the easting and northing headers from both areas, set the Units to meters, and click Add for each.
- Click Import.
- In the Import Summary dialog, click OK.
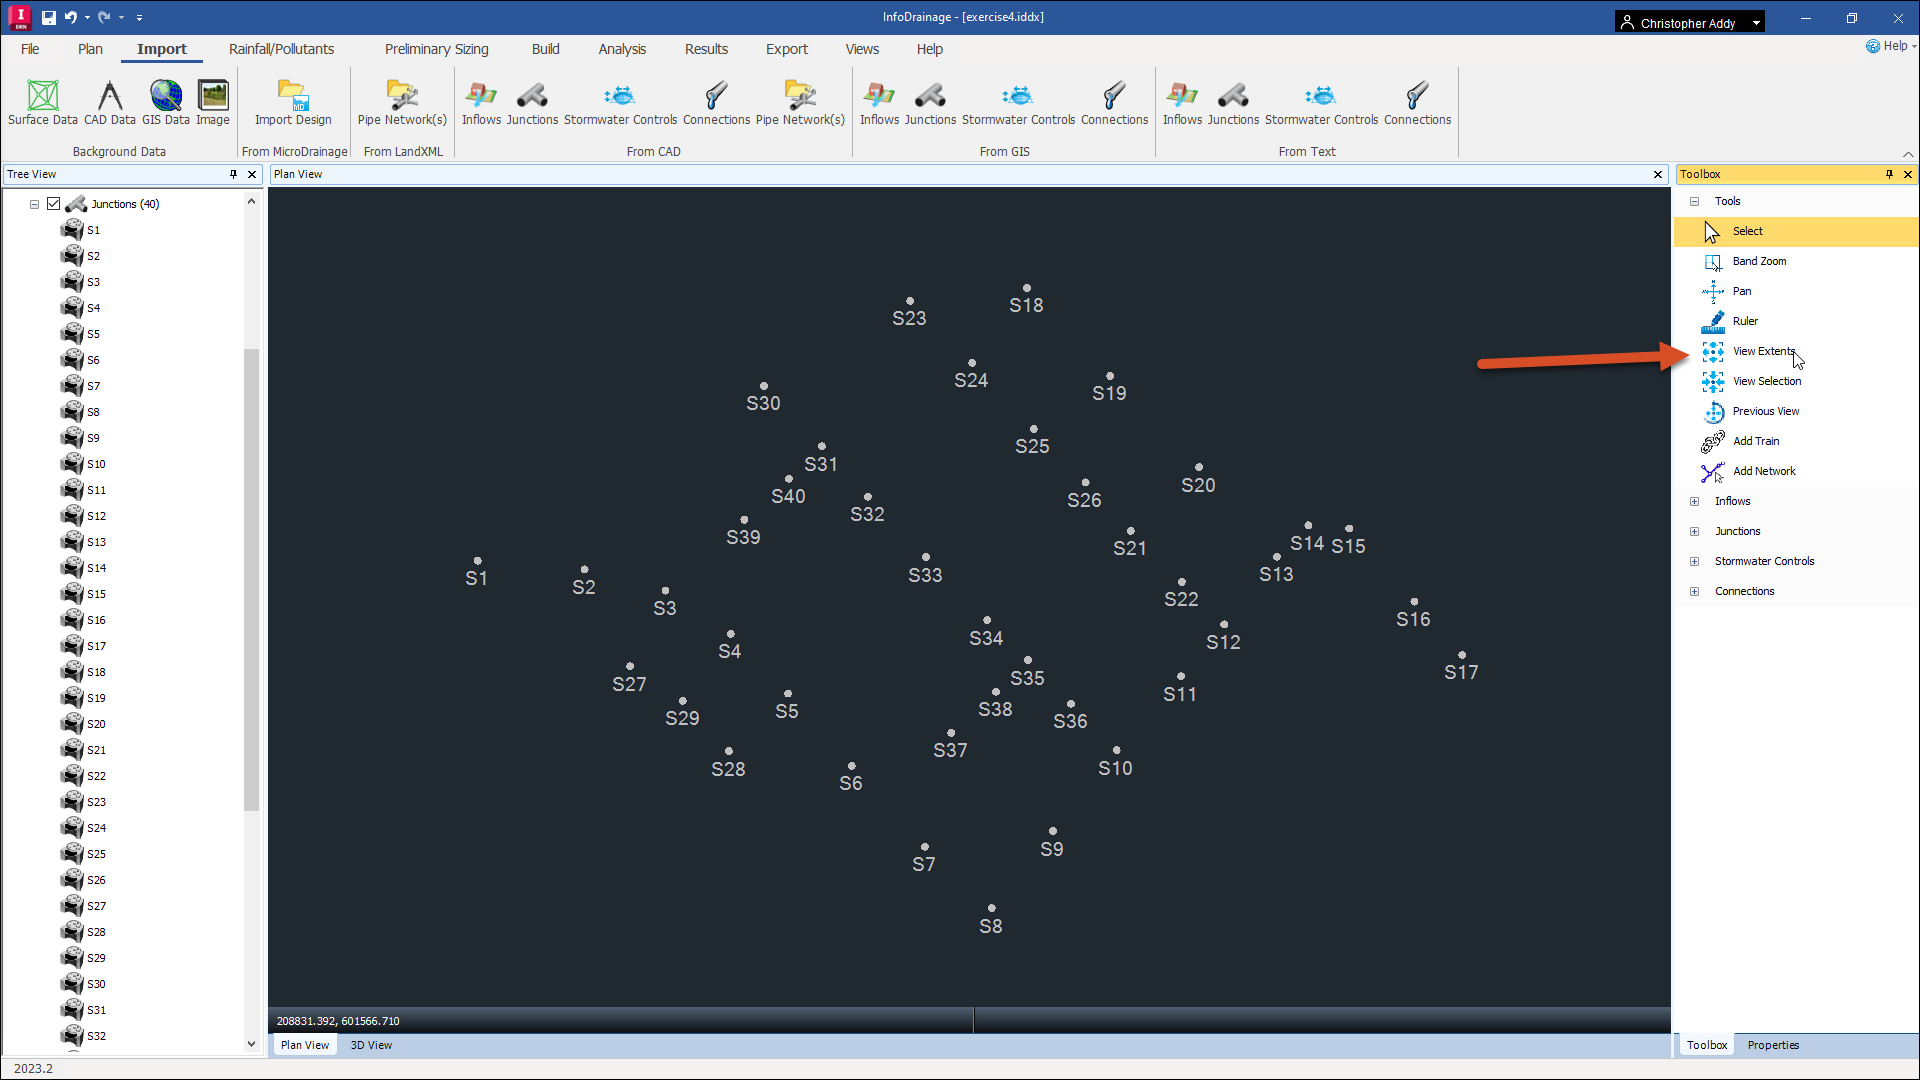
- In the Tree View, expand the Junctions node to view the newly added data.
- In the Toolbox, click View Extents to see a geographical representation of the imported CSV data in the Plan View.
Note: importing different datasets does not need to happen in a certain order.


