00:04
In InfoSurge Pro, surge protection devices (SPDs) can help reduce the magnitude of pressure waves
00:11
resulting from transients in a pipe network.
00:15
You can create a surge protection device by selecting a node and changing it to an SPD.
00:22
In this exercise, you set up a closed surge tank,
00:26
and then examine how the tank volume and initial gas volume affect surge results.
00:33
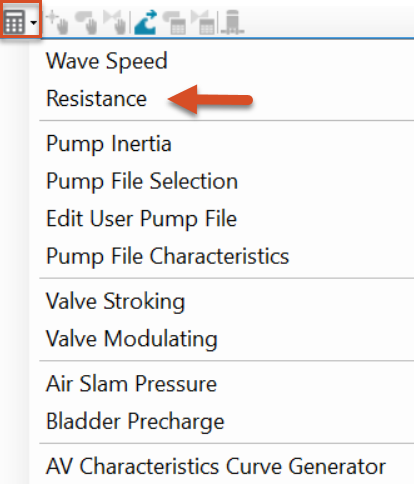
From the Model Explorer, expand the Auxiliary Calculator drop-down menu and select Resistance.
00:42
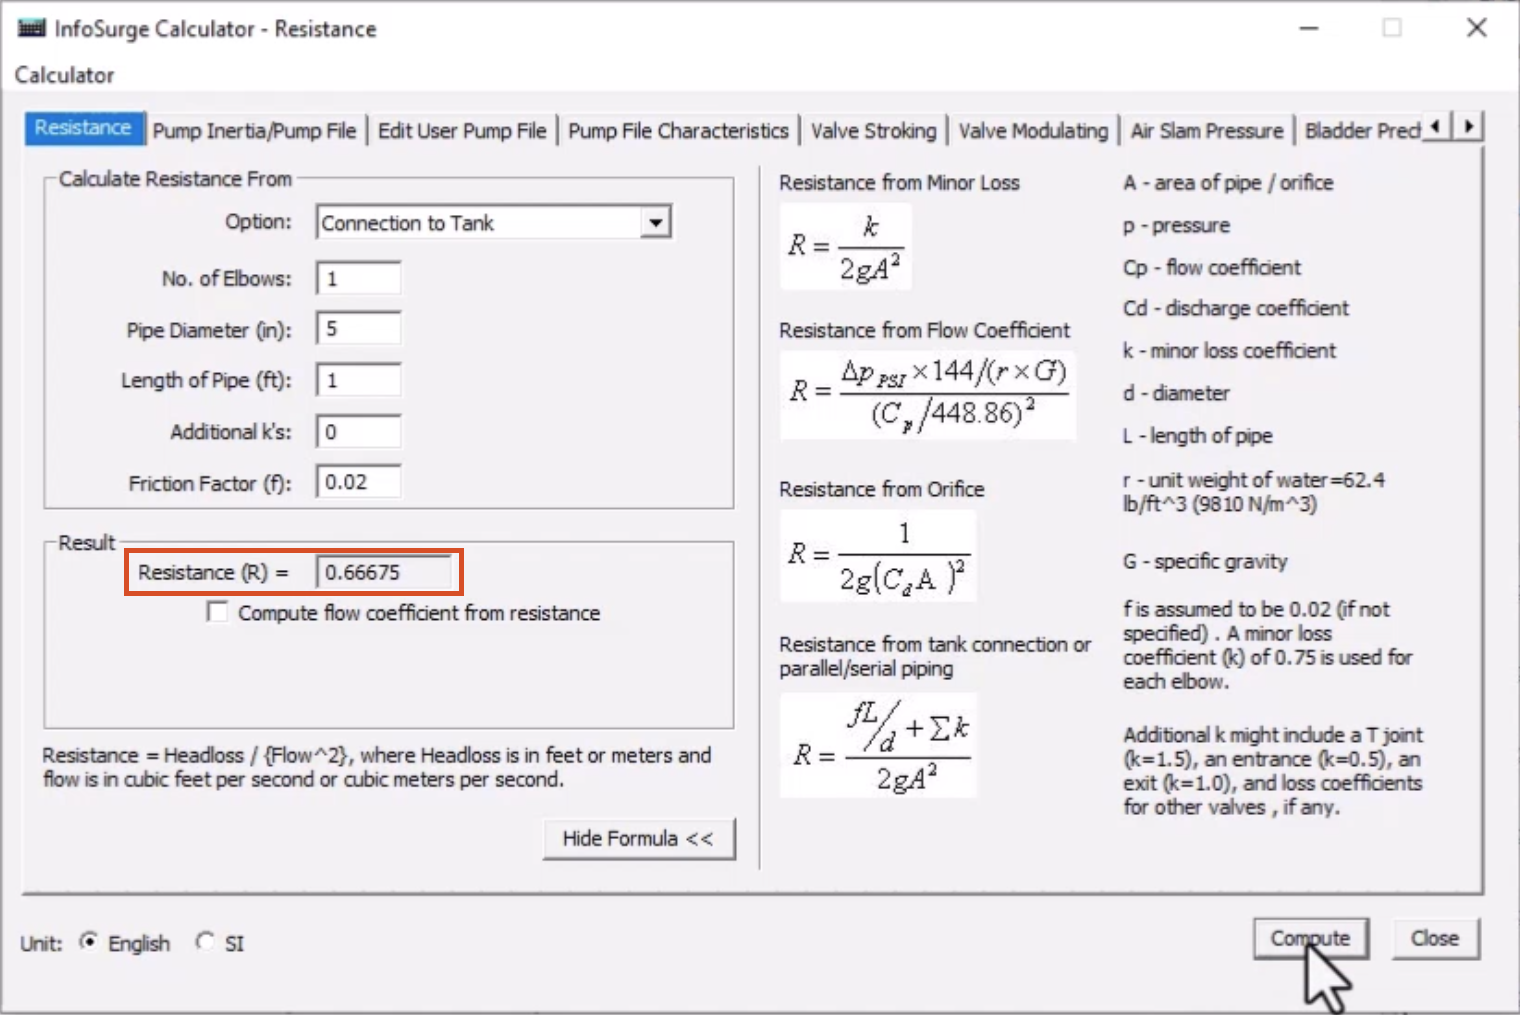
In the InfoSurge Calculator – Resistance dialog, make sure Unit is set to English.
00:50
Then, in the Calculate Resistance From group box,
00:54
from the Option drop-down, select Connection to Tank.
00:59
The list of options in the group box updates.
01:02
Set the following values:
01:05
Set the Number of Elbows to 1.
01:08
Set the Pipe Diameter to 5 inches.
01:12
Assign the Length of Pipe a value of 1 foot.
01:16
Finally, set the Additional k’s to 0.
01:21
The default Friction Factor of 0.02 should be used.
01:27
When finished, click Compute, and then note the resistance, or R value, of the connection to the tank.
01:36
In this example, the R value is 0.66675.
01:45
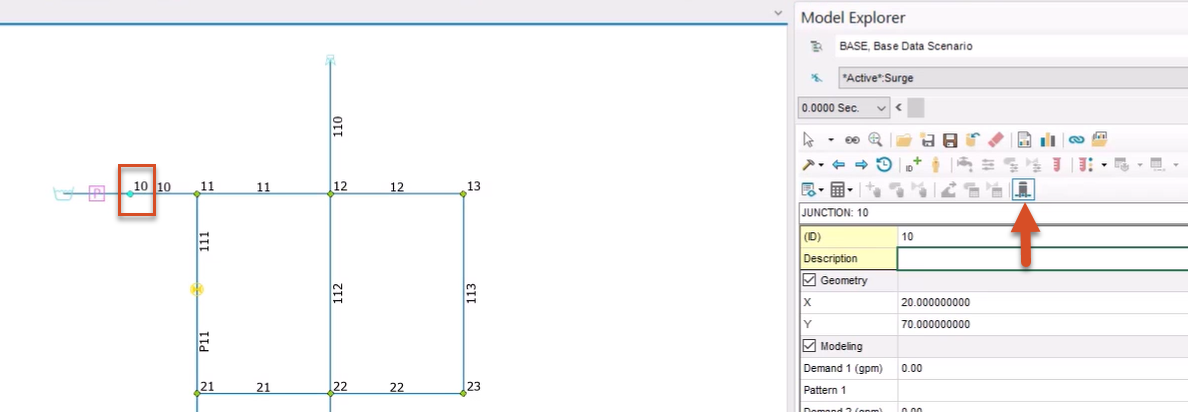
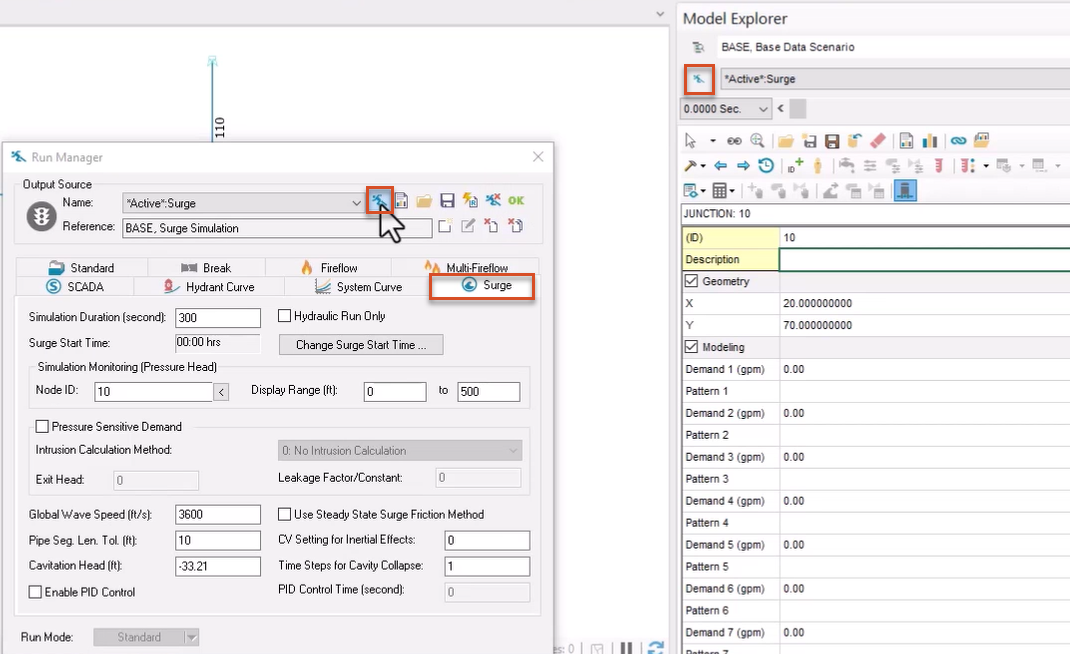
To set up a closed surge tank, from the map, select Junction 10.
01:51
Then, from the Model Explorer, click the Surge Protection Device button.
01:58
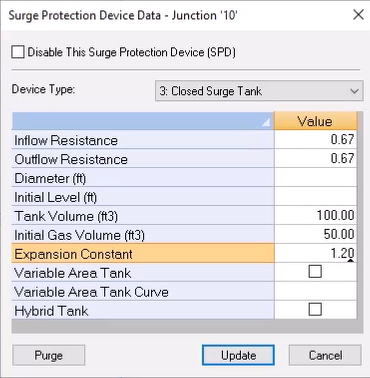
In the Surge Protection Device Data dialog, expand the Device Type drop-down and select 3: Closed Surge Tank.
02:08
Assign the calculated value of 0.67 for both the Inflow and Outflow Resistance values.
02:18
Set the Tank Volume to 100 cubic feet.
02:22
Set the Initial Gas Volume to 50 cubic feet.
02:27
Then, set the Expansion Constant to 1.2.
02:33
Leave all other parameters blank to use their defaults.
02:37
Click Update to save your changes and close the dialog.
02:42
To run a surge analysis with the closed surge tank in place,
02:48
from the Model Explorer, click the Run Manager button.
02:53
In the Run Manager dialog, make sure you have the Surge tab open.
02:59
Click the Run button to run the surge analysis.
03:03
A green traffic light icon displays when the analysis is complete.
03:08
Click OK to close the dialog.
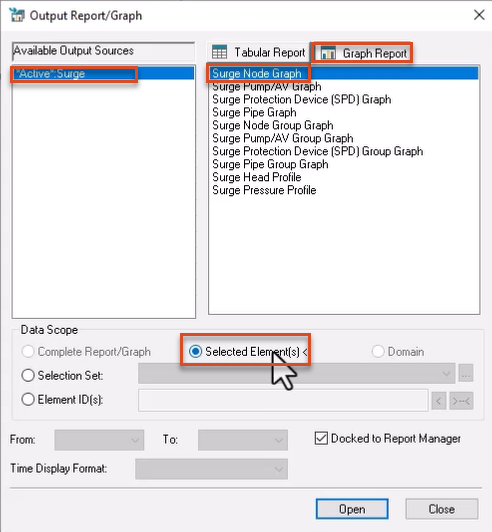
03:12
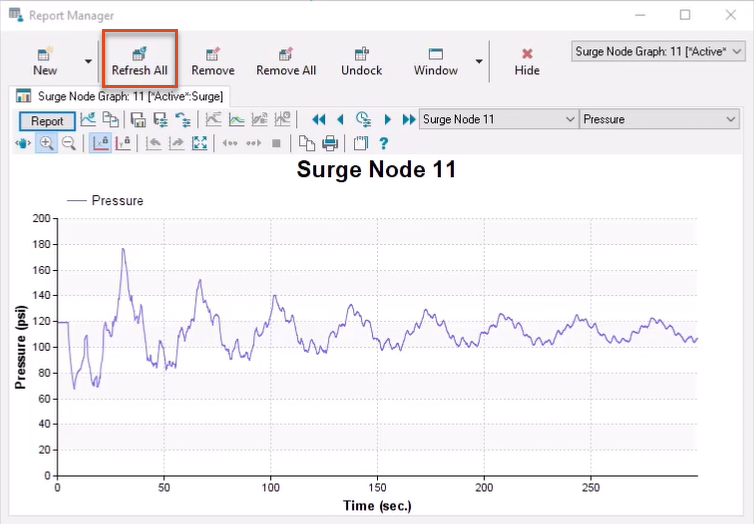
From the ribbon, View panel, click Report Manager.
03:17
In the Report Manager dialog, click New to open the Output Report/Graph dialog.
03:25
In the Available Output Sources area, select the *Active*:Surge option.
03:32
From the Graph Report tab, pick Surge Node Graph.
03:37
In the Data Scope group box, enable the Selected Element(s) < option, if it is not already.
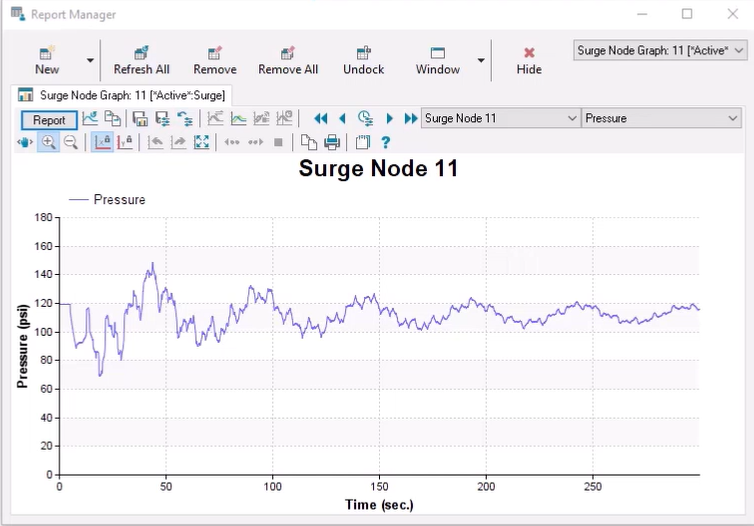
03:48
On the map, select Junction 11 to view its pressure profile in the Report Manager dialog.
03:57
Note the maximum, minimum, and average pressure values.
04:02
Close the Report Manager.
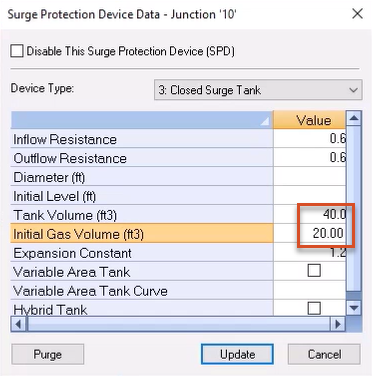
04:04
Now, resize the closed surge tank to see how it performs differently.
04:10
Again, select Junction 10 from the map, and then click the Surge Protection Device button.
04:18
Change the Tank Volume to 40, and the Initial Gas Volume to 20.
04:27
Run another surge analysis.
04:30
Then, open the Report Manager dialog and click Refresh All to populate the newest run data.
04:40
Observe the changes to the pressure values resulting from the smaller tank and initial gas volumes.
04:46
They show that the smaller tank was not as effective as the larger tank in mitigating the pressure surge.
04:54
Feel free to adjust the tank and gas volumes and rerun the analysis to see how the results change.