00:04
In InfoSurge Pro, the impact of surge protection devices (SPDs)
00:08
can be illustrated by running a surge analysis on your pipe network both with and without an SPD.
00:17
In this exercise, first you run an analysis without SPDs.
00:22
Then, you set up a side discharge orifice and view the result of mitigating pressure surge.
00:29
To begin, double-click the desired project .aprx file to open ArcGIS Pro.
00:37
Once the project starts, click the InfoWater Pro tab to open the InfoWater Pro ribbon.
00:45
In the Project panel, click Initialize.
00:51
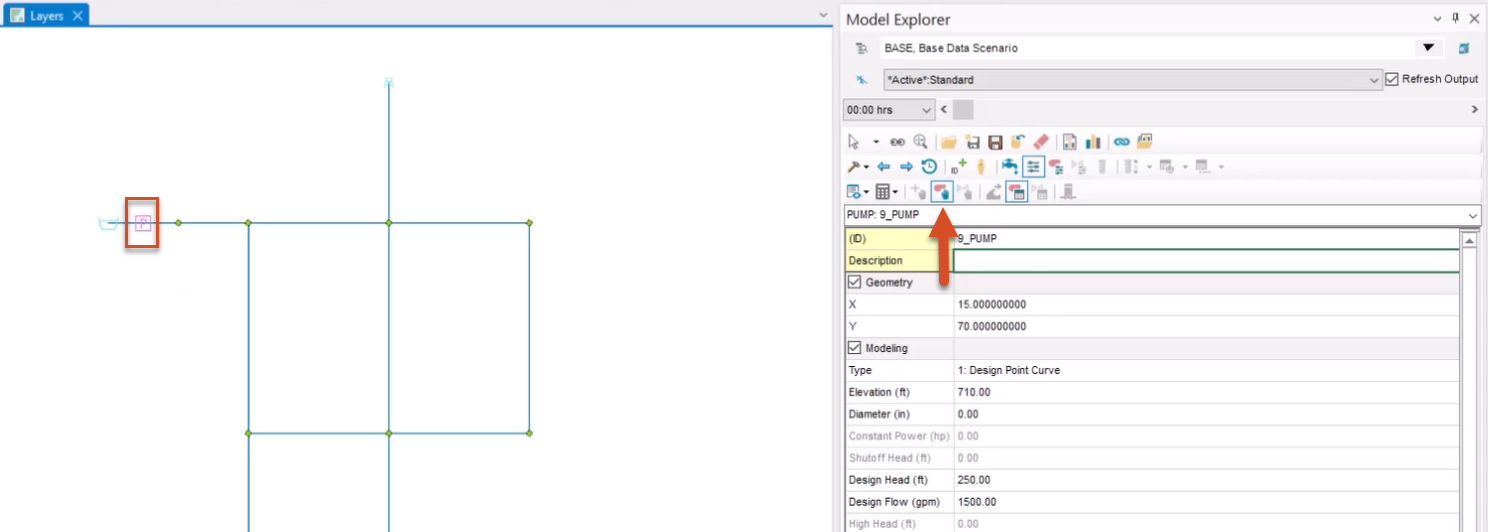
On the map, select a pump, such as the pump with ID 9_PUMP.
00:59
Then, from the Model Explorer, click the Pump Operation Change button.
01:05
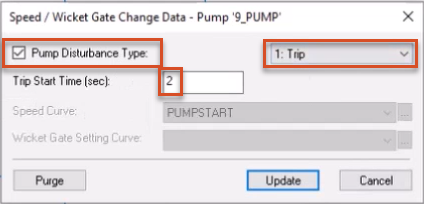
In the Speed/Wicket Change dialog, ensure that the Pump Disturbance Type option is enabled,
01:13
and that the associated drop-down menu is set to 1: Trip.
01:19
Set the Trip Start Time to 2 seconds, and then click Update to close the dialog.
01:27
This means that 2 seconds into the simulation, the pump will run down according to the data specified in the Pump Surge Data dialog.
01:37
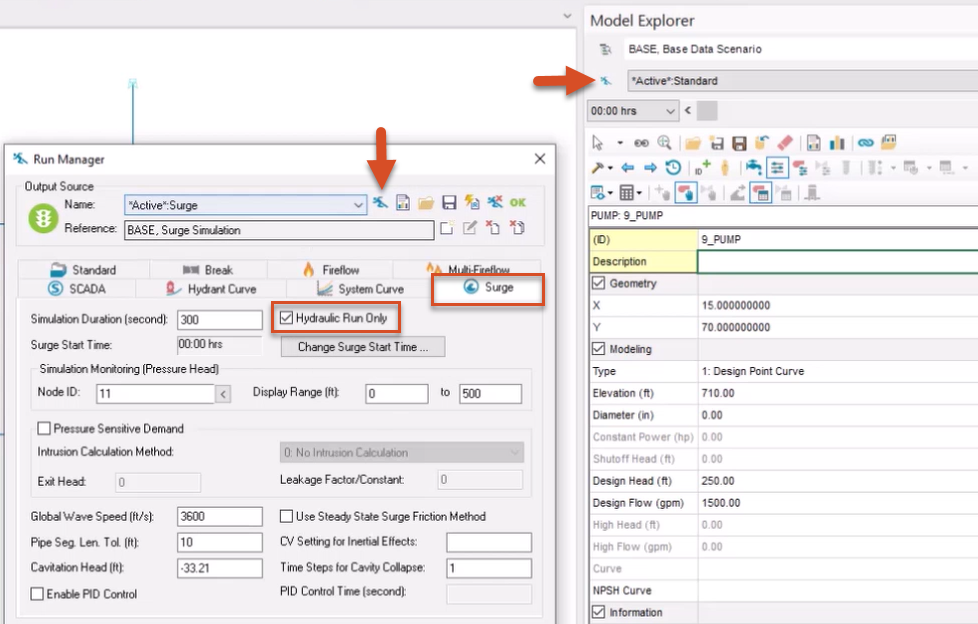
Next, click the Run Manager button.
01:41
In the Run Manager dialog, open the Surge tab.
01:46
Enable the Hydraulic Run Only option, and then click Run to run the hydraulic simulation.
01:54
When the simulation is complete, disable the Hydraulic Run Only option, and then click Run again.
02:03
When finished, click OK to close the Run Manager.
02:08
If you receive a notification asking if you want to switch to the most recent run output data, click Yes.
02:16
Now, from the ribbon, View panel, select Report Manager.
02:22
In the Report Manager dialog, click New to open the Output Report/Graph dialog.
02:30
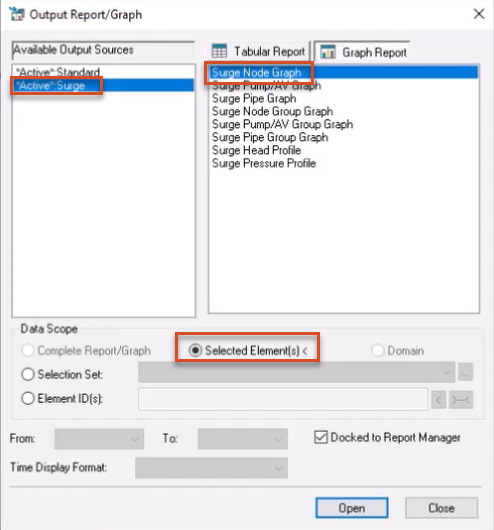
In the Available Output Sources area, select the *Active*:Surge option.
02:36
From the Graph Report tab, pick Surge Node Graph.
02:41
In the Data Scope group box, enable the Selected Element(s) < option, if it is not already.
02:51
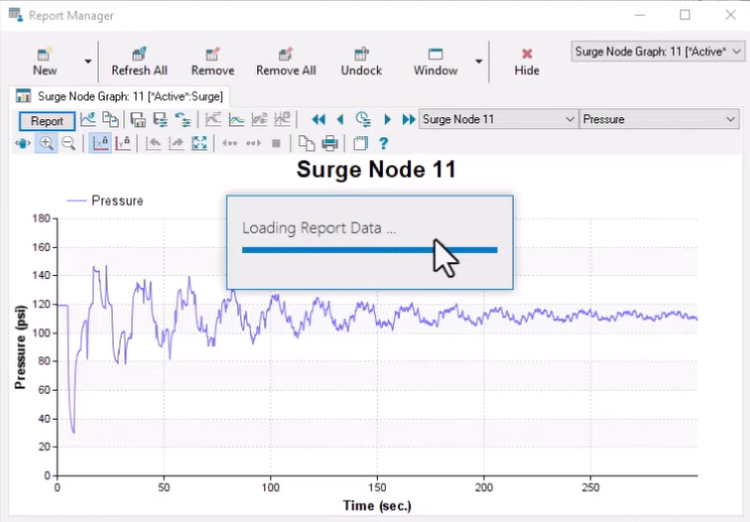
On the map, select Junction 11 to view its pressure profile in the Report Manager dialog.
02:59
You can click Report if you want to examine individual data points.
03:05
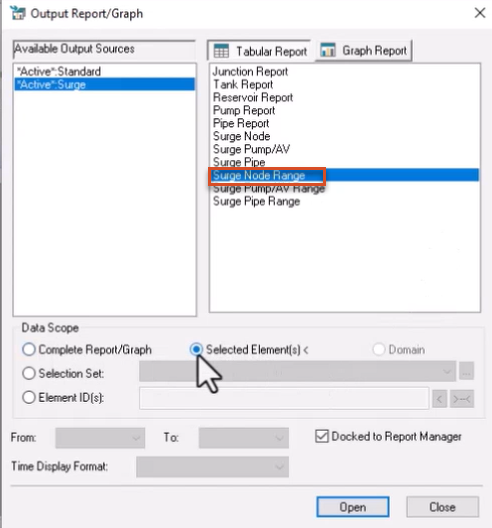
Click New again, and this time, in the Output Report/Graph dialog, open the Tabular Report tab.
03:15
Select the Surge Node Range option.
03:18
Again, ensure that the Selected Element(s) < option is enabled, and then click Open.
03:26
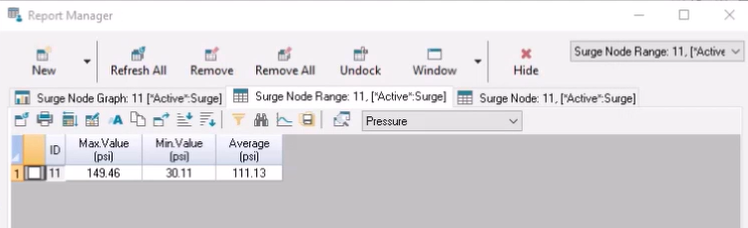
On the map, select Junction 11 again, and then right-click and pick Enter.
03:33
In the Report Manager dialog, note the minimum and maximum pressures listed in the table.
03:40
When you are finished reviewing the results, click Hide to close the Report Manager dialog.
03:48
Next, you need to set the flow resistance of an orifice you are adding to the pipe network.
03:55
This means how much the element resists flow of fluid through the element
04:00
and is defined as the head change divided by the flow squared across an element.
04:06
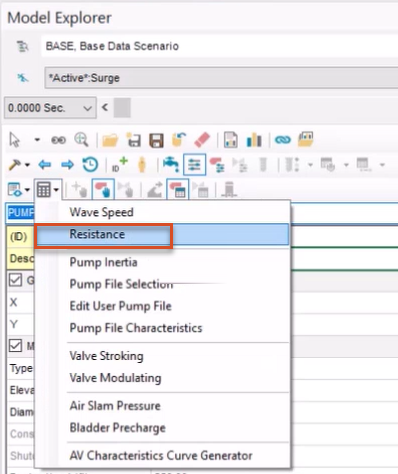
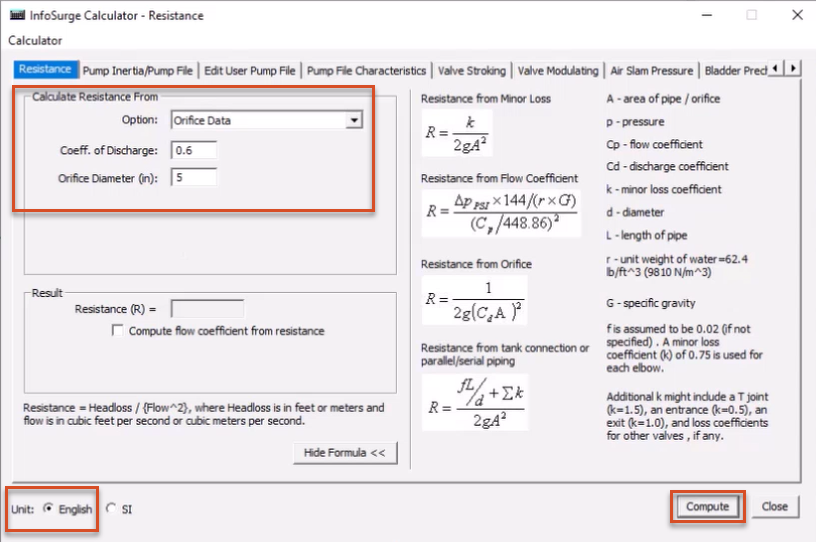
From the Model Explorer, expand the Auxiliary Calculator drop-down and select Resistance.
04:15
In the InfoSurge Calculator – Resistance dialog, first set the Unit to English, if it is not already.
04:23
Then, in the Calculate Resistance From group box, Option drop-down, pick Orifice Data.
04:30
Set the Coefficient of Discharge to 0.6, and the Orifice Diameter to 5.
04:40
Note that in the Result group box, the Resistance (known as the R value) is calculated as 2.32091.
04:54
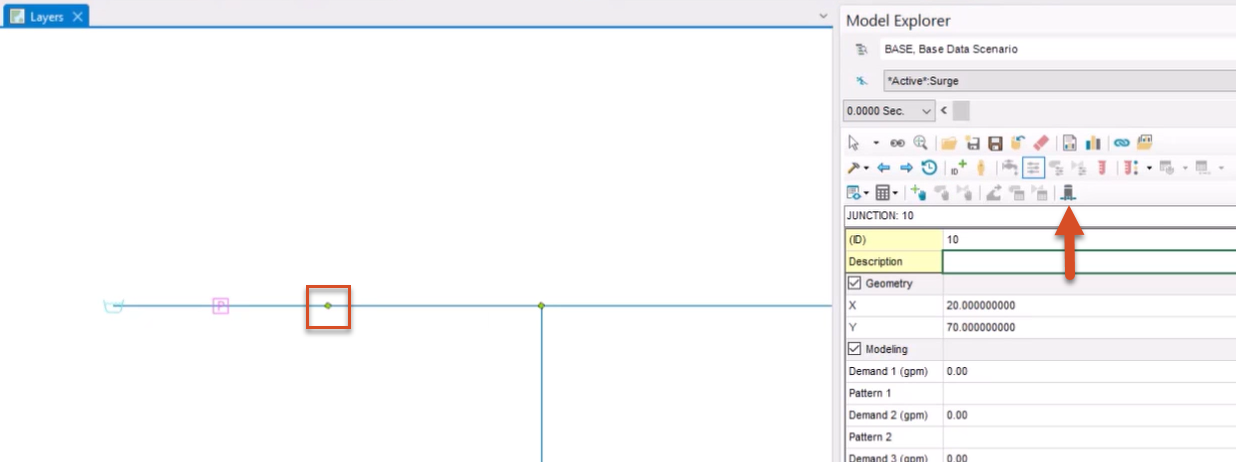
Now, to add a side discharge orifice to your pipe network, select Junction 10.
05:01
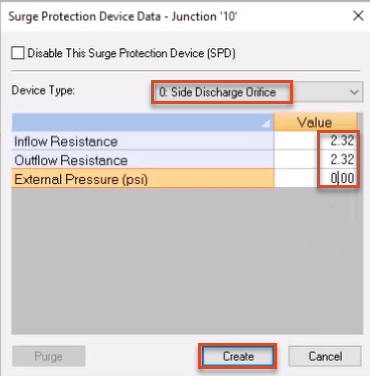
From the Model Explorer, click Surge Protection Device.
05:06
A dialog opens that allows you to set a device type and customize its characteristics.
05:13
Expand the Device Type drop-down and select 0: Side Discharge Orifice.
05:21
Assign both the Inflow and Outflow Resistance the calculated value, 2.32, and set the External (atmospheric) Pressure to 0.
05:36
Open the Run Manager dialog again, run another surge analysis, and then click OK when it finishes.
05:46
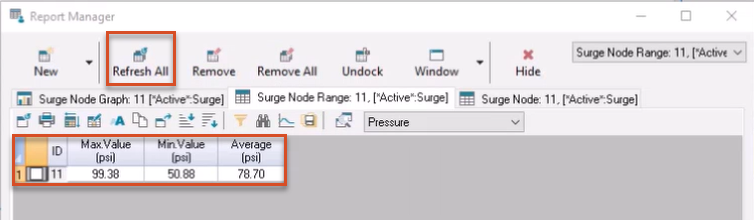
Reopen the Report Manager dialog, and then click Refresh All to refresh the output for Junction 11 for the latest run.
05:57
Observe how the minimum, maximum, and average pressures
06:02
reflect the drastic impact of introducing a surge protection device where one did not exist previously.
06:09
Click Hide to close the Report Manager dialog.