00:03
When working in InfoSurge Pro,
00:06
editing the stem change curve of a valve can significantly impact the pressures resulting from a surge.
00:12
In this example, you use the optimal valve closure procedure—a two-stage valve closure—to close a 12-inch gate valve.
00:19
To begin, double-click the desired project .aprx file to open ArcGIS Pro.
00:26
Once the project starts, click the InfoWater Pro tab to open the InfoWater Pro ribbon.
00:32
In the Project panel, click Initialize.
00:35
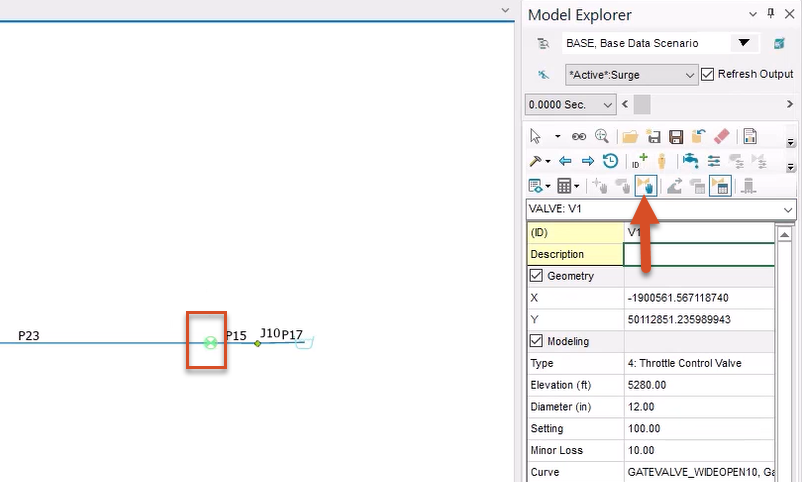
Select the valve with the ID V1 from the map.
00:40
Then, from the Model Explorer, click AV (TCV) Operation Change.
00:46
In the dialog that opens, next to the Stem Change Curve drop-down, click the Browse (…) button.
00:52
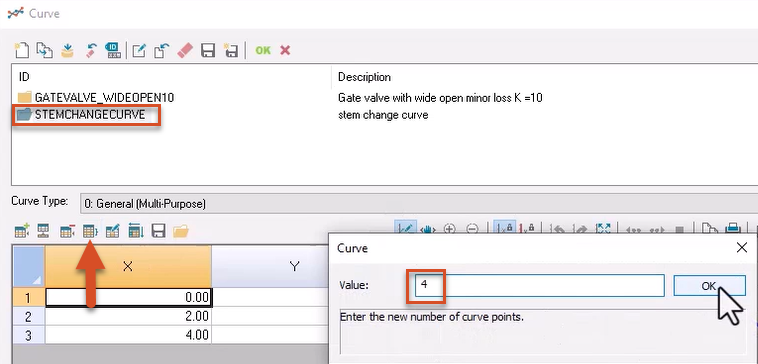
Select the curve named STEMCHANGECURVE, and then click Set Rows.
00:57
In the Value field, enter a value of 4, then click OK.
01:02
The table updates to include a fourth row.
01:05
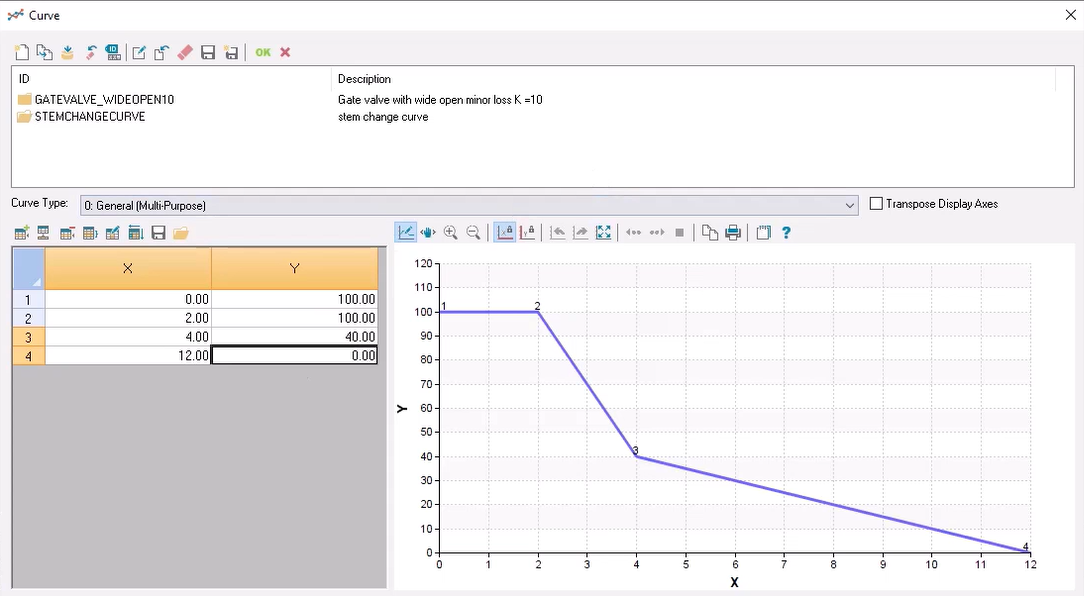
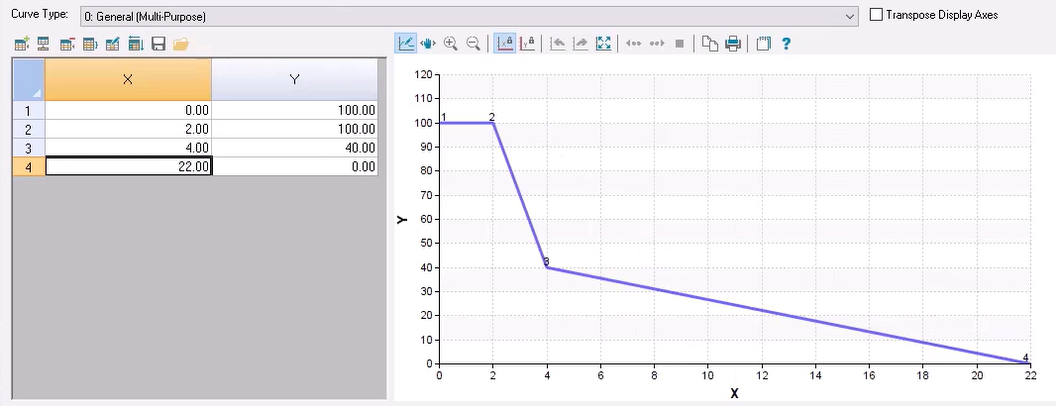
In the third row of the X column, enter a value of 4.00.
01:10
In the same row of the Y column, enter a value of 40.00.
01:15
In the fourth row of the X column, enter 12.00, and then enter 0 in the Y column.
01:23
Click elsewhere in the table to update the graph to reflect the new curve values.
01:27
The updated stem change curve closes valve V1 60% from two seconds to four seconds,
01:34
and then closes the remaining 40% from four to 12 seconds.
01:39
Click OK to close the Curve dialog.
01:42
Then, in the AV (TCV) Operation Change Data dialog, click Update.
01:48
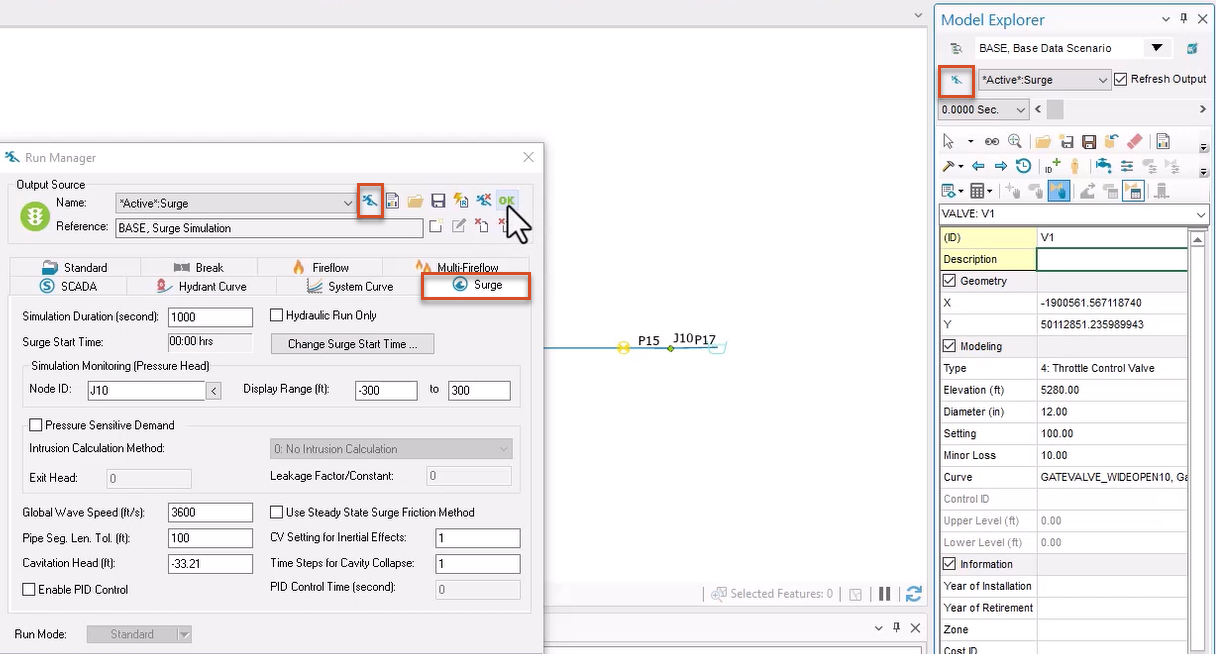
To run a surge analysis with the extended operation time, from the Model Explorer, click the Run Manager button.
01:55
In the Run Manager dialog, Surge tab, click Run.
01:59
When the analysis is complete, click OK to close the dialog.
02:03
From the InfoWater Pro ribbon, View panel, click Report Manager.
02:09
In the Report Manager dialog, click New.
02:12
Select *Active*:Surge as the Available Output Source.
02:16
From the Graph Report tab, pick Surge Pump/AV Graph, and then click Open.
02:22
Now, select valve V1.
02:25
Click Report to see the results in a table format.
02:29
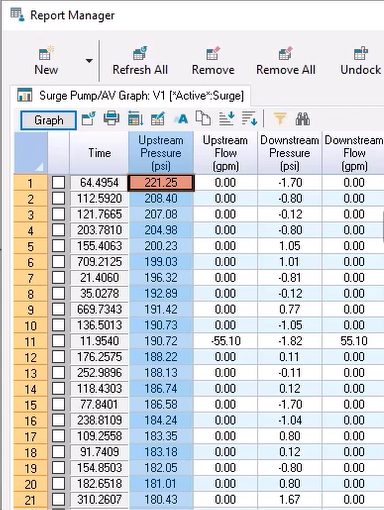
Then, right-click the Upstream Pressure (psi) column header and pick Sort Descending.
02:35
In this example, the maximum surge pressure upstream is 221.25.
02:41
Repeat the steps to edit the valve stem change curve for valve V1.
02:46
Return to the AV (TCV) Operation Change Data dialog.
02:50
This time, change the value in the fourth row of the X column to 22.
02:55
This updated curve closes the valve by 60% from two seconds to four seconds, and then closes the remaining 40%
03:03
from four seconds to 22 seconds.
03:06
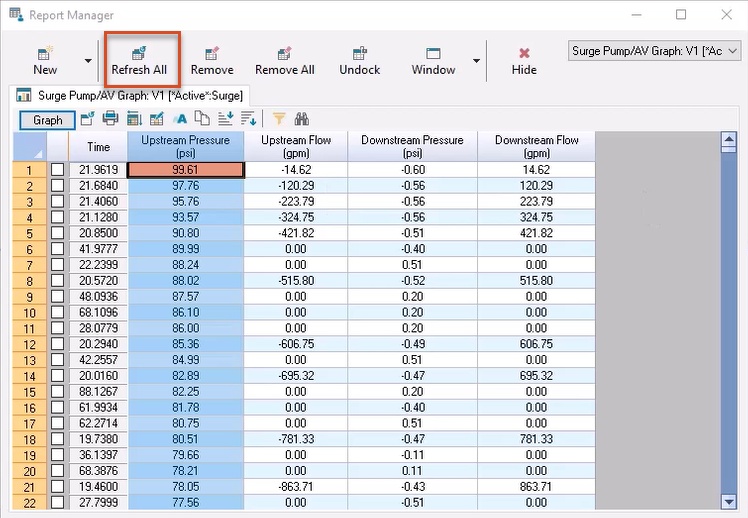
Run another surge analysis, and then reopen the Report Manager to refresh and review the results.
03:11
Note that optimizing valve operation times resulted in a drop in maximum upstream pressure to 99.61 psi.