00:04
Once you have set up your hydraulic model,
00:06
you can run a steady state simulation and review the hydraulic status report.
00:12
The run manager is used as the entry point
00:14
for modifying the options in settings for a simulation
00:17
running and troubleshooting a simulation
00:20
and managing the output sources
00:25
Double click the desired project dot APR X file to open
00:31
Once the project starts,
00:32
click the info water pro tab to open the info water pro ribbon
00:38
in the project panel, click initialize
00:42
in the model explorer operation tab expand simulation report
00:47
and then double click base base simulation report.
00:54
The simulation report allows you to create and customize the simulation,
01:01
in the simulation report dialog box select full for the hydraulic status
01:06
so that the status report will also include
01:09
information from each trial of each hydraulic analysis.
01:14
Also enable the generate network summary table
01:17
to create the report and generate warning messages
01:20
options so that you can see any error
01:23
or warning messages that occur during a simulation
01:30
Switch to the attribute tab in the model explorer
01:34
enable refresh output to automatically refresh
01:36
your output data after every simulation run
01:40
next open the run manager
01:43
in the standard tab set the report options to base base simulation
01:48
report to set the scope and content of the simulation report.
01:54
The simulation options determine the simulation parameters
01:58
for this exercise. Keep this set to base base simulation option
02:04
for the time setting.
02:05
Choose ss steady state analysis,
02:08
which is a time step that has already been configured for this simulation.
02:14
Then click run to run the simulation.
02:18
Notice the stoplight icon,
02:21
the green light indicates a successful simulation.
02:24
If this were yellow,
02:26
then it would have meant that the simulation received only partial results.
02:30
Then you would need to fix any warnings that appear in the log report.
02:35
Red would indicate a failed simulation
02:38
and gray would indicate that the simulation did not produce any output
02:43
results are available for any simulation that finishes with a green or yellow light
02:50
to open the text report in the toolbar, click report,
02:54
an html file opens in your web browser,
02:58
look through the report to see the analysis results of your simulation.
03:03
You can find answers to specific questions such as how many pipes are in the model.
03:08
In this case, there are 847
03:12
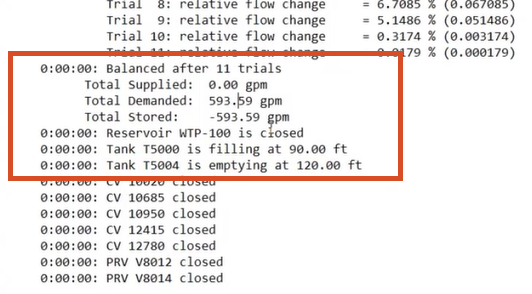
scroll down to see that it took 11 trials for the model to balance.
03:18
you can see the system totals for supply demand and storage.
03:24
The total system demand is 593.59 gallons per minute.
03:30
If the supply reads as zero as it does here,
03:34
you can determine where the water came from.
03:37
In this example, it was coming from one of the tanks. T 5004, which was emptying
03:44
when you are finished, you can close the text report and click ok,
03:48
to exit the run manager.