Step-by-step:
Annotations allow you to label network elements with data values. You can specify label placement, style, and size options so that they display properly. In this exercise, you create pipe diameter and velocity annotations for a steady state simulation result.
- Open the appropriate .aprx file in ArcGIS Pro.
- From the ribbon, InfoWater Pro tab, Project panel, click Initialize.
To create the pipe diameter annotation:
- In the Model Explorer, Operation tab, right-click Annotation and select New.

- In the Annotation Identification pop-up, for the Annotation ID, type “Diameter”.
- Click OK.
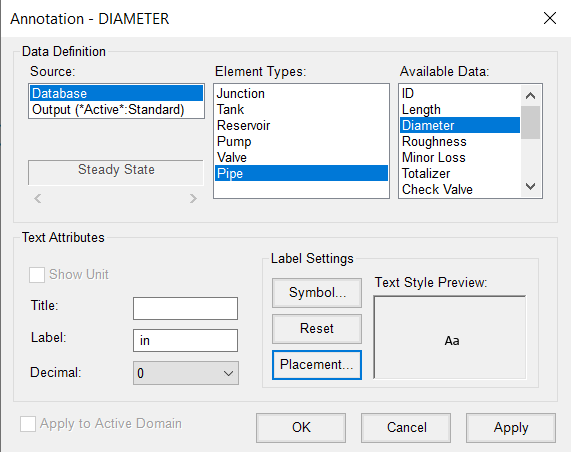
- In the Annotation dialog box:
- Set the Source to Database.
- Under Element Types, select Pipe.
- Set the Available Data to Diameter.
- In the Text Attributes group, set the Decimal value to 0.
- In the Label field, type “[SPACE]in”.
IMPORTANT: Make sure that you add a space before the word “in” so that the annotations display with a space between the value and the unit.
- Under Label Settings, click Placement.
- In the Label Placement for Line pop-up, for the Placement Option, select Place Above.
- Set the Offset from line to 10 Map Units.
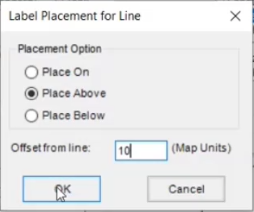
- Click OK to close the Label Placement for Line pop-up.
- Click OK to close the Annotation dialog box.
The annotation layer is created. Notice that the model now displays diameter values above the pipes.

To annotate the pipe velocity values:
- In the Model Explorer, Operation tab, right-click Annotation and select New.
- In the Annotation Identification pop-up, for the Annotation ID, type “Velocity”.
- Click OK.
- In the Annotation - VELOCITY dialog box:
- Set the Source to Output(*Active*:Standard).
- Under Element Types, select Pipe.
- Set the Available Data to Velocity.
- In the Text Attributes group, enable Show Unit.
- Set the Decimal value to 1.
- Under Label Settings, click Placement.

- In the Label Placement for Line pop-up, for the Placement Option, select Place Below.
- Set the Offset from line to 10 Map Units.
- Click OK to close the Label Placement for Line pop-up.
- Click OK to close the Annotation dialog box.
The annotation layer is created. The model now displays velocity values below the pipes.
- Zoom in and pan the map view to see the annotations and ensure they display properly.

Annotations are generated as an external shapefile and can be displayed at any time before or after a simulation run. Also be aware that they are saved as a permanent layer of an InfoWater Pro project.
- In the Contents pane, toggle the visibility of the VELOCITY and DIAMETER annotations on or off by clicking the checkboxes.


