00:04
Once you are done calibrating the hydraulic model,
00:07
you are ready to perform a water age analysis.
00:11
In info water pro a water age analysis computes the amount of time that
00:15
water has been in the network at each node throughout an extended period simulation
00:21
Double click the desired project dot
00:23
ARX file to open RGI
00:27
Once the project starts,
00:28
click the info water pro tab to open the info water pro ribbon
00:33
in the project panel, click initialize
00:37
you start the water age analysis process by setting up the simulation options
00:42
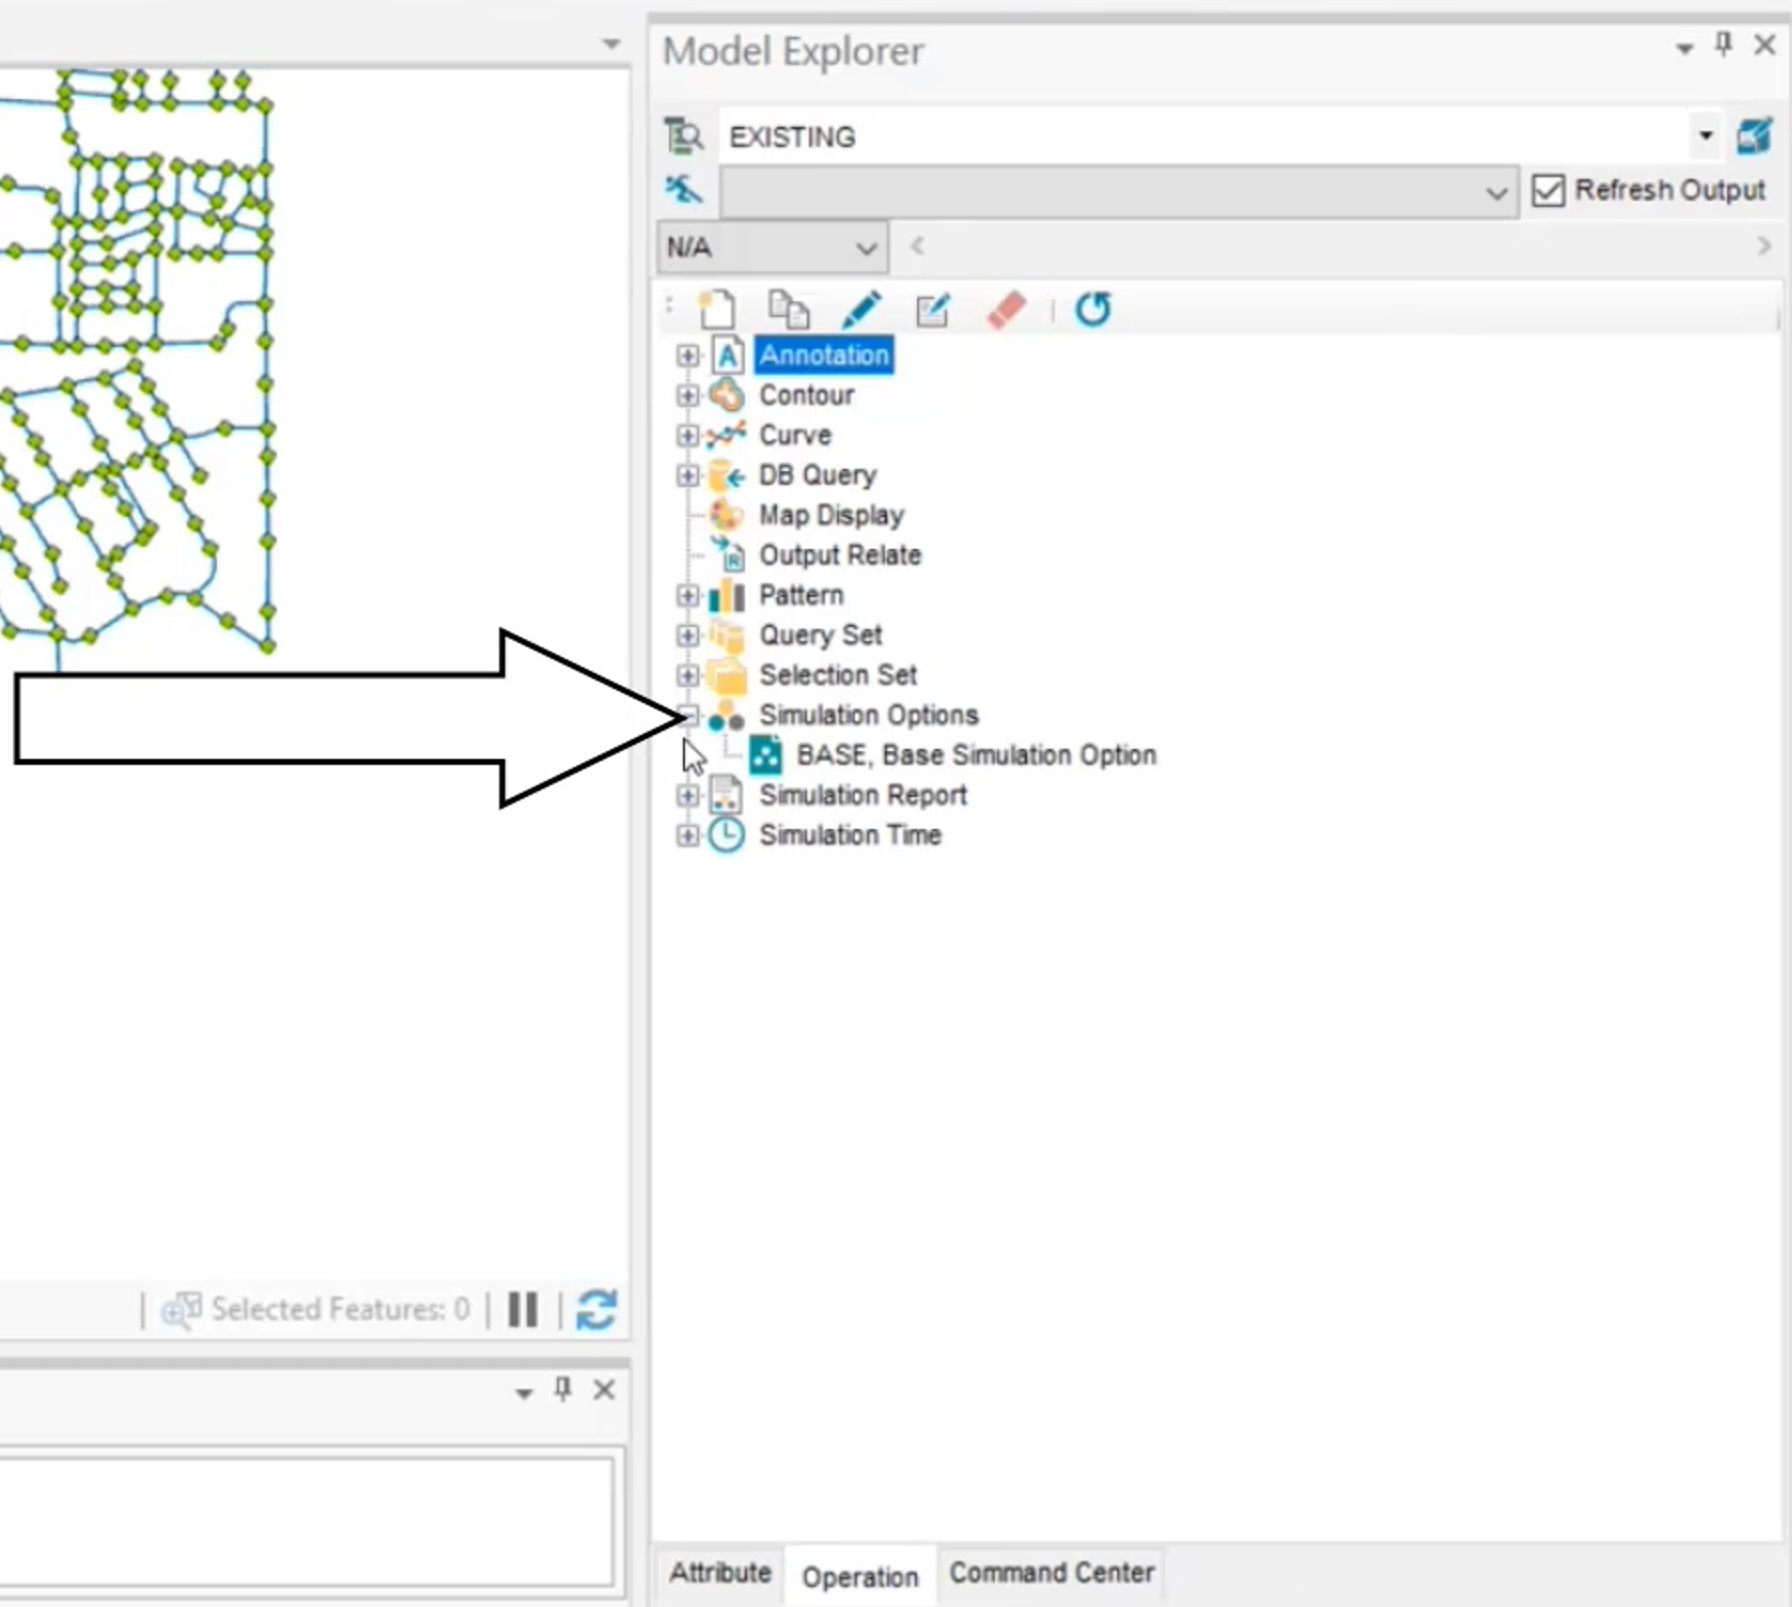
in the model explorer on the operation tab, expand the simulation options folder
00:48
and then double click base base simulation option
00:53
in the simulation options. Dialogue, click the clone icon,
00:58
enter a new id of W Q underscore age comma water age analysis
01:06
Switch to the quality tab,
01:08
select the water age option and then click OK.
01:13
Now set the simulation time
01:15
back in the model explorer on the operation tab, expand the simulation time folder
01:21
and then double click
01:23
s extended period analysis
01:26
in the simulation time window. Click the clone icon, enter a new ID of W
01:31
Q comma water quality analysis
01:38
Set the duration to 240 hours and then click OK.
01:42
You are ready to run the simulation
01:45
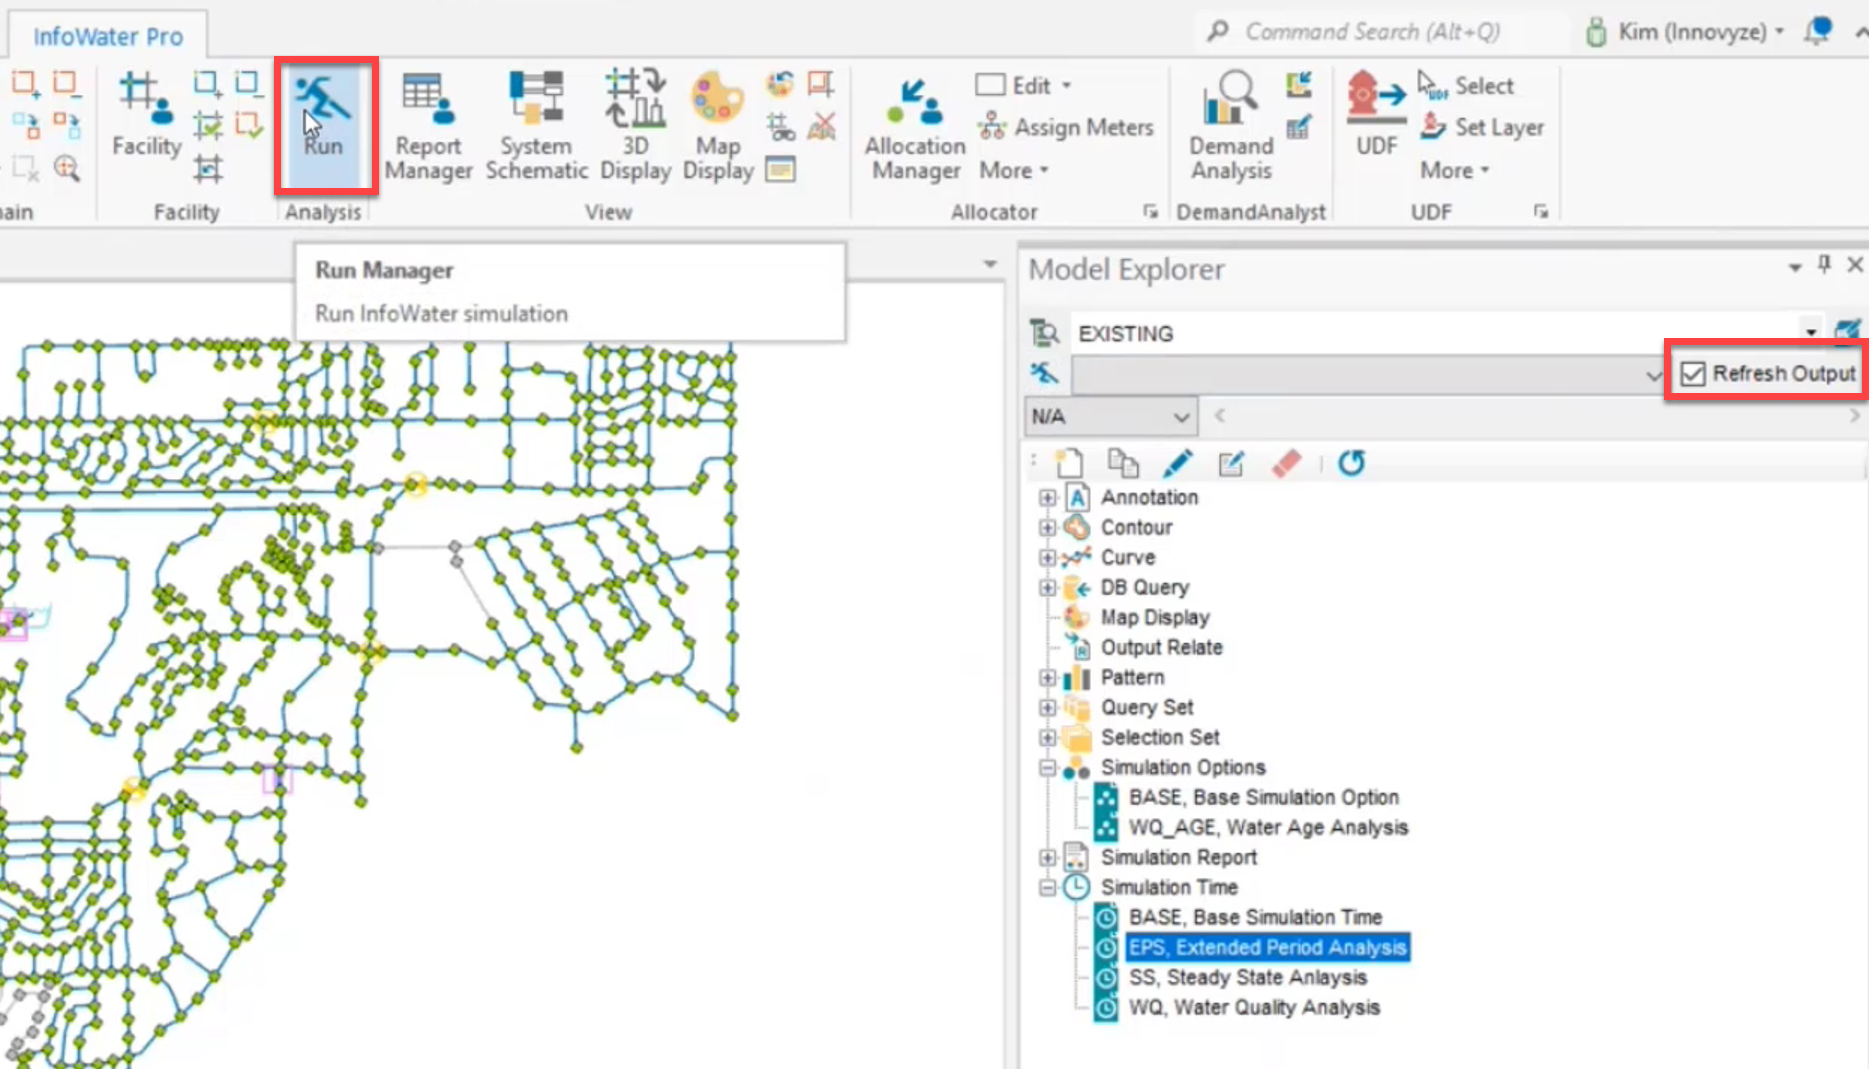
in the model explorer.
01:46
Make sure that the refresh output option is enabled and
01:49
then click the run icon to open the run manager
01:54
in the standard tab. Select the simulation and time options that you just created,
01:60
expand simulation options and select W
02:03
Q age water age analysis.
02:06
Then expand time setting and choose W
02:09
Q water quality analysis.
02:13
Click the run icon, then click OK. When the simulation has completed successfully,
02:19
you can now start to view the results of your water age analysis simulation
02:24
in the map, select any junction.
02:27
Then in the model explorer on the attribute tab,
02:30
click the graph icon to see the results for that junction.
02:34
In the report manager that opens,
02:36
expand the graph parameter dropdown and select water age.
02:41
Water quality parameters are only listed when
02:44
a water quality simulation is performed.
02:47
Note the initial rise in water age
02:51
all pipes are full and the age is showing as
02:53
zero because an initial water quality value was not entered
02:57
water quality results typically level out after stable conditions are reached,
03:02
click hide to close the report manager.
03:06
Next, you could set up color coding of these water age analysis results in the map,
03:11
then study the animation of how it changes over time.