& Construction
![architecture engineering and construction collection logo](https://damassets.autodesk.net/content/dam/autodesk/www/universal-header/flyout/architecture-engineering-construction-collection-uhblack-banner-lockup-364x40.png)
Integrated BIM tools, including Revit, AutoCAD, and Civil 3D
& Manufacturing
![product design manufacturing collection logo](https://damassets.autodesk.net/content/dam/autodesk/www/universal-header/flyout/product-design-manufacturing-collection-uhblack-banner-lockup-364x40.png)
Professional CAD/CAM tools built on Inventor and AutoCAD
Integrated BIM tools, including Revit, AutoCAD, and Civil 3D
Professional CAD/CAM tools built on Inventor and AutoCAD
Transcript
00:03
A contour is a collection of poly lines that
00:06
illustrates the spatial variability for an info water pro model
00:11
contours can be generated for any numeric junction
00:14
based model input field or simulation result.
00:17
Variable.
00:19
You can create pressure contours for a steady state
00:22
simulation result as a method for visualizing the results
00:27
to begin.
00:27
Double click the desired project dot APR X file to open Argi
00:32
Pro.
00:33
Once the project starts, click the info water pro tab to open info water pro ribbon
00:40
in the project panel, click initialize
00:45
first, you must define the domain
00:48
on the info water pro ribbon
00:50
in the domain panel, click domain manager
00:54
in the domain manager choose network as the element
00:57
source and then in the adjacent drop down,
00:60
select all junctions,
01:02
click add
01:04
all junctions in the map are now displayed in red.
01:08
Now choose map selection as the element source and click remove
01:14
zoom in on the map,
01:16
select the junction between the water treatment plant and the two nearby pumps.
01:22
If you cannot locate the junction,
01:24
you can use the model explorer to search for J 1404.
01:30
Once you have it selected
01:32
right, click anywhere in the map and select enter
01:36
this junction is removed from the domain.
01:39
Because in this particular model,
01:41
it is so close to the reservoir that it has
01:43
an artificially reduced pressure which would affect the contour lines.
01:48
Removing it from the domain ensures the contour lines will be more accurate.
01:54
Close the domain manager.
01:58
Now, you can create the contours
02:01
in the model explorer on the operation tab,
02:04
right
02:04
click contour and select new
02:07
enter pressure as the contour id
02:10
and then click. OK.
02:13
In the contour
02:14
pressure dialog box
02:16
on the source tab,
02:17
you define the data source
02:20
in the element source group, choose use domain
02:24
under data source, select output active standard.
02:30
Then for the data category, select pressure
02:34
switch to the level tab.
02:36
Here you will manually set the values for the color ramp.
02:39
So deselect the option compute level automatically while contouring.
02:46
Then in the value ramp group set the from value to 40
02:50
the two value to 160
02:53
and set the increments to 10
02:56
click, create
02:59
the colors in the color ramp update.
03:02
Switch to the labeling tab.
03:05
Ensure that label contour line is selected and select show unit.
03:11
Keep the contour lined with set to two.
03:14
And in the decimal dropdown, select zero
03:18
in the placement option group enable the place on option.
03:23
Ensure that the label field dropdown is set to label
03:28
click. OK, to close the contour dialog box and generate the contours
03:34
zoom out to view the results
03:37
contours are generated as an external shape file and can be
03:41
displayed at any time before or after a simulation run.
03:46
Also be aware that they are saved as a permanent layer of an info water pro project
03:52
in the contents pane note that you can toggle
03:54
the visibility of the pressure contours on or off.
Video transcript
00:03
A contour is a collection of poly lines that
00:06
illustrates the spatial variability for an info water pro model
00:11
contours can be generated for any numeric junction
00:14
based model input field or simulation result.
00:17
Variable.
00:19
You can create pressure contours for a steady state
00:22
simulation result as a method for visualizing the results
00:27
to begin.
00:27
Double click the desired project dot APR X file to open Argi
00:32
Pro.
00:33
Once the project starts, click the info water pro tab to open info water pro ribbon
00:40
in the project panel, click initialize
00:45
first, you must define the domain
00:48
on the info water pro ribbon
00:50
in the domain panel, click domain manager
00:54
in the domain manager choose network as the element
00:57
source and then in the adjacent drop down,
00:60
select all junctions,
01:02
click add
01:04
all junctions in the map are now displayed in red.
01:08
Now choose map selection as the element source and click remove
01:14
zoom in on the map,
01:16
select the junction between the water treatment plant and the two nearby pumps.
01:22
If you cannot locate the junction,
01:24
you can use the model explorer to search for J 1404.
01:30
Once you have it selected
01:32
right, click anywhere in the map and select enter
01:36
this junction is removed from the domain.
01:39
Because in this particular model,
01:41
it is so close to the reservoir that it has
01:43
an artificially reduced pressure which would affect the contour lines.
01:48
Removing it from the domain ensures the contour lines will be more accurate.
01:54
Close the domain manager.
01:58
Now, you can create the contours
02:01
in the model explorer on the operation tab,
02:04
right
02:04
click contour and select new
02:07
enter pressure as the contour id
02:10
and then click. OK.
02:13
In the contour
02:14
pressure dialog box
02:16
on the source tab,
02:17
you define the data source
02:20
in the element source group, choose use domain
02:24
under data source, select output active standard.
02:30
Then for the data category, select pressure
02:34
switch to the level tab.
02:36
Here you will manually set the values for the color ramp.
02:39
So deselect the option compute level automatically while contouring.
02:46
Then in the value ramp group set the from value to 40
02:50
the two value to 160
02:53
and set the increments to 10
02:56
click, create
02:59
the colors in the color ramp update.
03:02
Switch to the labeling tab.
03:05
Ensure that label contour line is selected and select show unit.
03:11
Keep the contour lined with set to two.
03:14
And in the decimal dropdown, select zero
03:18
in the placement option group enable the place on option.
03:23
Ensure that the label field dropdown is set to label
03:28
click. OK, to close the contour dialog box and generate the contours
03:34
zoom out to view the results
03:37
contours are generated as an external shape file and can be
03:41
displayed at any time before or after a simulation run.
03:46
Also be aware that they are saved as a permanent layer of an info water pro project
03:52
in the contents pane note that you can toggle
03:54
the visibility of the pressure contours on or off.
Contours are a collection of polylines that illustrates the spatial variability for an InfoWater Pro model. Contours can be generated for any numeric junction-based model input field or simulation result variable.
To create pressure contours for a steady state simulation result as a method of visualizing the results:
All junctions in the map are now displayed in red.
This junction is removed from the domain because, in this particular model, it is so close to the reservoir that it has an artificially reduced pressure, which would affect the contour lines. Removing it from the domain ensures the contour lines will be more accurate.
To create the contours:
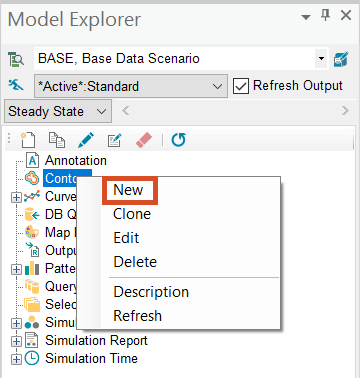
To manually set the values for the color ramp:
Note: Contours are generated as an external shapefile and can be displayed at any time before or after a simulation run. Also be aware that they are saved as a permanent layer of an InfoWater Pro project.
How to buy
Privacy | Do not sell or share my personal information | Cookie preferences | Report noncompliance | Terms of use | Legal | © 2025 Autodesk Inc. All rights reserved
Sign in to start learning
Sign in for unlimited free access to all learning content.Save your progress
Take assessments
Receive personalized recommendations