Step-by-step:
InfoWater Pro provides many ways to view and analyze different types of simulation outputs, such as tabular reports, graphical reports, map displays, animation, contours, and annotations. You can save time by using the Customized Report Manager to create a customized report and save the format for later use.
- Open the appropriate .aprx file in ArcGIS Pro.
- From the ribbon, InfoWater Pro tab, Project panel, click Initialize.
- In the Model Explorer, Command Center tab, expand the Tools folder.
- Double-click Customized Report Manager.
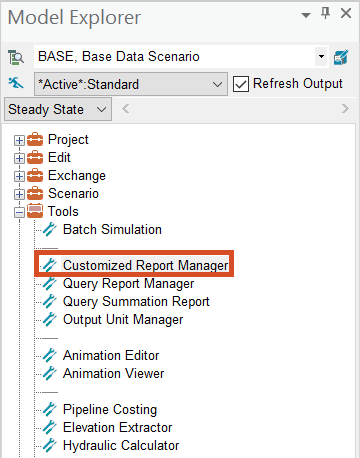
This opens a three-step wizard in which you can select the input and output data for your customized report.
- In the Step1: Define Data Source page:
- Expand the Element Type drop-down and set it to Pipe.
- In the Input Data group, deselect Geometry Data.
- In the Output Data group, set Output Range Information of to Velocity.

- Click Next.
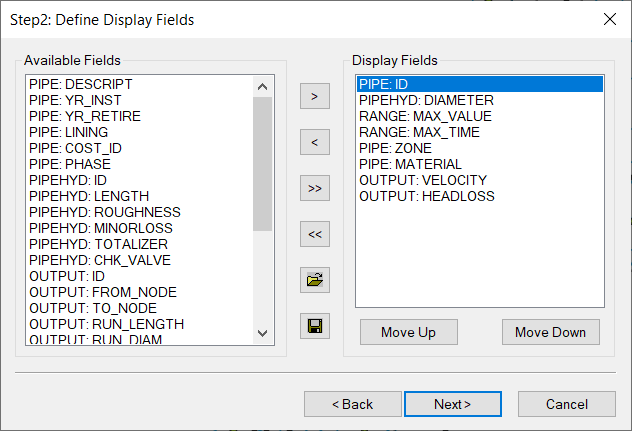
- In the Step2: Define Display Fields page:
- Click Remove All Fields (<<) to move all options to the Available Fields list. (Note that, since you turned off Geometry Data in Step1, there is now no geometry data available in the Step2 fields.)
- Press and hold CTRL and multi-select these Available Fields: PIPE:ID, PIPE:ZONE, PIPE:MATERIAL, PIPEHYD:DIAMETER, OUTPUT:VELOCITY, OUTPUT:HEADLOSS, RANGE:MAX_VALUE, and RANGE:MAX_TIME.
- Click Add (>) to add your selections to the Display Fields list.
- Click Move Up and Move Down to reorder the Display Fields list so they appear as follows: PIPE:ID, PIPEHYD:DIAMETER, RANGE:MAX_VALUE, RANGE:MAX_TIME, PIPE:ZONE, PIPE:MATERIAL, OUTPUT:VELOCITY, OUTPUT:HEADLOSS.
- Click Save to save this collection of Display Fields in this order.
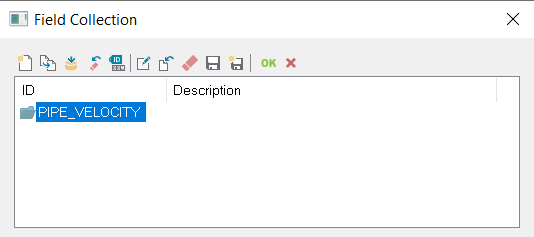
- In the Field Collection dialog box, click New.
- In the popup, type a New ID of “Pipe_Velocity”.
- Click OK.
- In the Field Collection toolbar, click OK.
- Click Yes to confirm.
The pipe velocity field collection file is saved and ready to be used.
- Back in the Customized Report Manager, click Next to move to the Step3: Define Display Scope page.
- For this tutorial, leave these options as they are; click Finish.
The report is opened for all pipes in the Report Manager. It displays the custom field selection as headings across the top of the table, in the order that you set.
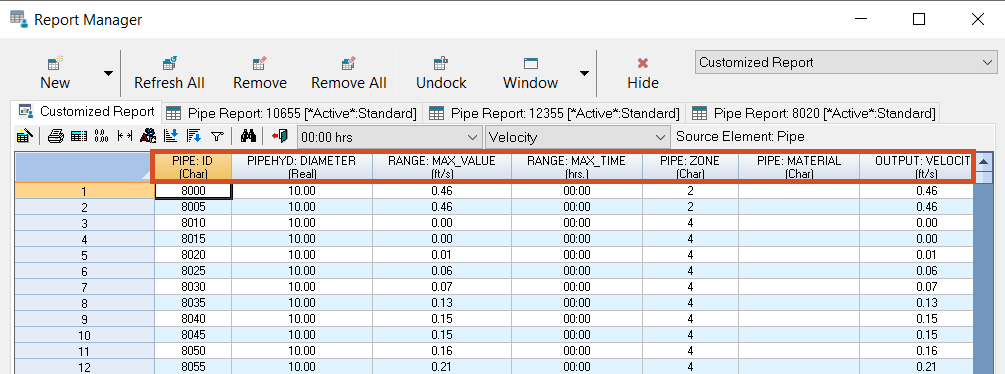
- View the report.
- Click Hide to close the Report Manager.
To select and open the saved field collection table you just created:
- In the Model Explorer, on the Command Center tab, expand the Tools folder.
- Double-click Customized Report Manager to re-open the wizard.
- On the Step1: Define Data Source page, set the Element Type to Pipe.
- Click Next.
- On the Step2: Define Display Fields page, click Open.
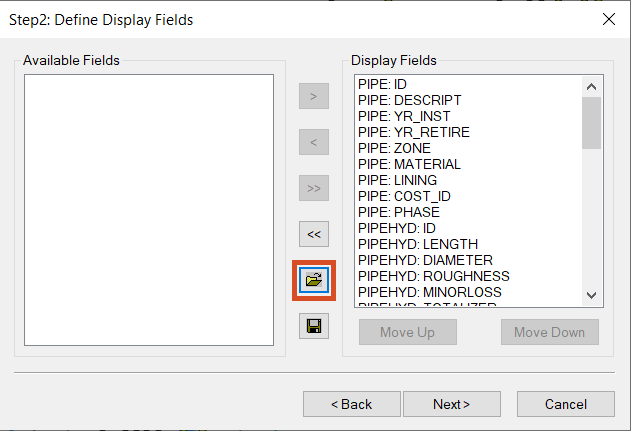
- In the Field Collection dialog box, select PIPE_VELOCITY.
- Click OK.
The Display Fields list populates with the fields saved in your collection. This saves you time since you do not need to re-select and reorder the needed fields.
- Click Next.
- Click Finish to view the report.
- When you are finished, click Hide to close the Report Manager.


