00:04
When working with simulation results, the graphing tools in InfoWorks ICM offer various ways to view and analyze results.
00:13
Graphs are also useful to present data to colleagues, clients, and other stakeholders.
00:19
In this exercise, you use various graphing tools to view and analyze your simulation results.
00:25
To begin, copy the data out of the transportable database .icmt file for this tutorial,
00:33
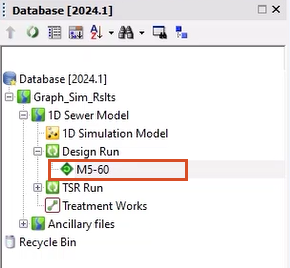
and double-click the Design Run simulation to open it in the GeoPlan.
00:40
Start by graphing a single node in your simulation results.
00:44
Click the Find in GeoPlan tool and perform a Quick Find for node TF91296202.
00:55
Click the Graph tool, then click the selected node.
00:60
If you see a Multiple Selection popup, choose the first node, and then click OK.
01:05
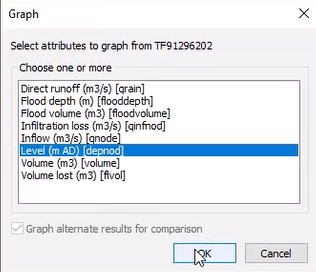
In the Graph dialog, select the attribute to graph in the list of node-specific parameters.
01:12
You can choose multiple properties to graph, but for this example, select Level, and then click OK.
01:20
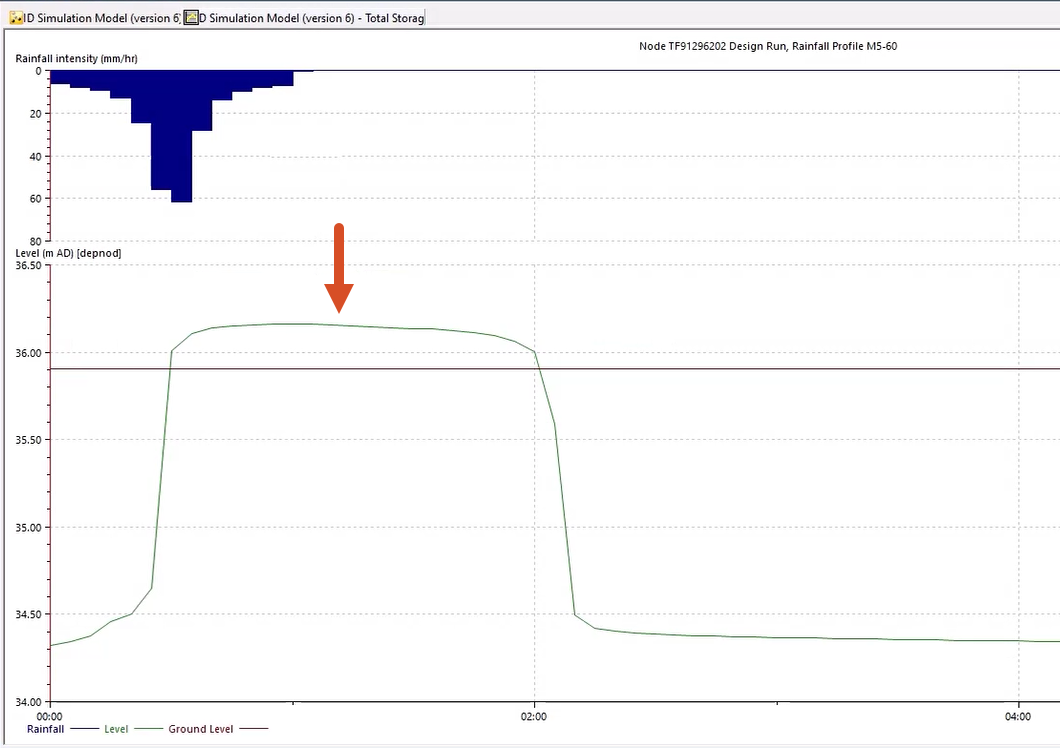
The graph appears, displaying level properties of the node throughout the replay results.
01:25
Notice the Ground Level line.
01:28
Anything above this line indicates flooding.
01:31
Close the graph, and then click Clear selection to clear any active selections in the model.
01:37
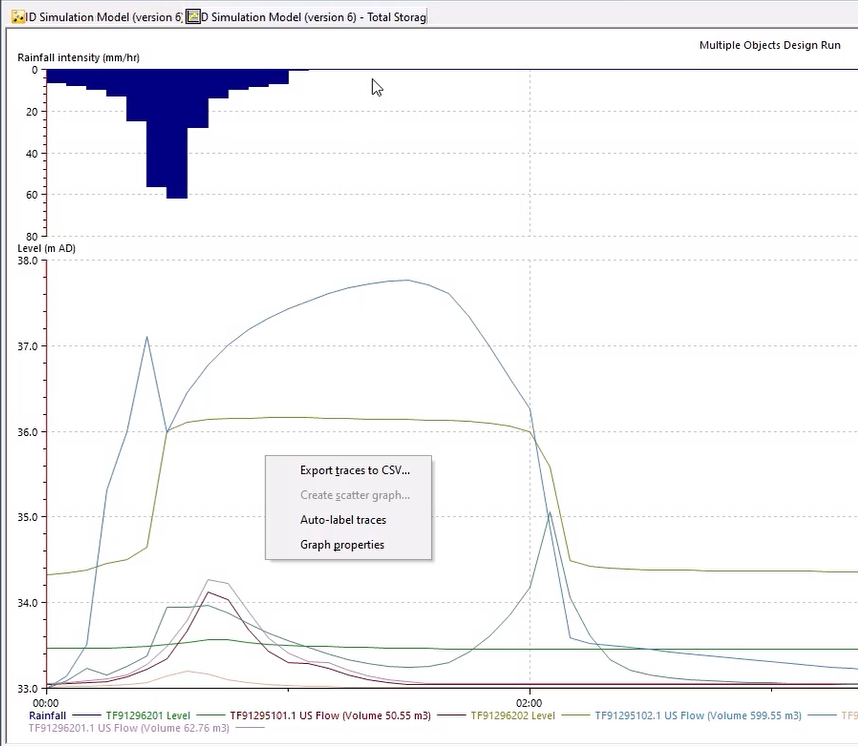
You can also graph several objects at once.
01:40
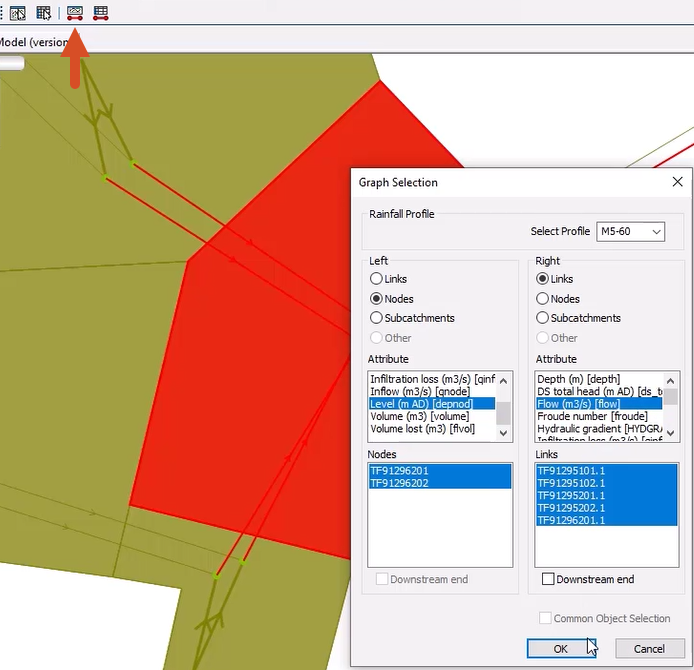
Select multiple elements in the model, and then click the Graph selected objects tool.
01:47
In the Graph Selection dialog, select what to view in the results graph.
01:52
For example, in the Left section, select Nodes, and the Level attribute.
01:59
In the Right section, select Links and the Flow attribute.
02:04
Click OK to graph this multi-selection.
02:08
Right click the graph to see additional options such as export to csv.
02:14
When you are finished exploring, close the graph, and then click Clear selection.
02:20
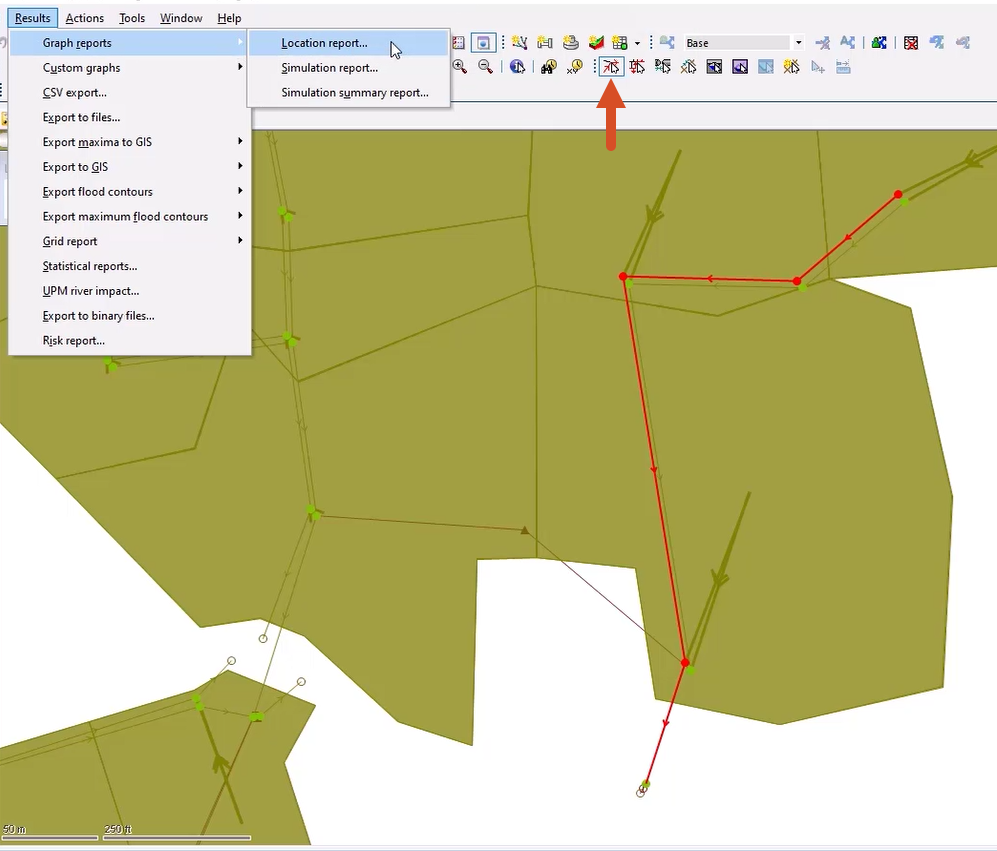
A graph report is a more advanced form of graphing and allows you to compare results,
02:26
either from multiple locations or from multiple simulations.
02:31
Click the Find in GeoPlan tool and perform a Quick Find for link TF92292302.1.
02:41
Click the Trace and select links upstream tool, and then click the selected link.
02:49
From the Results menu, select Graph Reports > Location Report.
02:57
A Locations popup appears, displaying the selected simulation and selection list.
03:03
This window allows you to change these locations, but for this example, leave them as is, and click Produce Graphs.
03:12
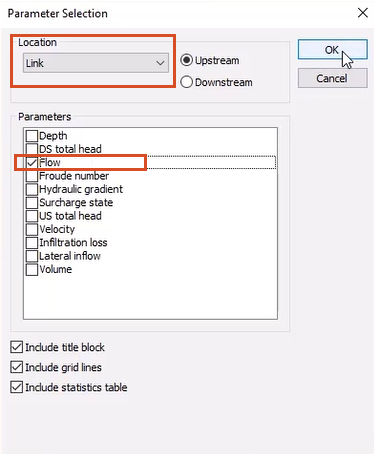
In the Parameter Selection dialog, select Link as the Location, and in the Parameters section, select Flow.
03:20
Click OK and close the Locations popup.
03:25
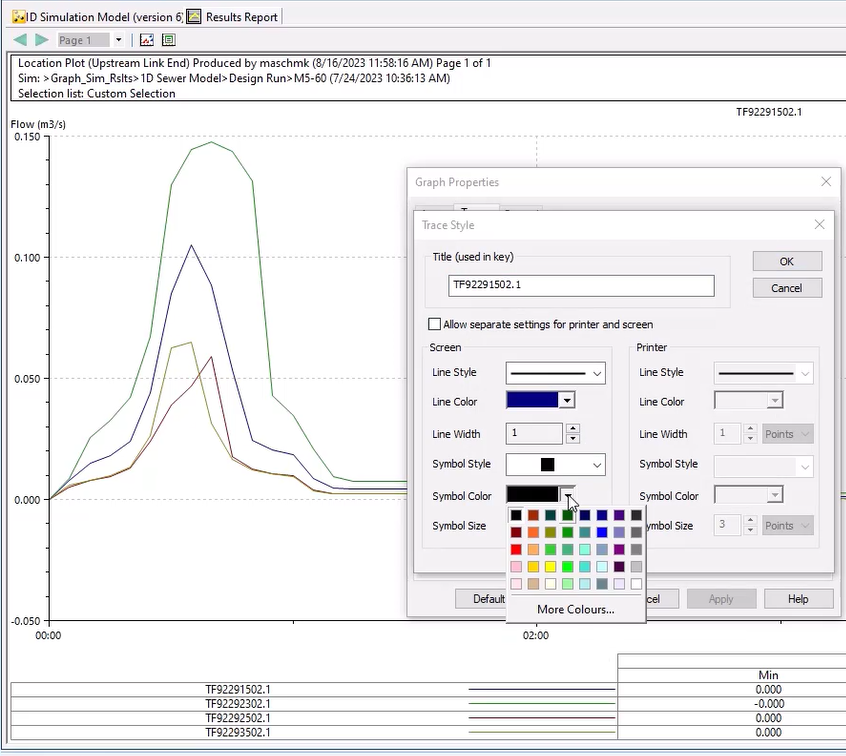
Compare the flow in the links to determine where a large portion of the flow is coming into the network.
03:32
Zoom into the graph.
03:34
You can adjust the graph axes by double-clicking one of them to open the Graph Properties dialog.
03:40
Select the Traces tab to adjust the color and style of the lines.
03:46
Try changing a few properties of the graph, and then click OK.
03:52
Close the graph, and then click Clear selection.
03:58
It is also possible to create more flexible custom graphs and then save them to the model group for future use.
04:05
Click the Find in GeoPlan tool and perform a Quick Find for the tank Storm_Tank1.
04:12
With the Select tool enabled, press CTRL and select the link directly updownstream from the tank, in the direction of Storm_Tank1.2.
04:22
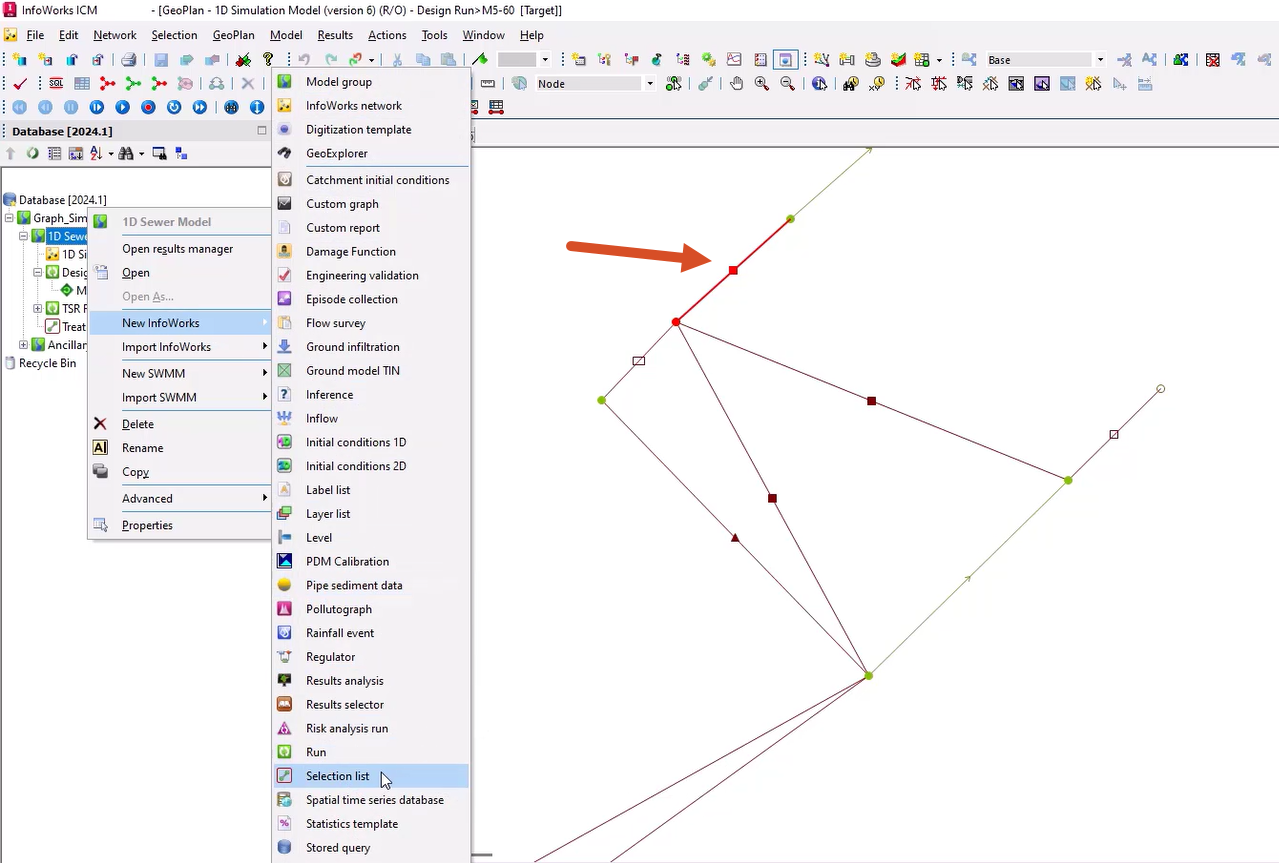
With these selections active, create a Selection List.
04:27
Right-click your model group and select New InfoWorks > Selection List.
04:33
Name the selection “Storm Tank Spill”, and then click OK.
04:38
This is a static selection set and will not change based on the timestep.
04:43
You can now create a custom graph report for this selection.
04:47
Right-click the model group and select New InfoWorks > Custom graph.
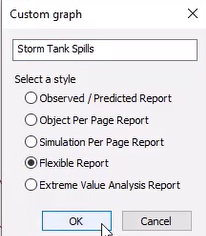
04:54
In the Custom Graph window, enter the name “Storm Tank Spills” and select Flexible Report as the style of graph.
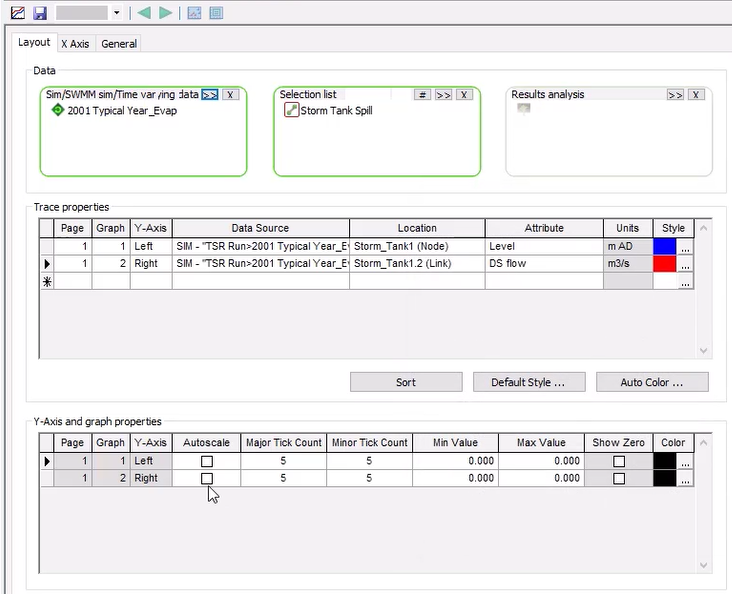
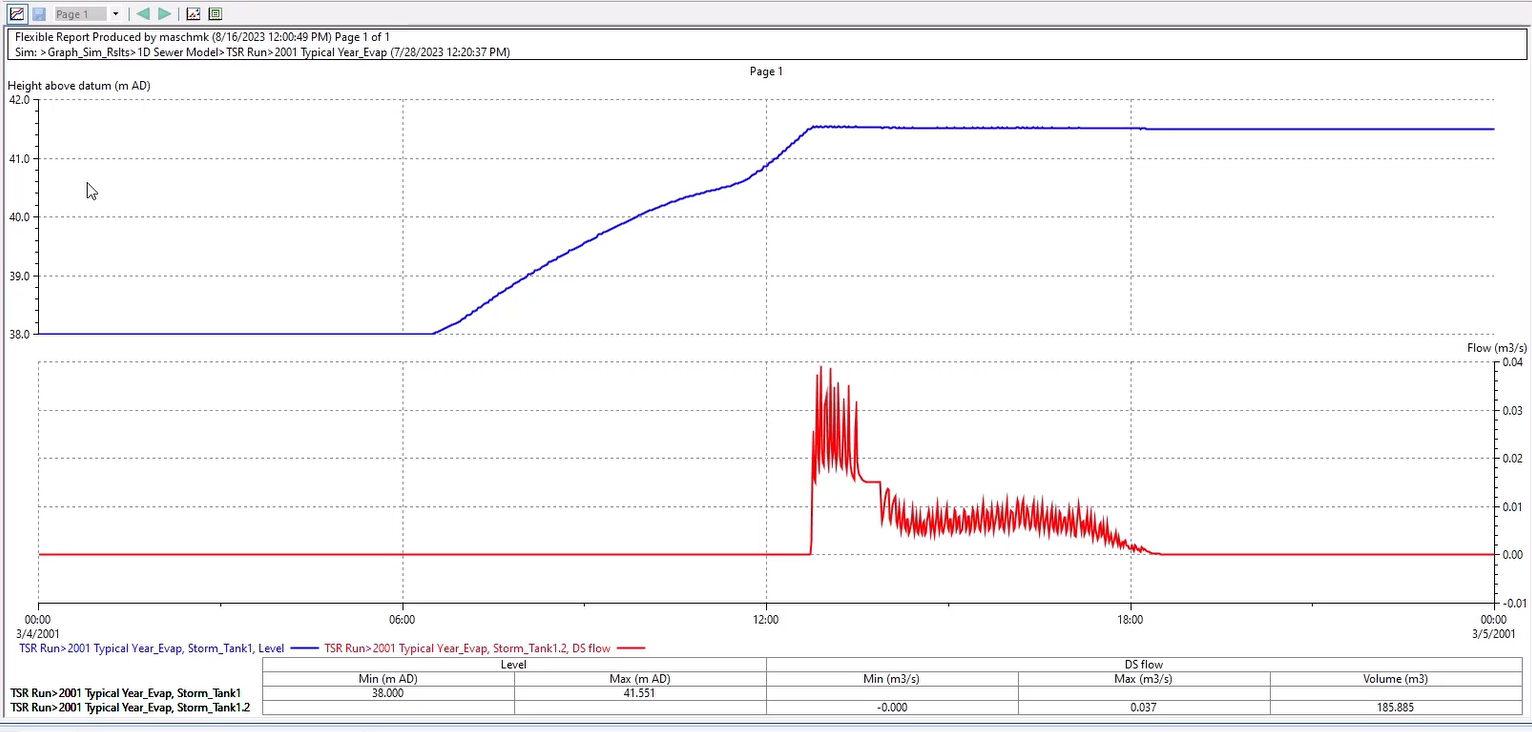
05:04
Double-click Storm Tank Spills to open the graph setup tool in the main window.
05:09
On the Layout tab, in the Data section, drag the previously completed TSR Run into the Sim box
05:17
and drag Storm Tank Spill into the Selection list box.
05:21
In the Trace properties section, set up two rows using the drop-down lists for each field:
05:29
First row: Page 1, Graph 1, Y-Axis Left, Data Source TSR Run,
05:37
Location Storm_Tank1 (Node), Attribute Level, and Style line color Blue.
05:47
Second row: Page 1, Graph 2, Y-Axis Right, Data Source TSR Run,
05:56
Location Storm_Tank1.2 (Link), Attribute DS Flow, and Style line color Red.
06:07
Click Save to save your changes,
06:11
and then click the Graph View tool to view your flexible graph report.
06:16
If you want to change any of the custom graph parameters, click the Graph View tool again to return to the graph setup page.
06:23
For example, to set it up as two graphs on one page, change the value in the second row of the Graph column to 1.
06:32
When you are done making changes, close the graph.