00:04
When your 1D-2D river model is complete, it can be used for simulations.
00:09
In this tutorial, you create two sets of runs, with and without an initial conditions object,
00:17
and analyze and compare the generated results.
00:21
For more complex 1D-2D models it may be too complicated or onerous to use the initial condition objects.
00:29
In those situations, an initial state file simulation should be used which generates the correct starting conditions for the simulation.
00:39
To begin, open the transportable database .icmt file for this tutorial, copy all of the content to the database.
00:50
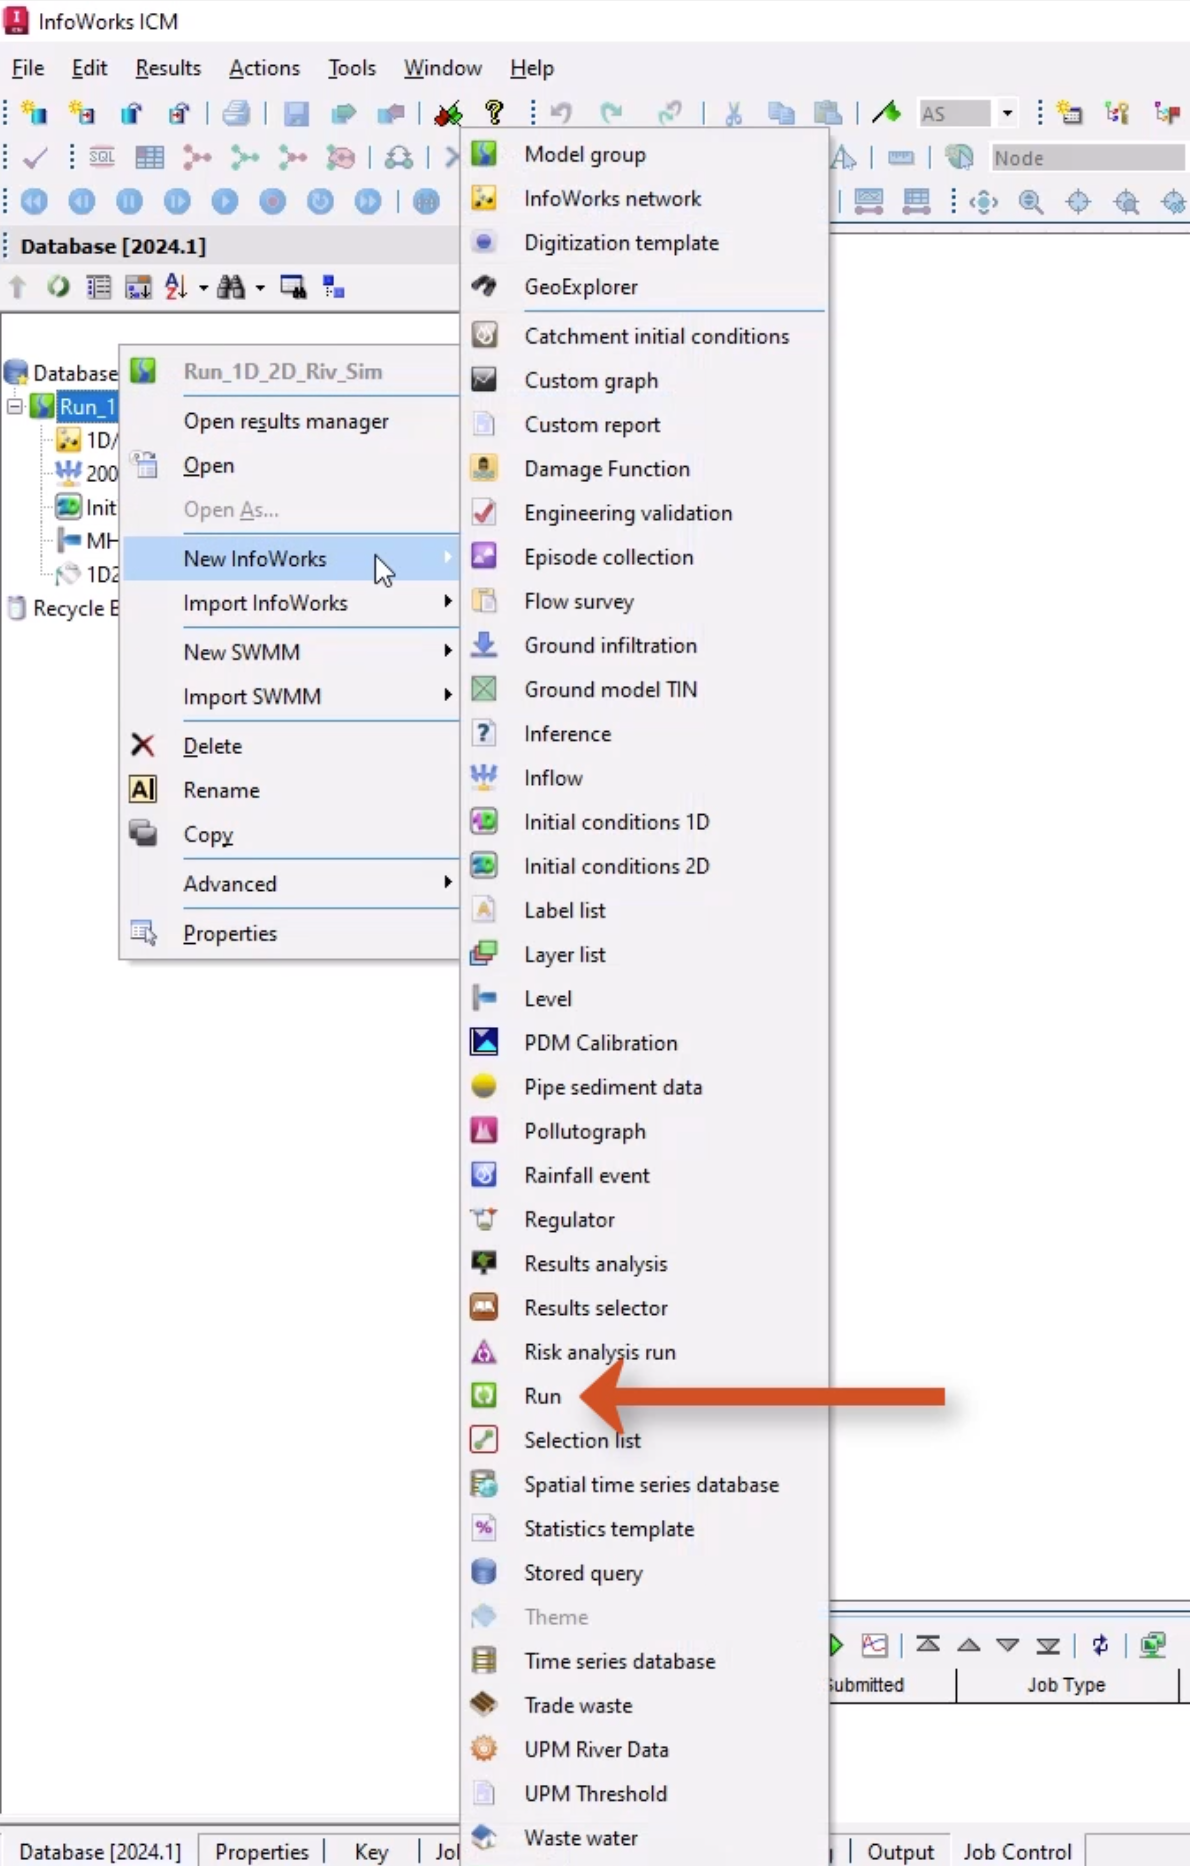
In the Database, right-click the Model Group and select New InfoWorks > Run.
00:58
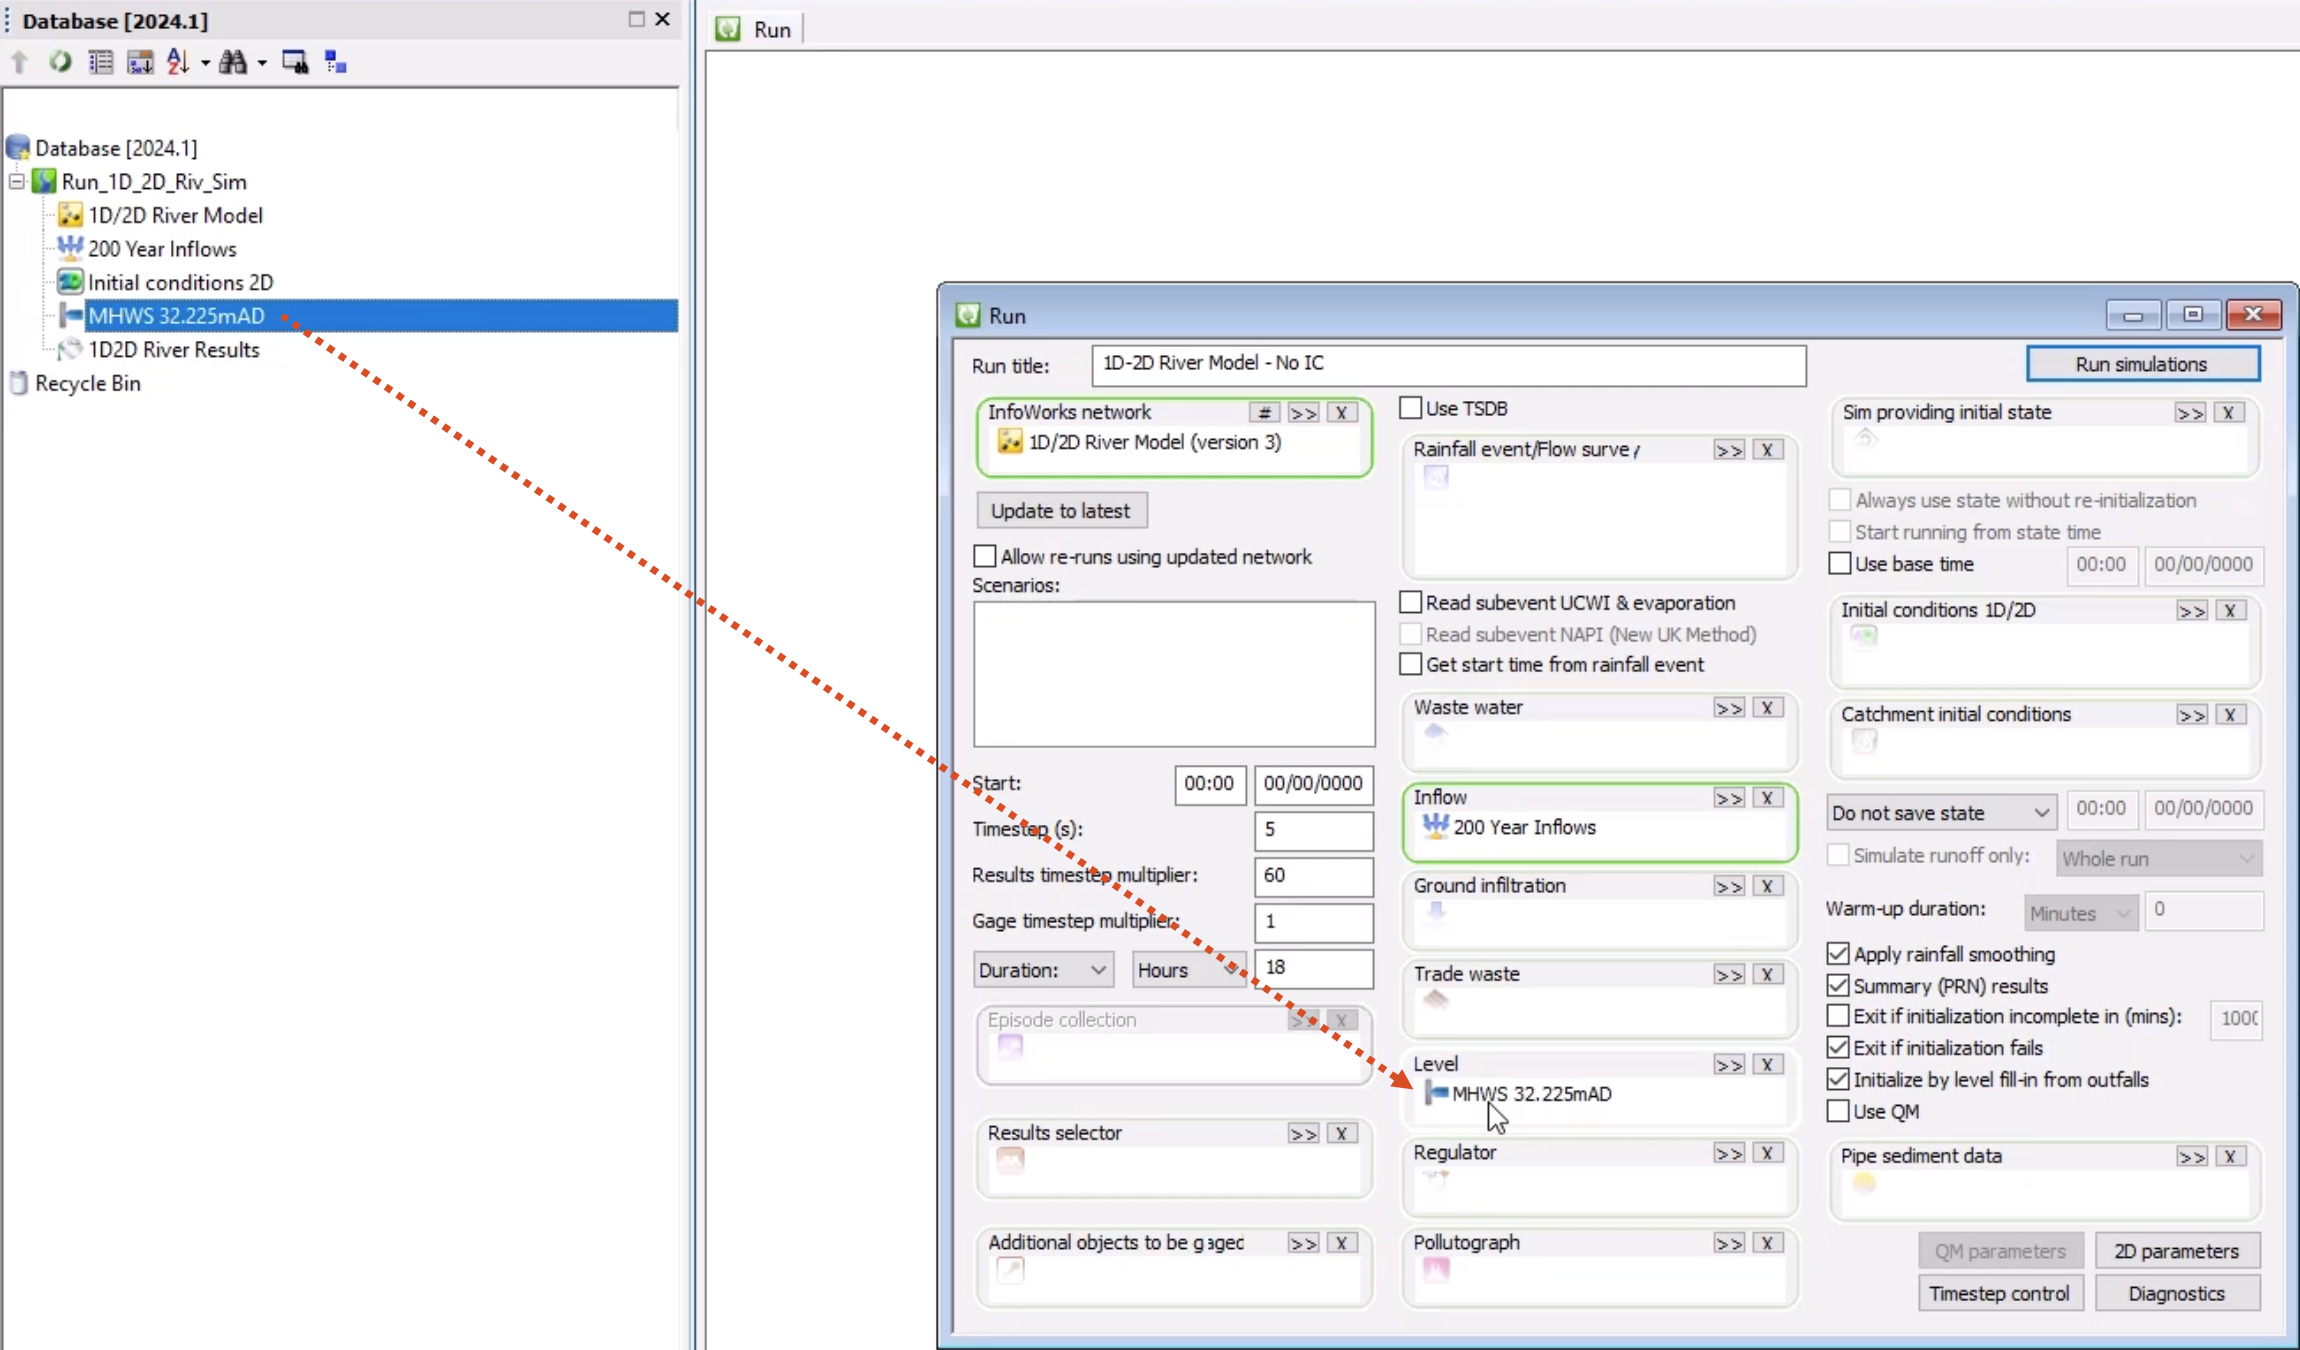
In the Run window, add a Run title of “1D-2D River Model – No IC”.
01:07
From the Database, drag 1D/2D River Model into the Run window and drop it into the InfoWorks network section.
01:19
Set the following time-related parameters:
01:22
Timestep(s): Set to a more appropriate value of 5
01:27
Results timestep multiplier: 60
01:31
Duration: Set the drop-down to Hours and the amount to 18
01:37
From the Database, drag 200 Year Inflows into the Run window, and then drop it into the Inflow section.
01:46
Drag MHWS 32.255mAD into the Level section.
01:54
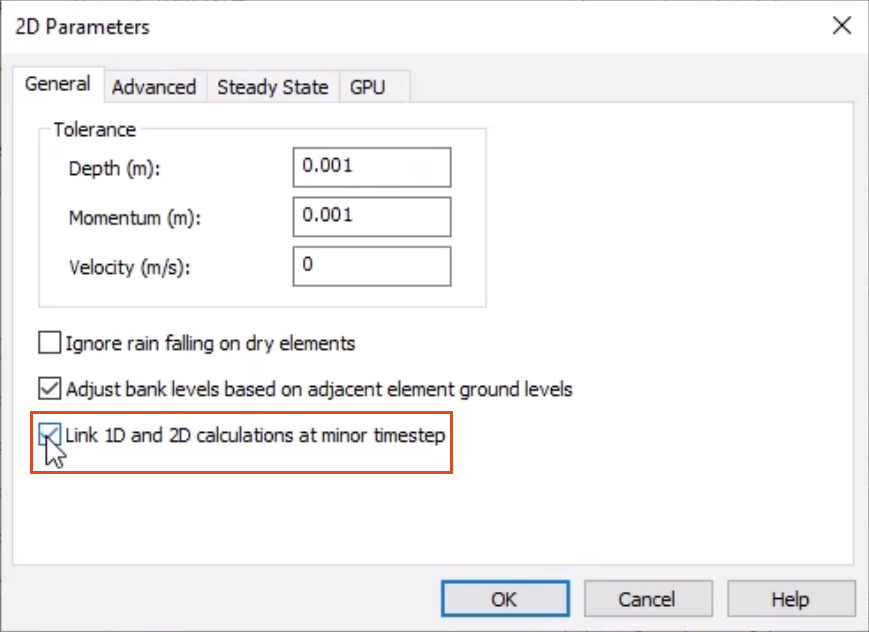
To aid the simulation stability, click 2D parameters,
01:59
and on the General tab, enable Link 1D and 2D calculations at minor timestep.
02:09
Click Run simulations.
02:11
In the Schedule Job(s) popup, click OK.
02:16
From the Window menu, select Job control window
02:21
to display the status of scheduled simulation jobs.
02:24
In the Database, double-click 1D-2D River Model - No IC
02:31
to open the Run window.
02:33
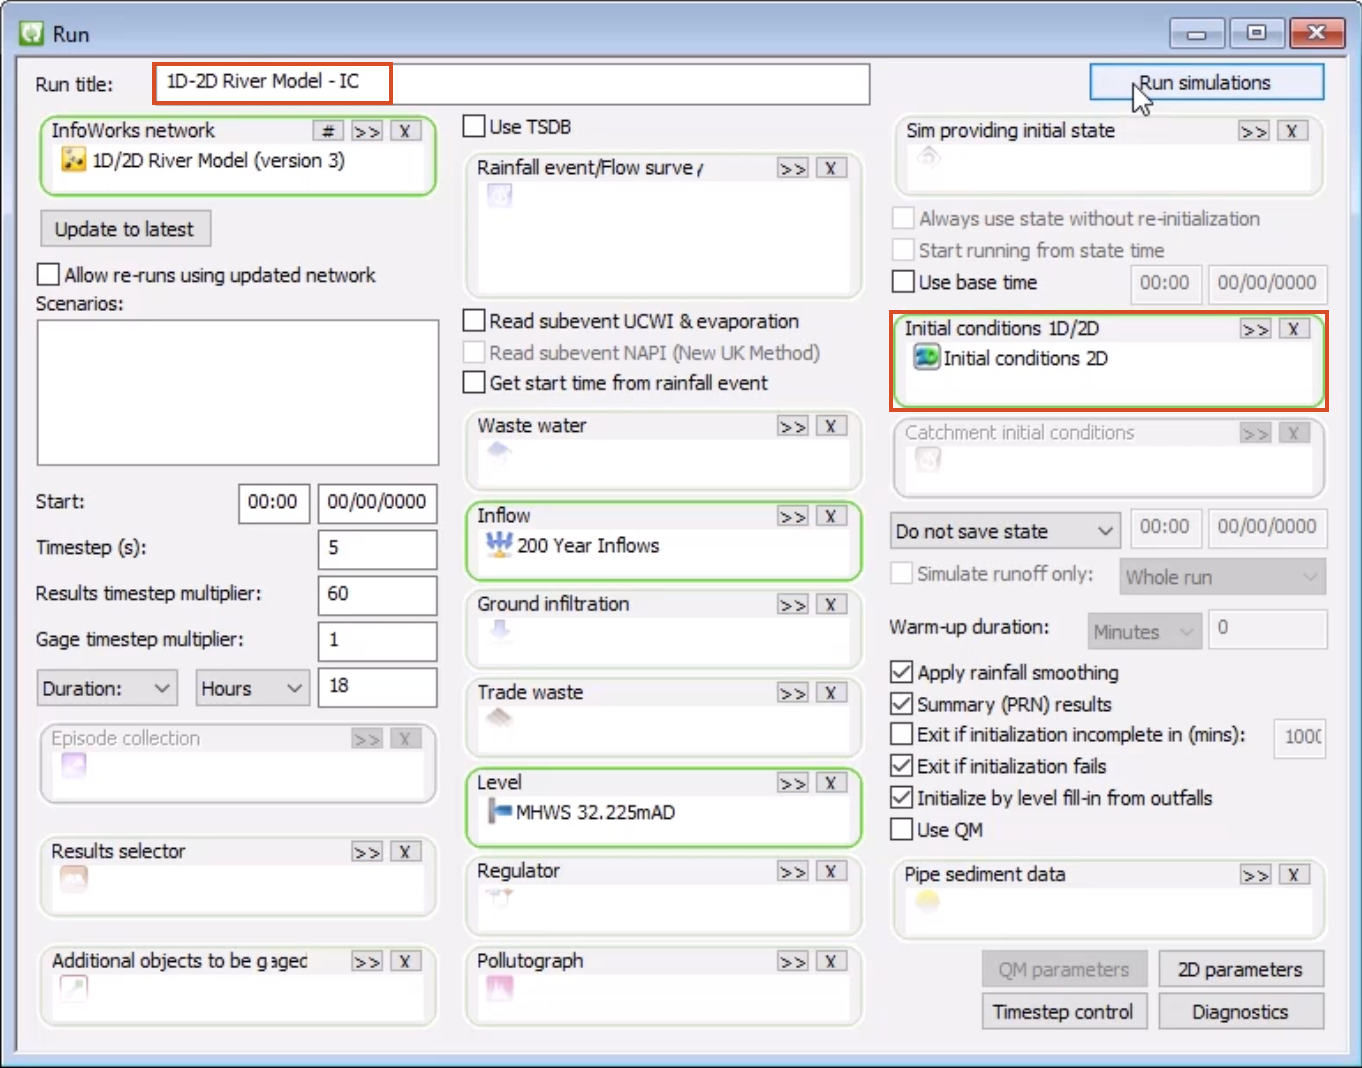
Update the Run title to “1D-2D River Model - IC”
02:39
and from the database, drag the Initial conditions 2D object into the run window to add it.
02:47
Click Run simulations.
02:50
Once the first simulation is complete, you can analyze the results.
02:54
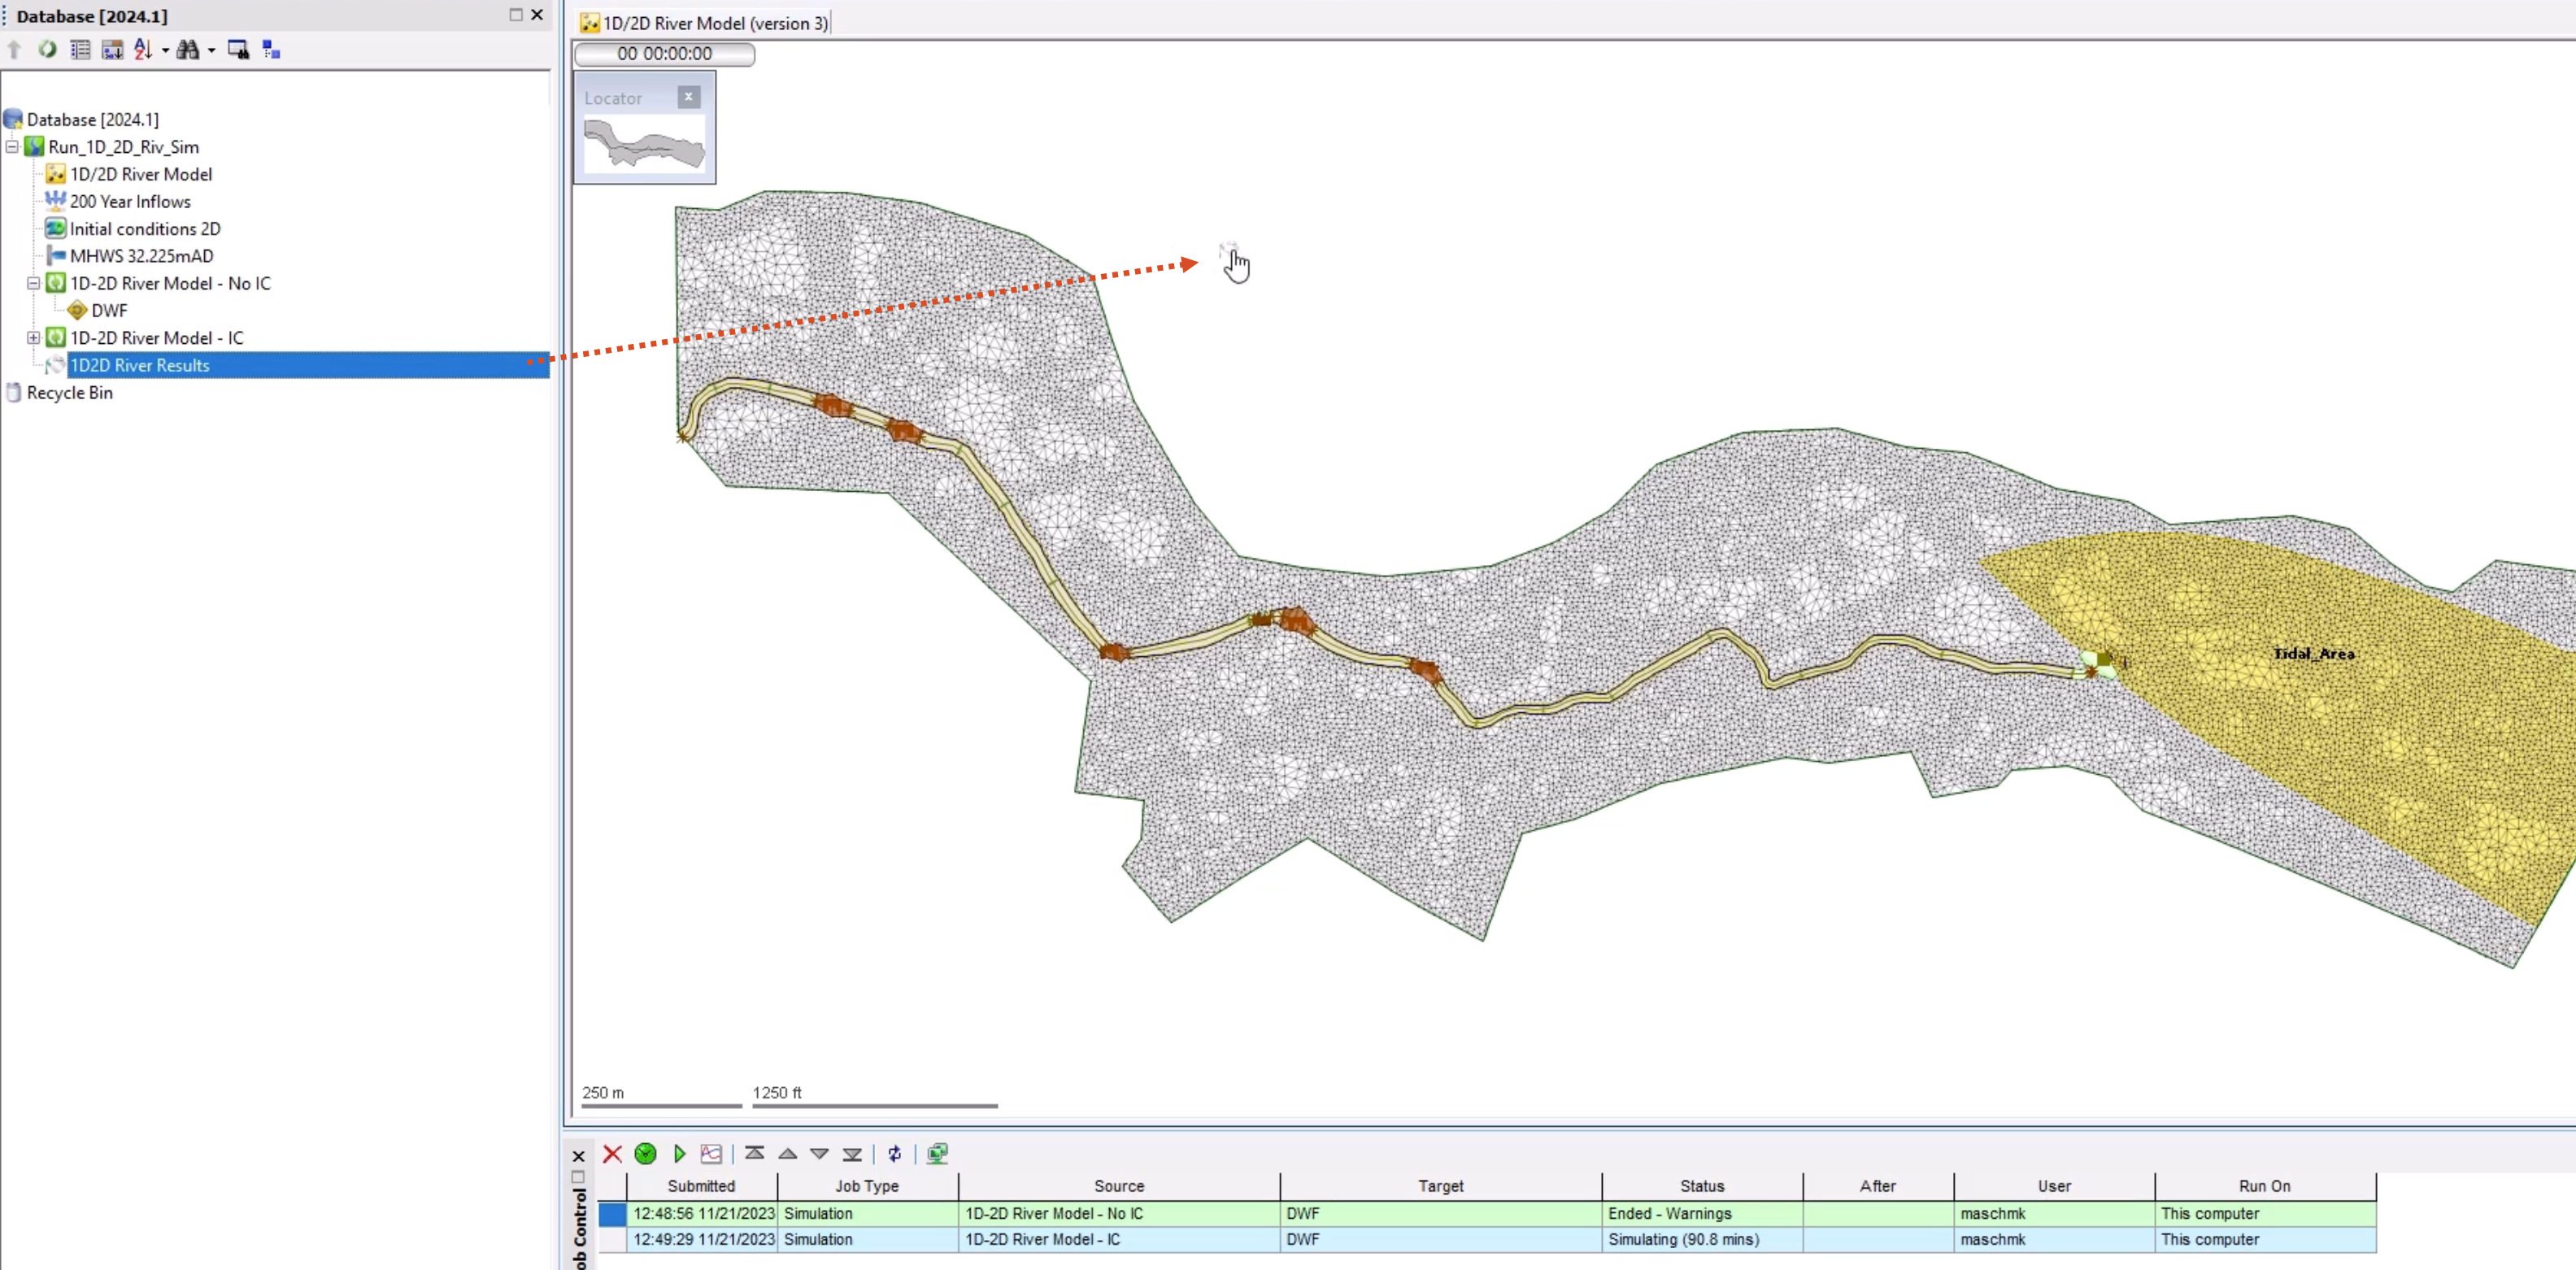
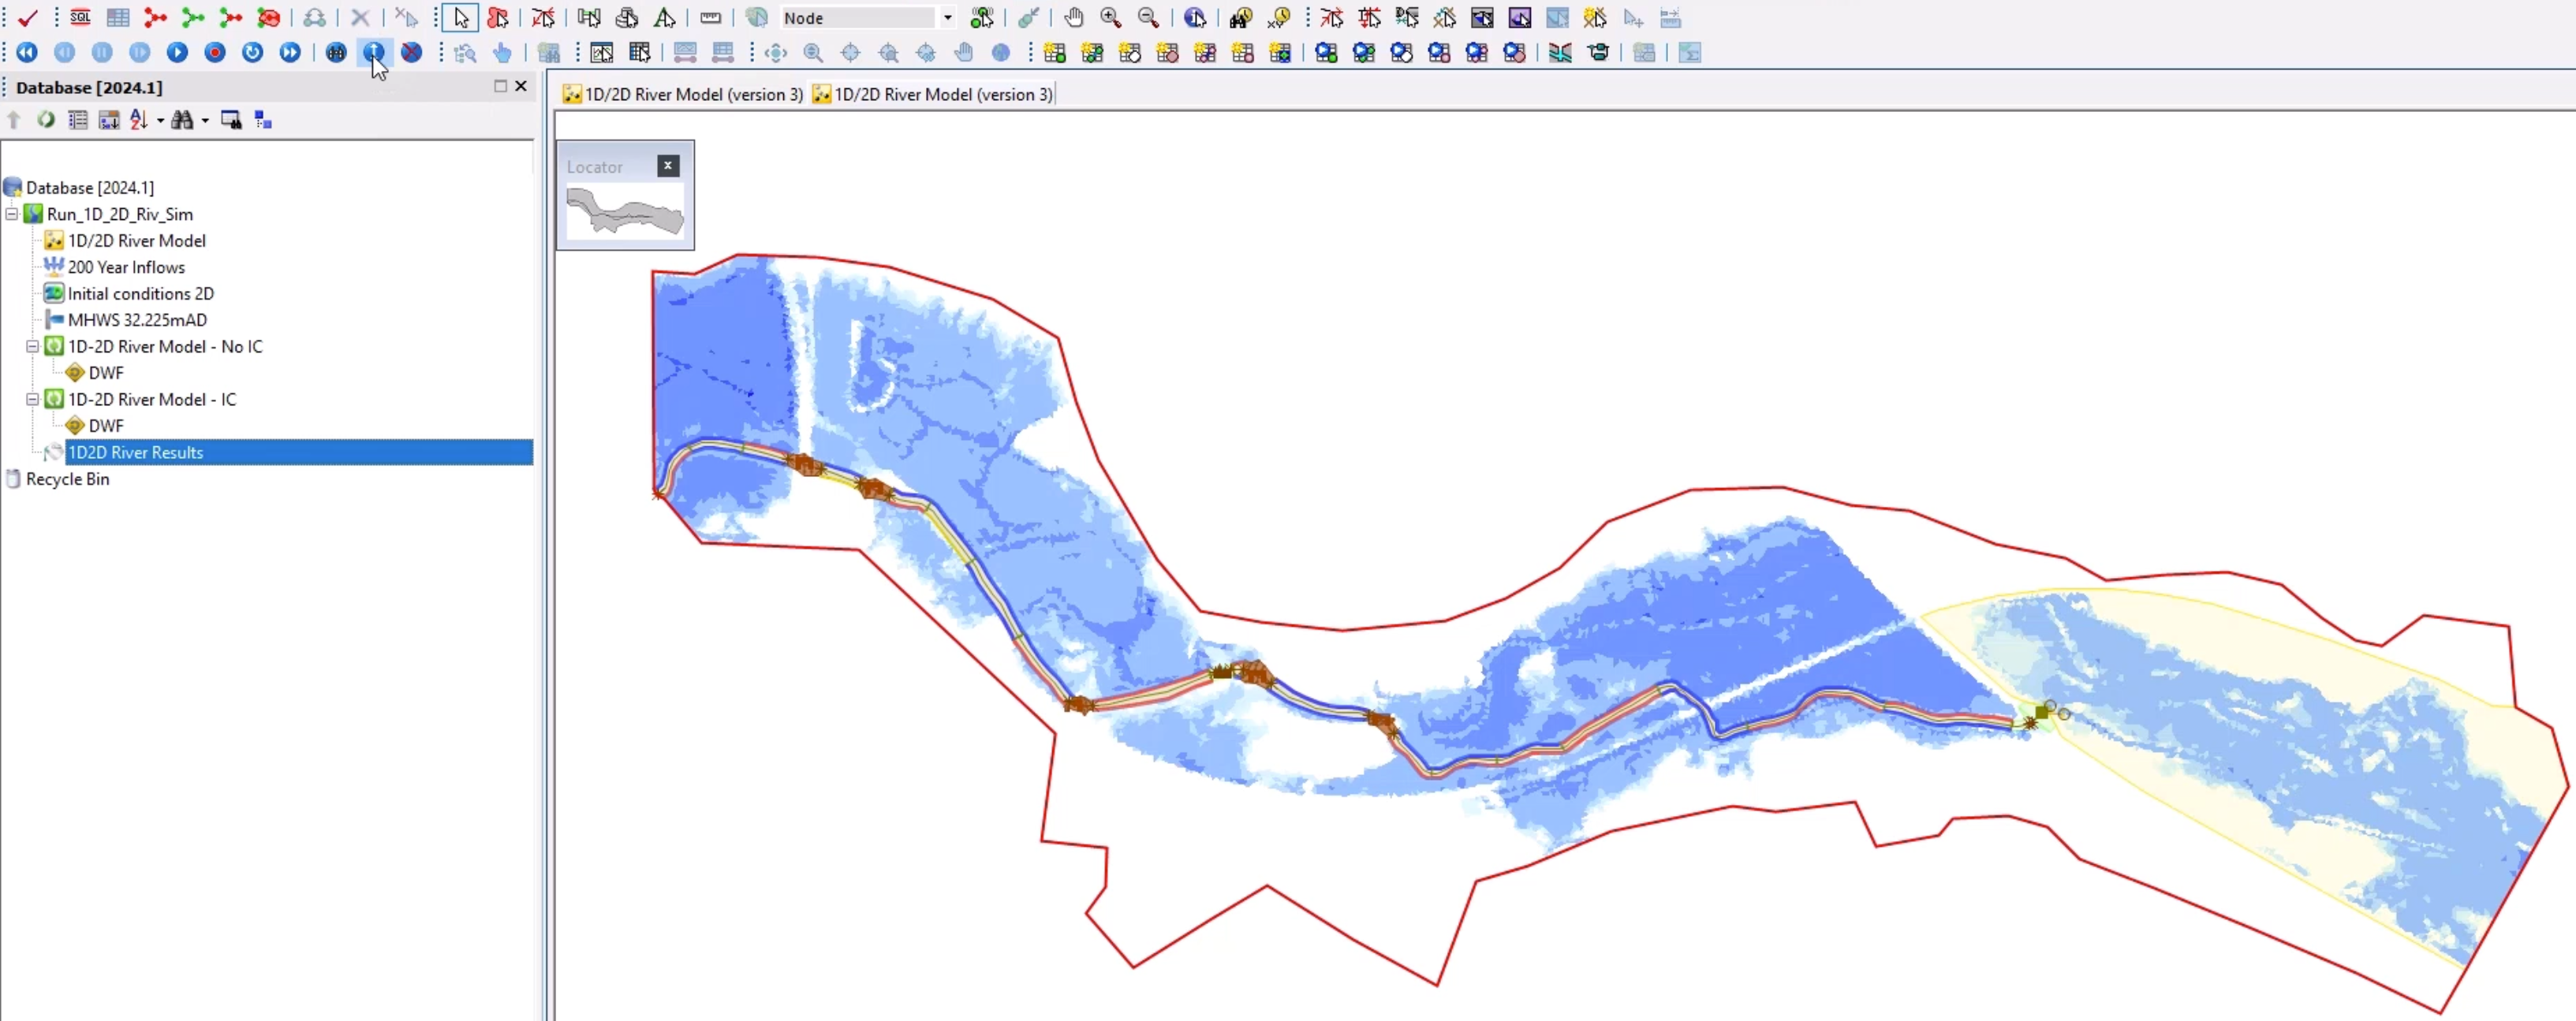
In the Database, double-click the result icon for 1D-2D River Model - No IC to open the simulation on the GeoPlan.
03:05
To help you visualize the results, drag the pre-saved 1D2D River Results theme from the Database onto the results.
03:15
If you need to adjust the theme, right-click the model results and select Properties & themes.
03:23
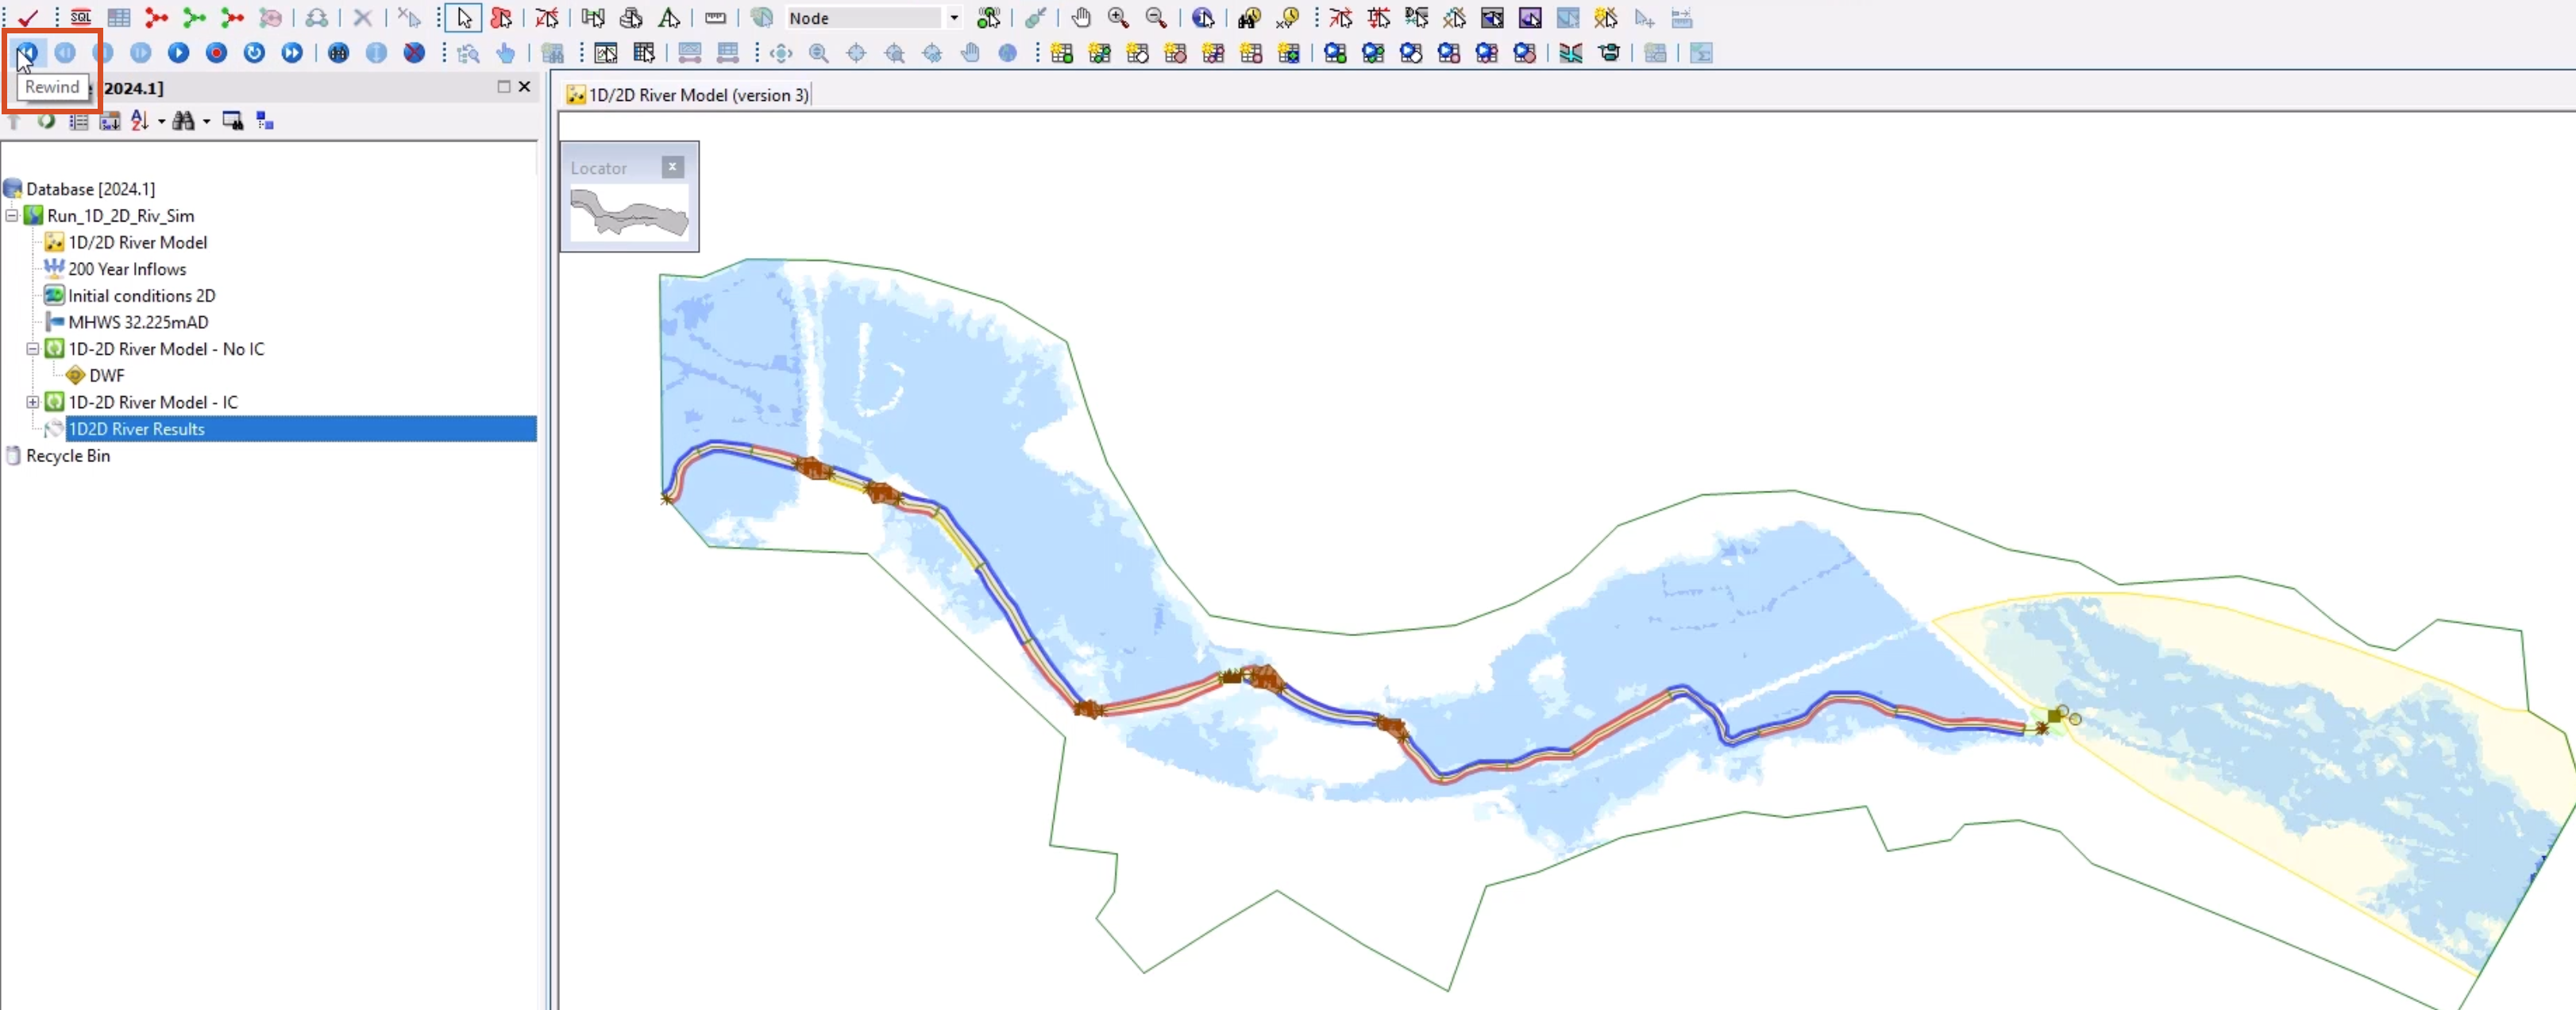
In the Replay Control toolbar, click Play to start the simulation.
03:29
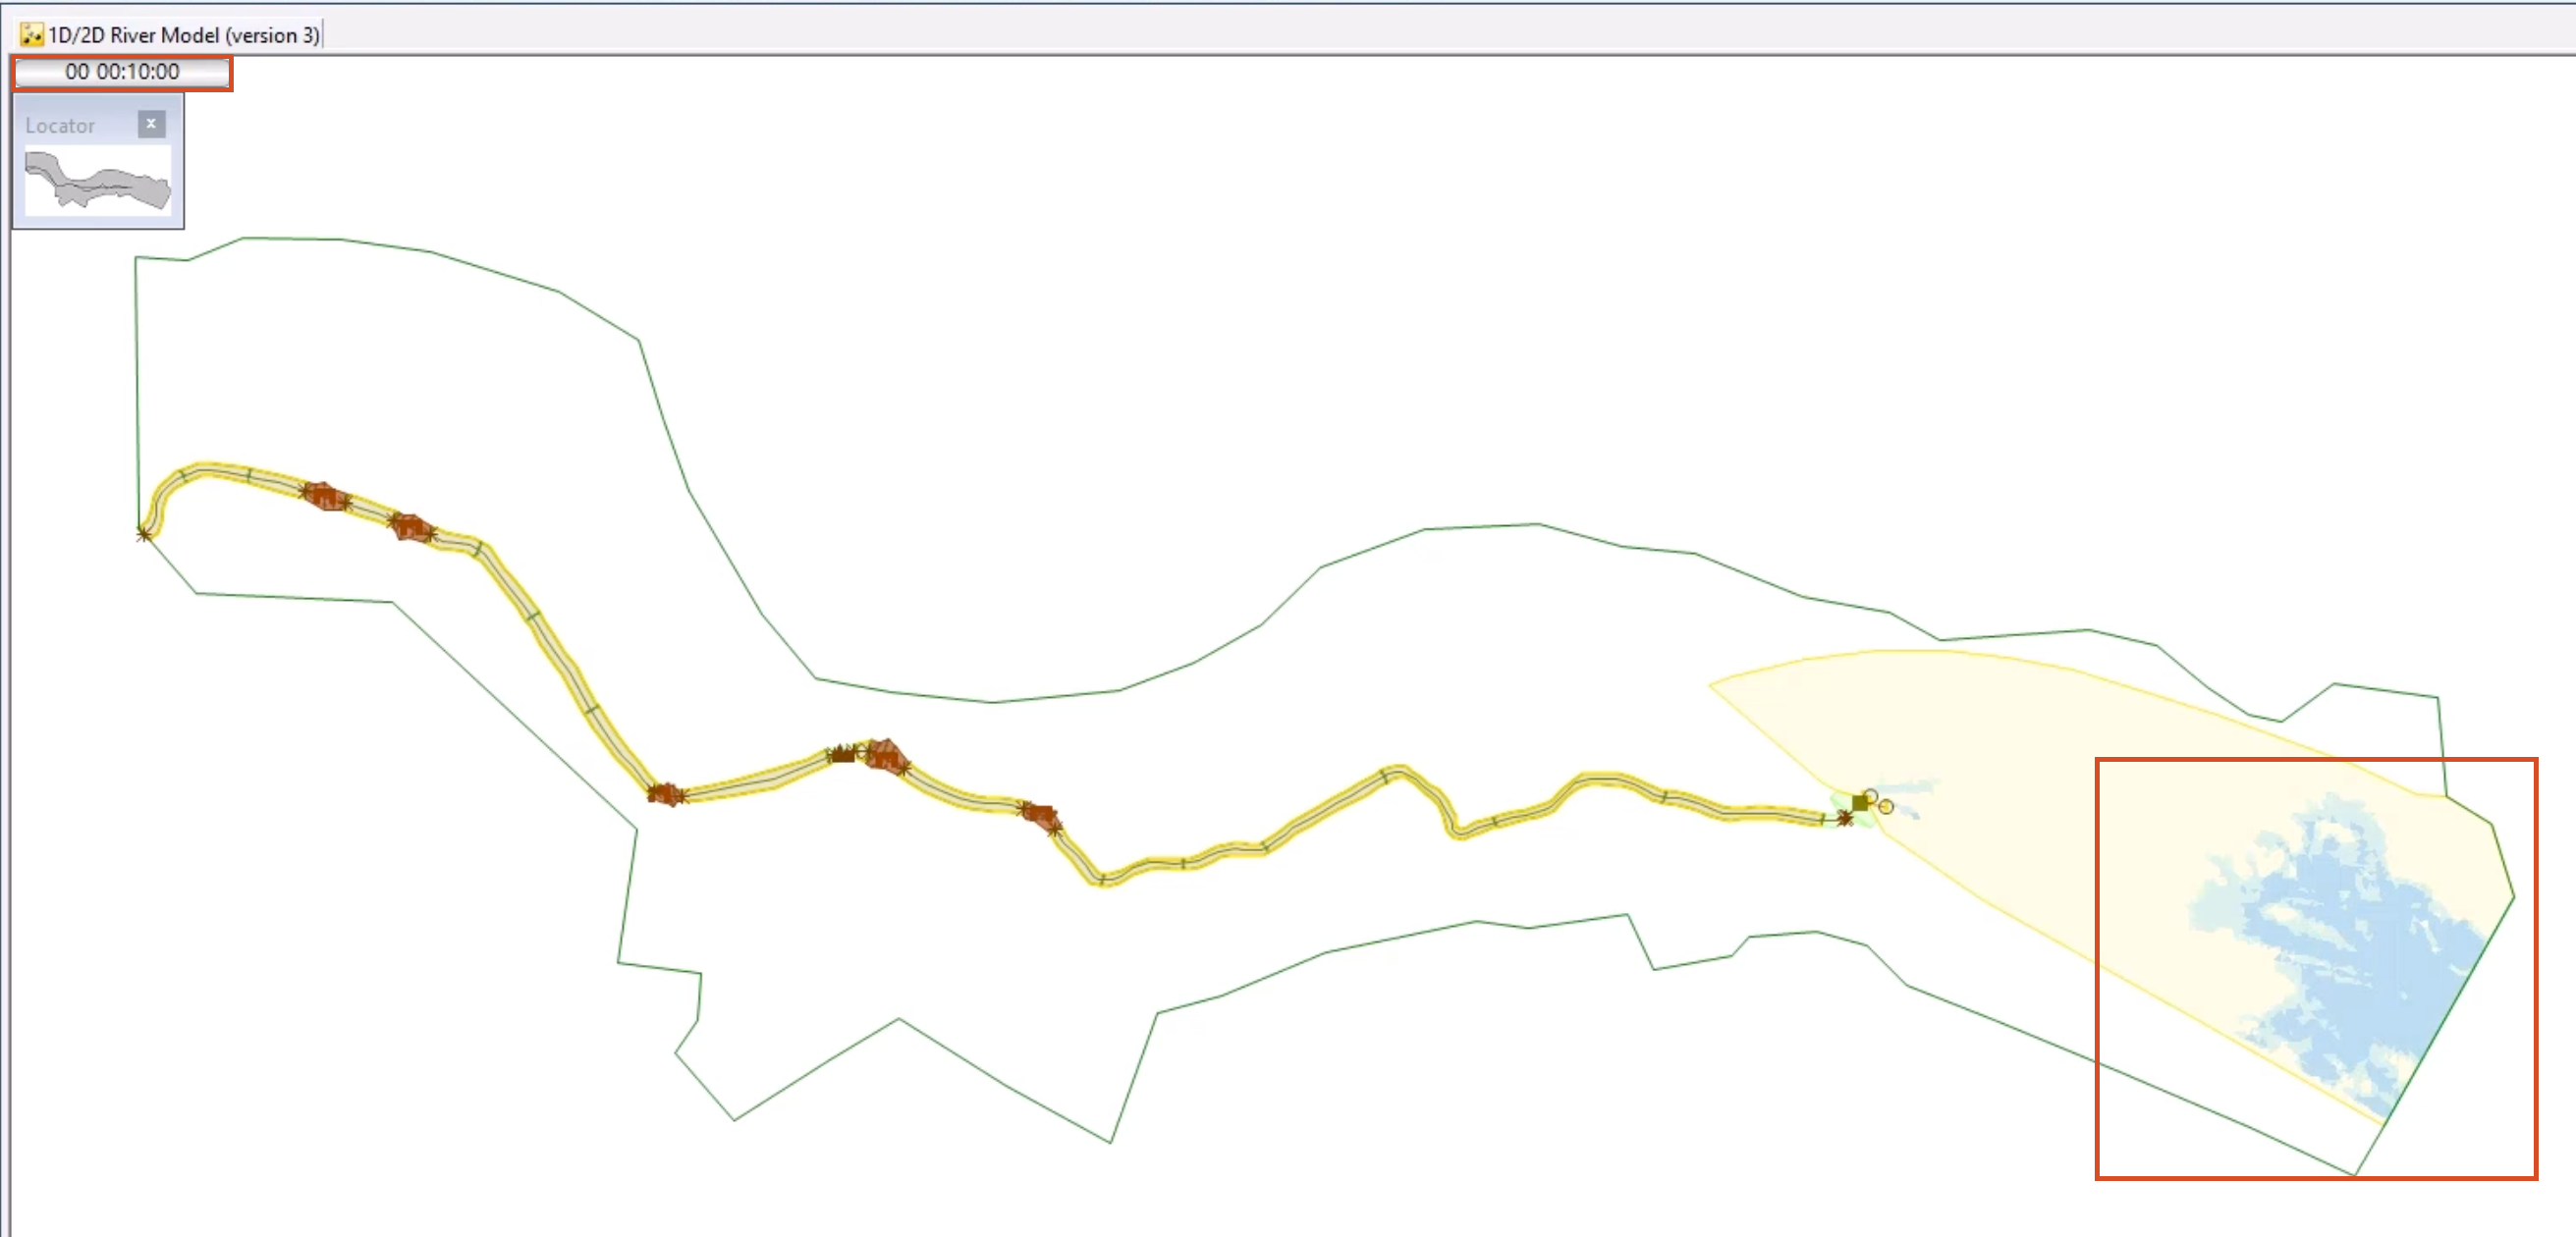
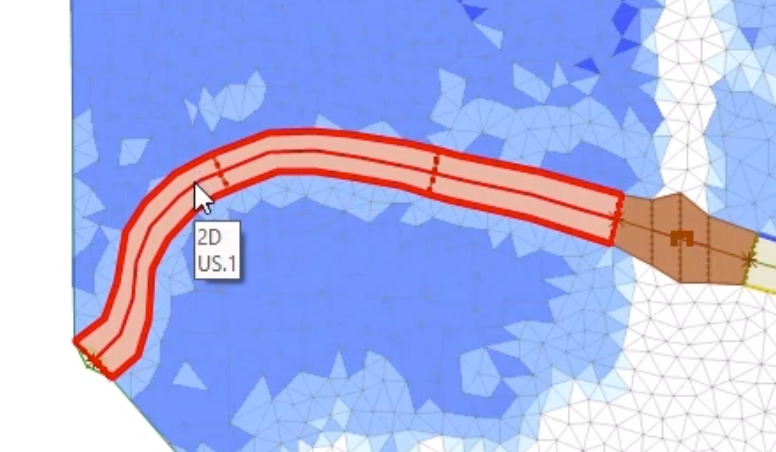
Notice that the flow starts immediately from the 2D boundary.
03:36
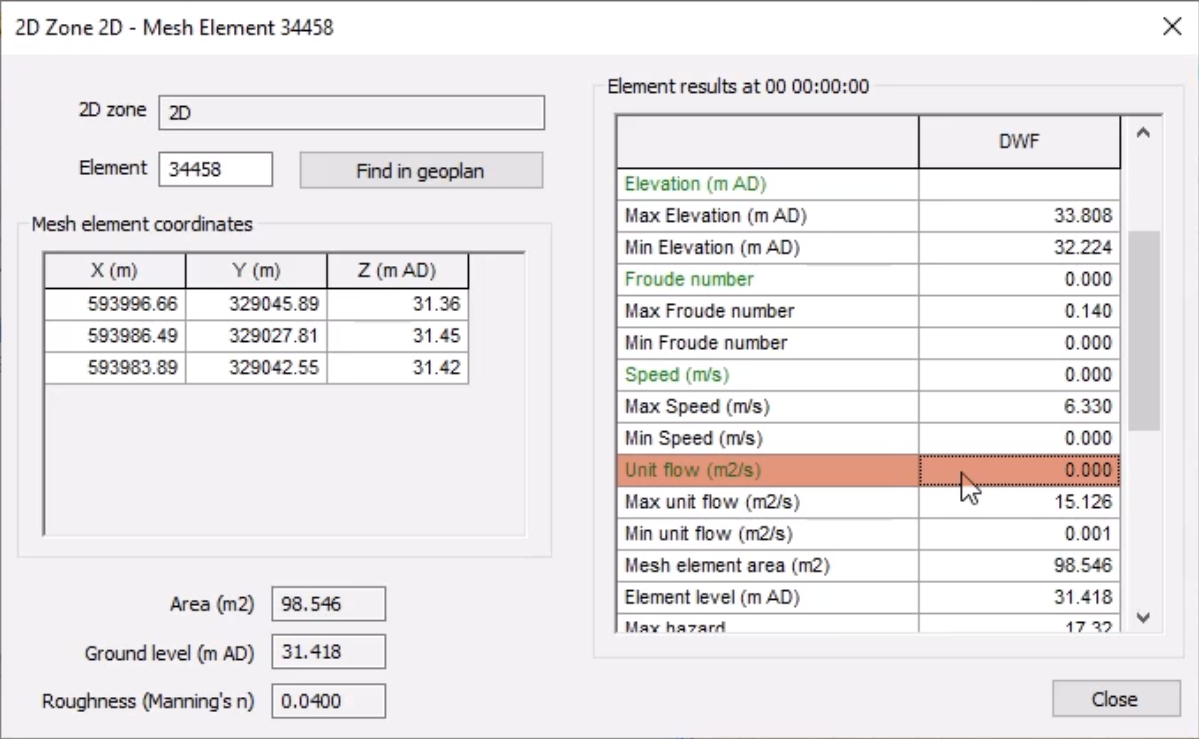
If you query one of the objects close to the boundary, you can see that the 2D mesh was dry when the simulation started.
03:45
The overall impact on this simulation is not significant as it takes around 1 hour to fill this area,
03:54
but it could be for other models, especially if the time to peak was much shorter
03:60
and there was a large volume that needed to be infilled.
04:04
Once the second simulation is complete, open the 1D-2D River Model - IC results.
04:12
Drag the 1D2D River Results theme onto the simulation.
04:18
Unlike the first simulation, within the IC zone, there is water simulated on the surface of the downstream section.
04:28
In the Replay Controls toolbar, select Show Maxima.
04:34
This theme has been set up to show whether the banks are flooding (red) or accepting flow (blue).
04:41
In the GeoPlan Tools toolbar, click Find in GeoPlan and perform a Quick Find for River Reach US.1.
04:52
Once located, Close the Quick Find window.
04:56
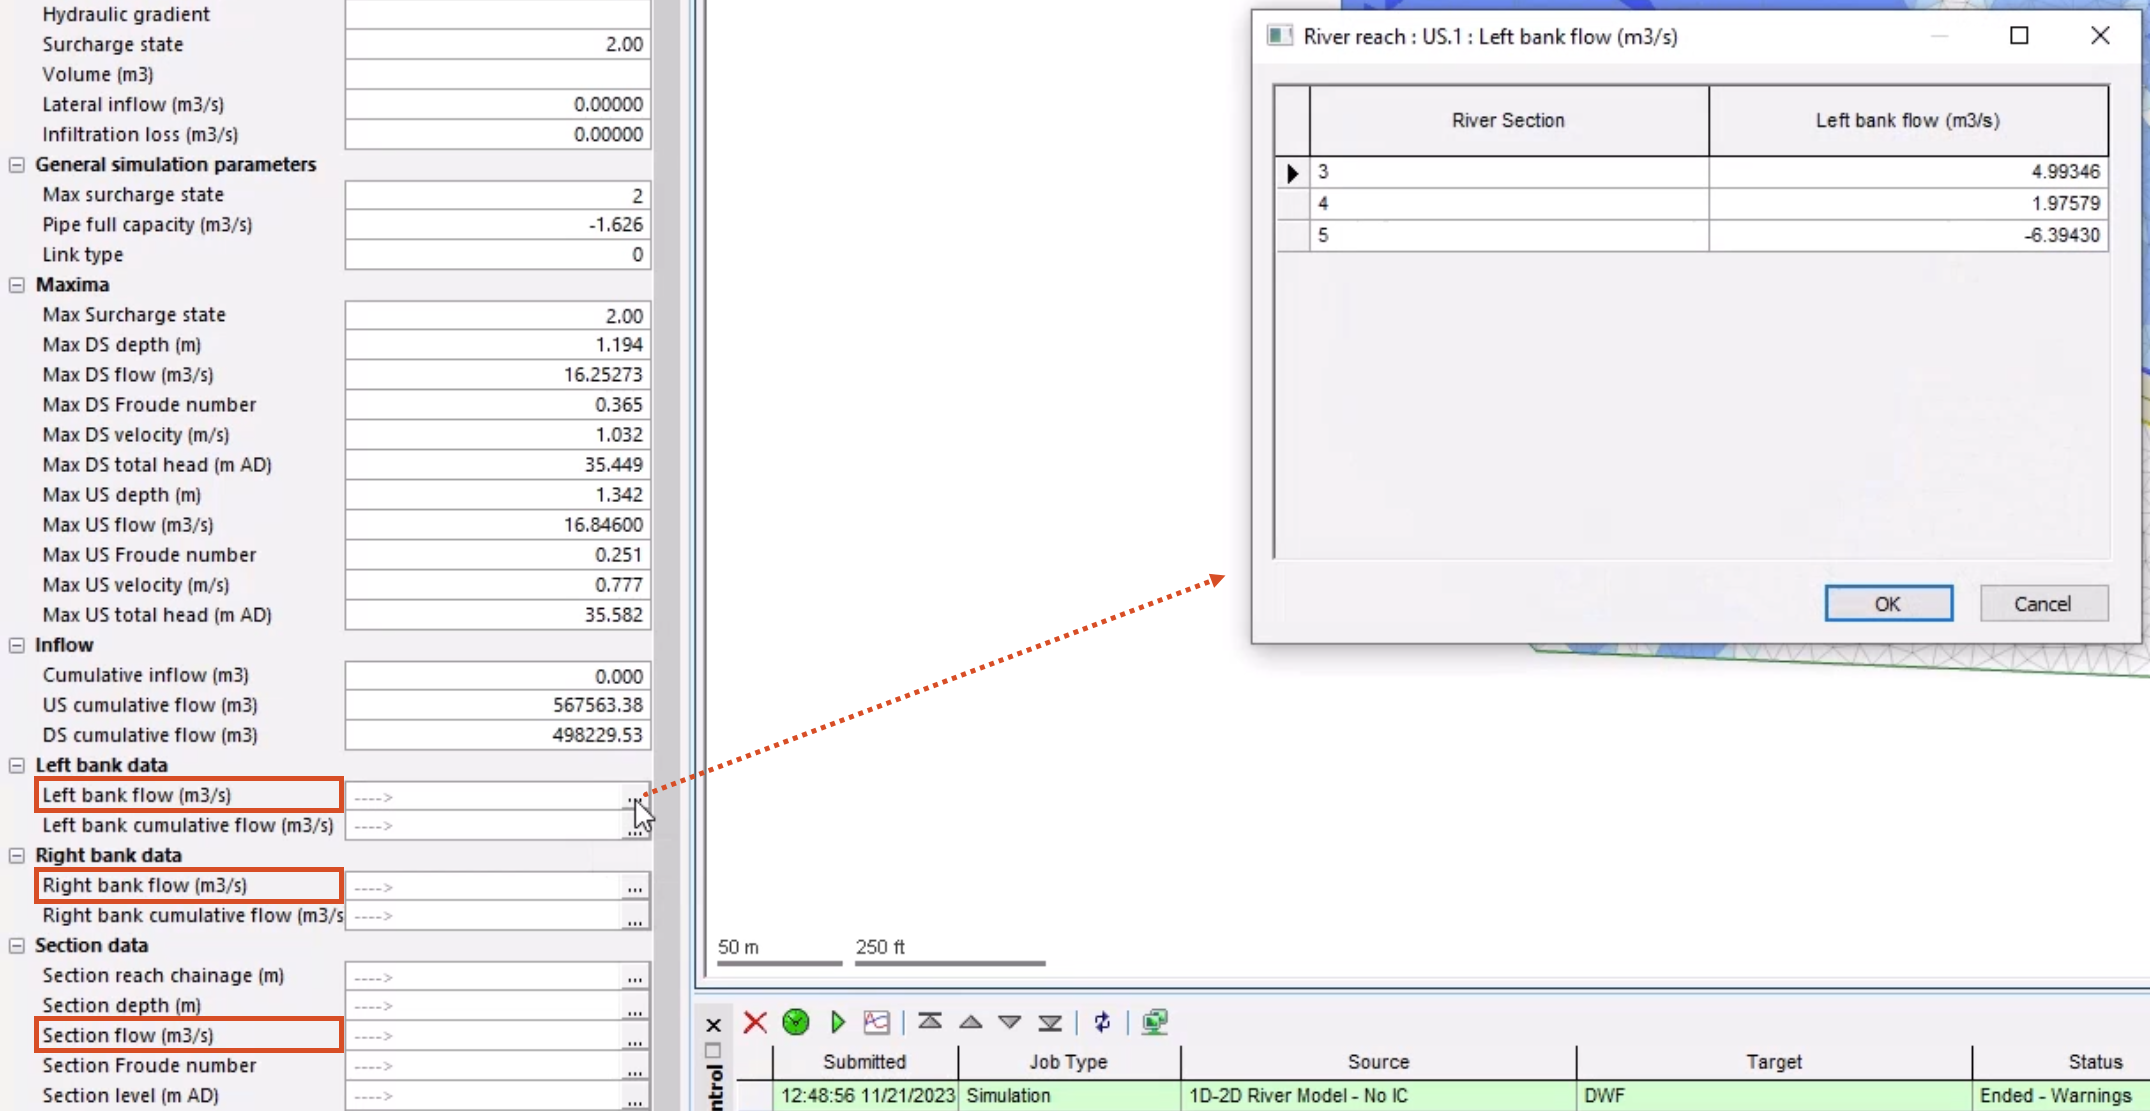
Select River Reach US.1 to open the Result Properties window.
05:02
For the Left bank data, Right bank data, and Section data fields, click More (…).
05:11
You can investigate this data to get a better idea of bank and section flow and flooding.
05:17
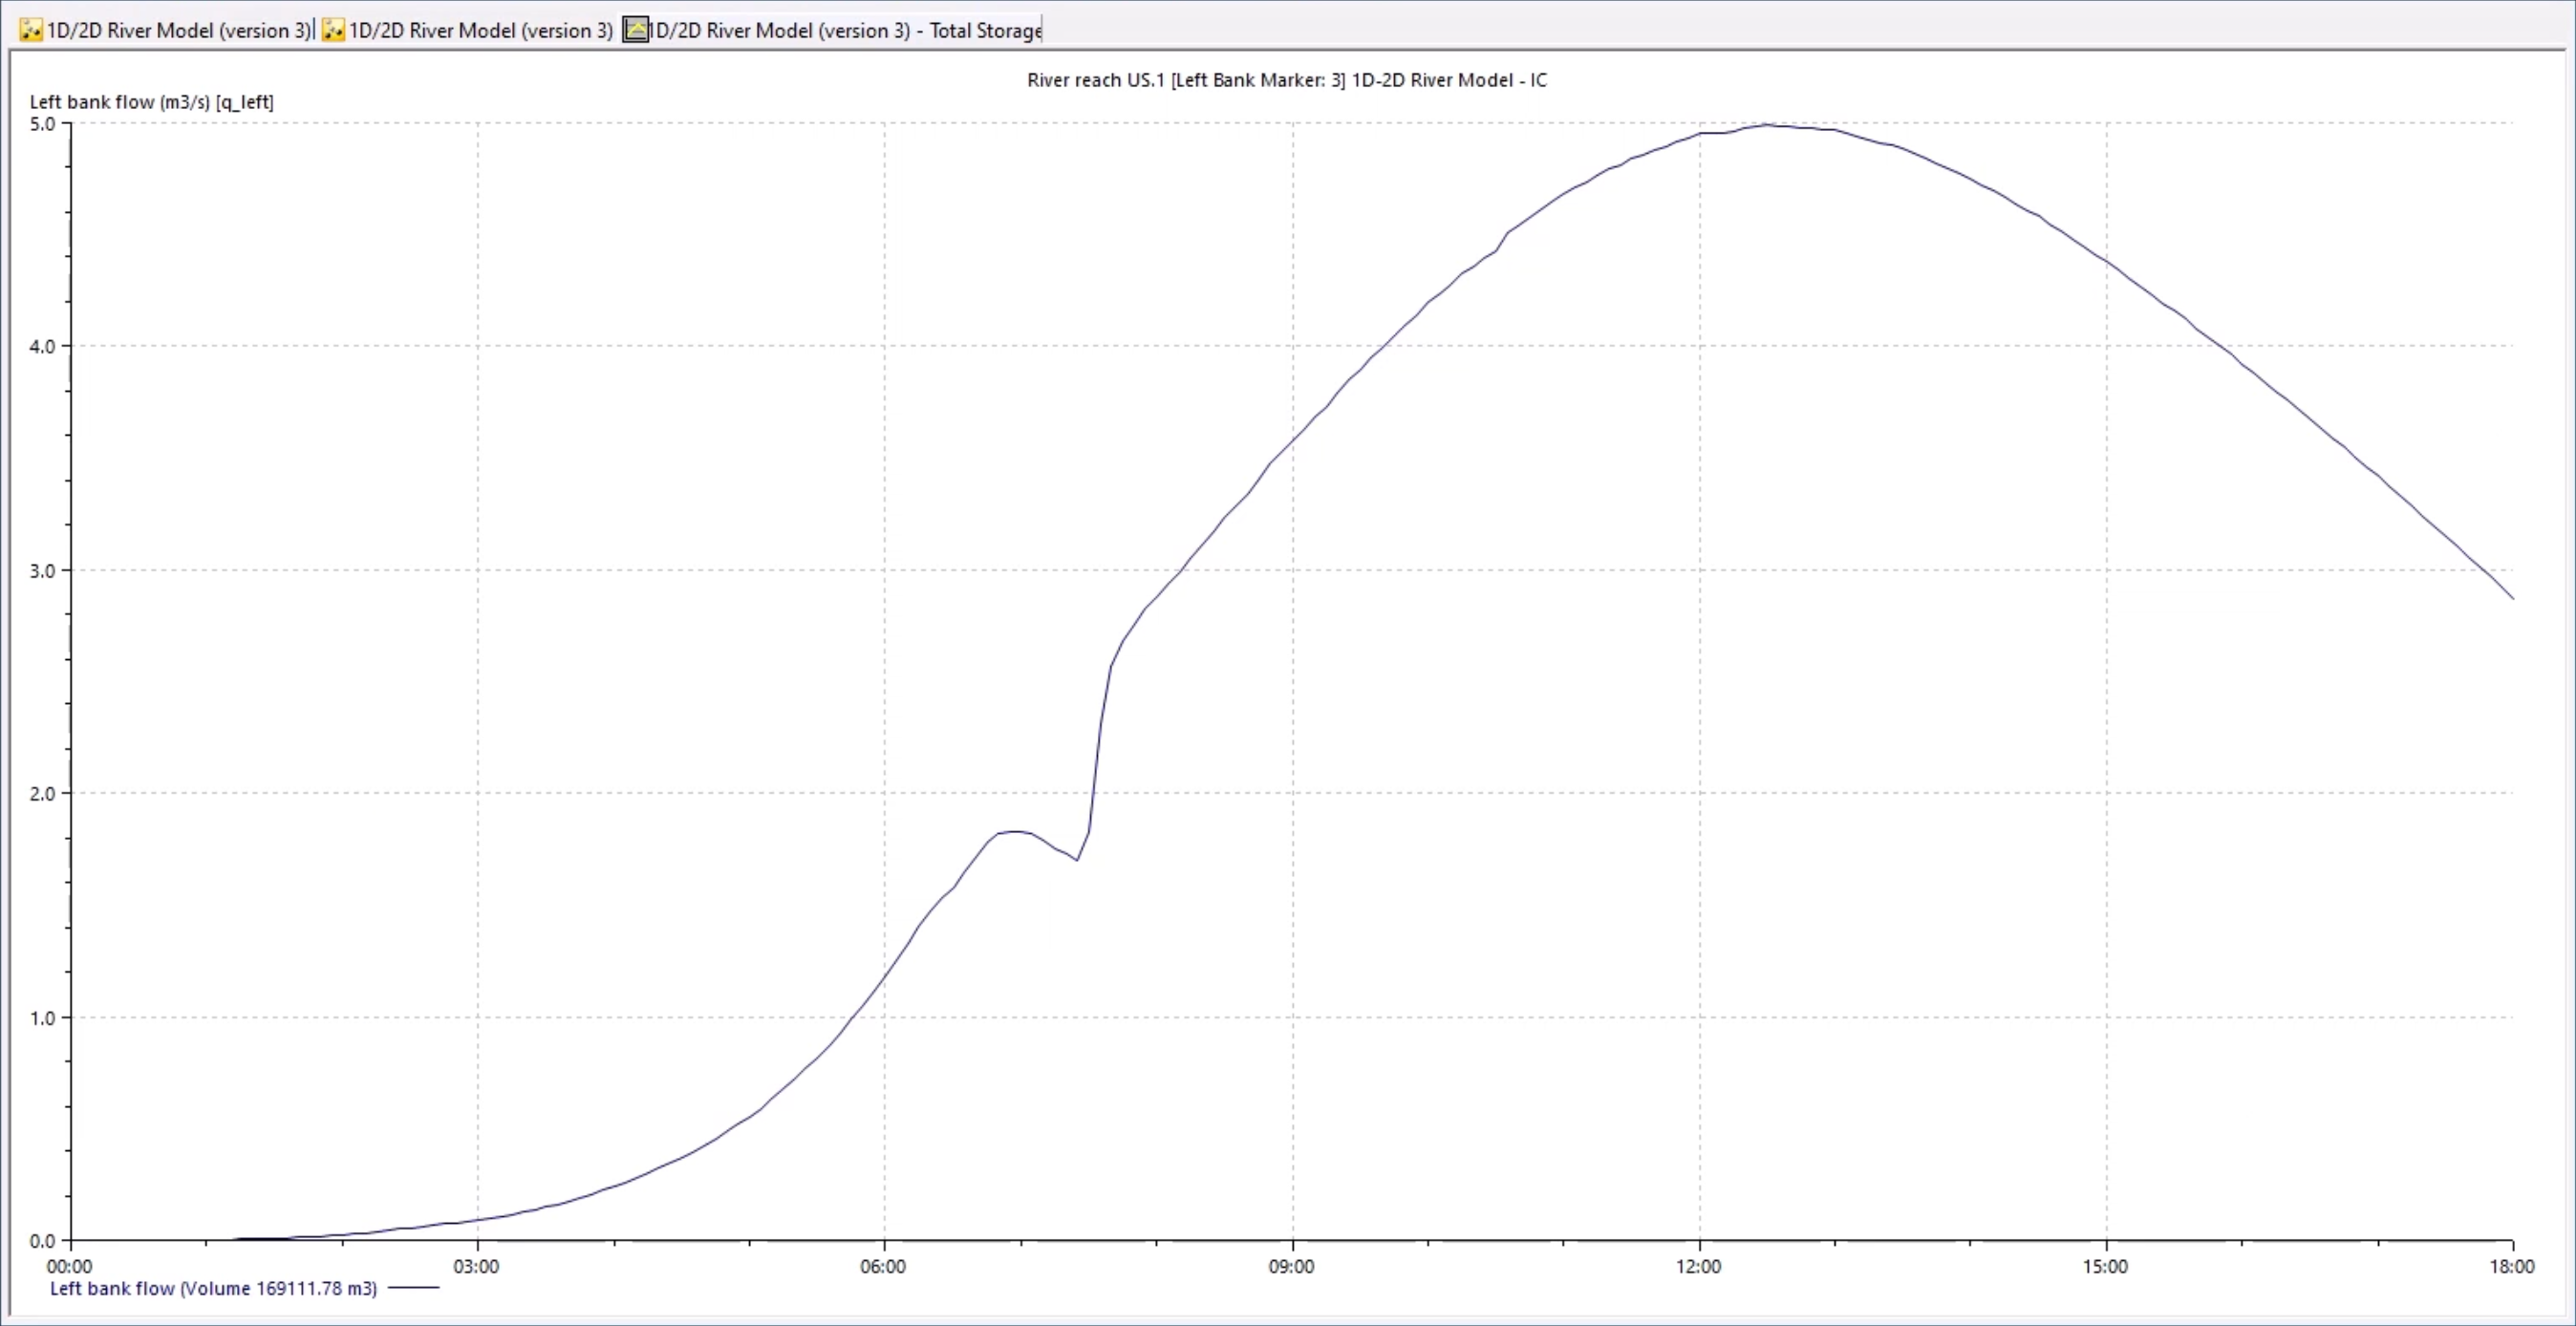
Use the pick graph tool to select one of the bank lines and graph the bank flow.
05:23
Each section of the river reach bank can be graphed individually.
05:28
It provides a summation of the flow across all the element-bank face connections.