00:03
Themes allow you to display particular parameters graphically on the GeoPlan window
00:09
and are a powerful way to display simulation results visually.
00:13
In this tutorial, you set up some themes to make viewing the model easier, and to present some basic simulation results.
00:22
To complete this exercise, copy the data out of the transportable database .icmt file for this tutorial.
00:31
You build up a results theme in the same way that you use object properties fields, but when you have a set of results open,
00:39
the results fields for that simulation become active.
00:43
Note that you can only edit a results theme using an active set of results,
00:48
and the set of results that you are using should be appropriate for the theme that you are trying to generate.
00:54
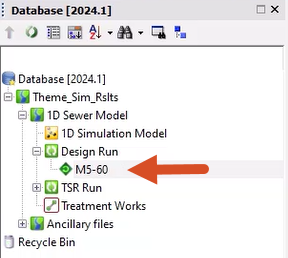
In the Model Group, double-click the Design Run simulation to open the results in a GeoPlan window.
01:03
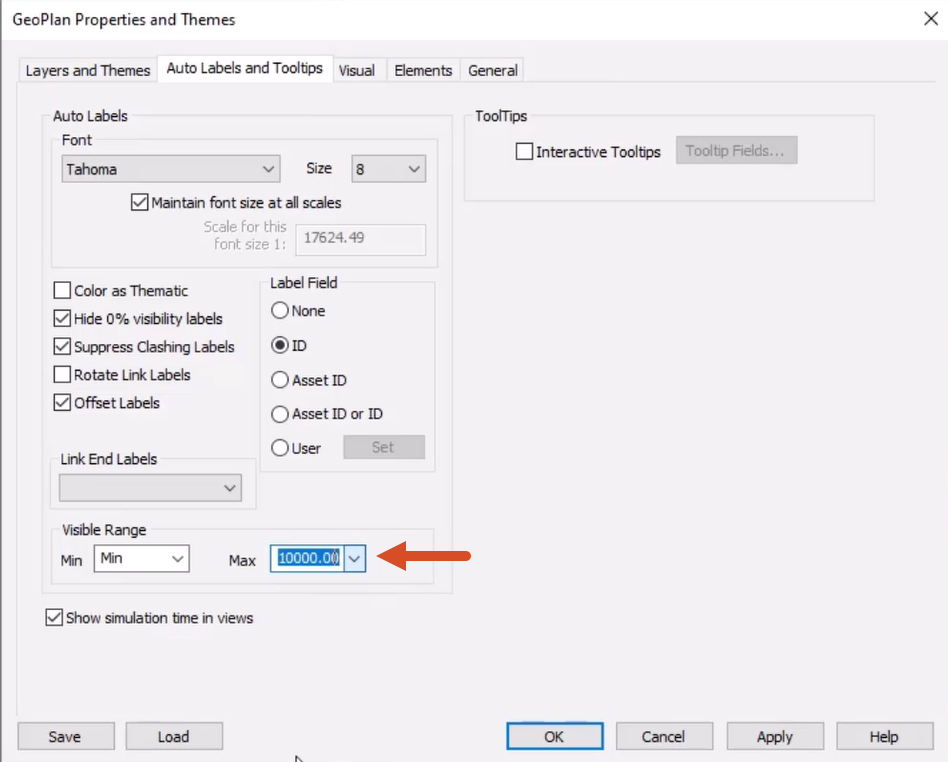
Right-click the GeoPlan and select Properties & Themes to open the GeoPlan Properties and Themes dialog.
01:11
To help you view your results theme, on the Auto Labels and Tooltips tab, in the Visible Range section, set the Max to 1000.00.
01:25
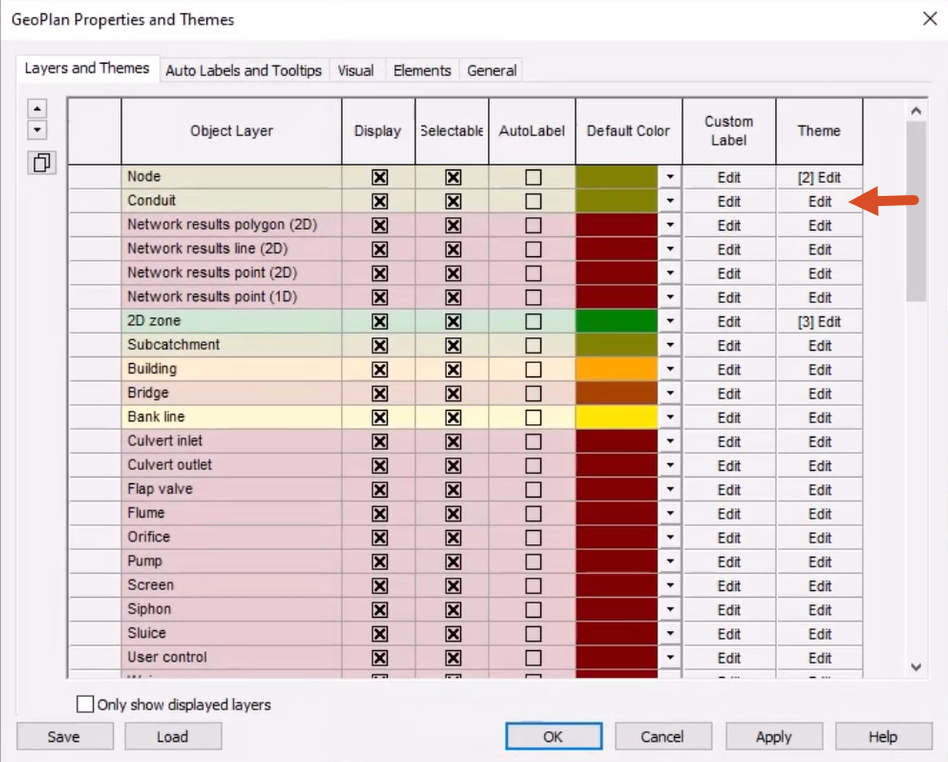
On the Layers and Themes tab, in the Conduit row, click Edit.
01:33
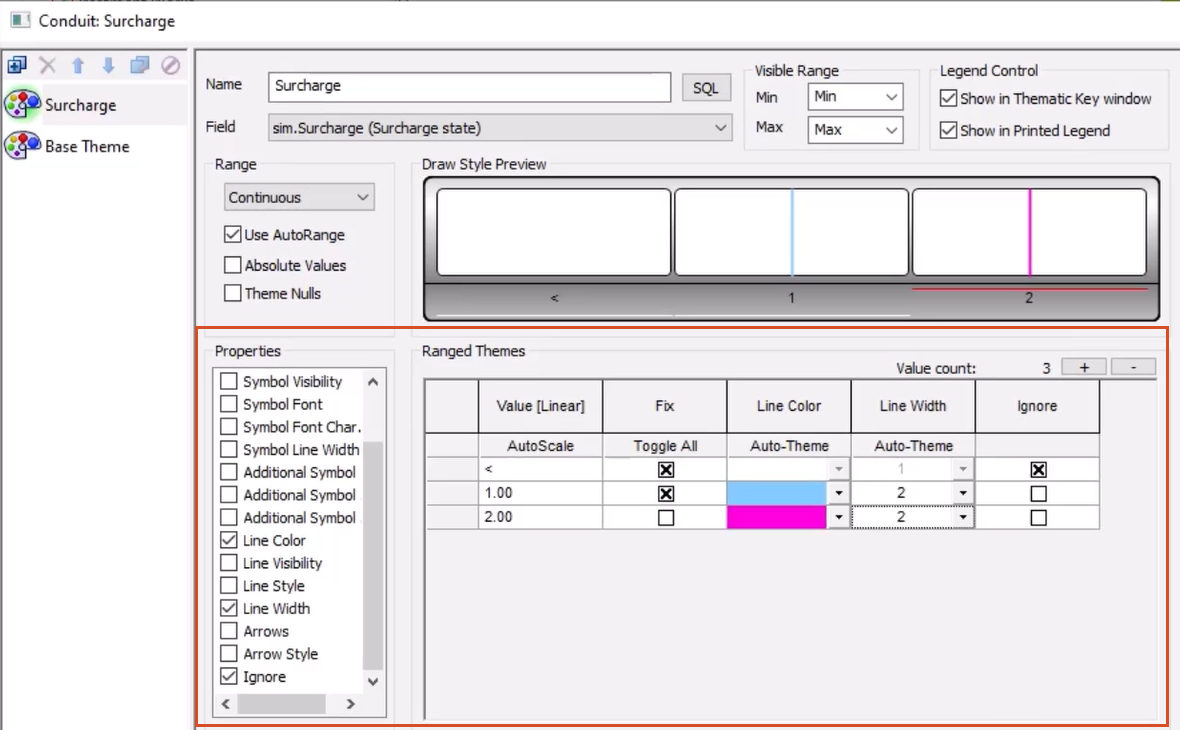
For this theme, you use simple raw results data to identify conduits that are surcharged.
01:41
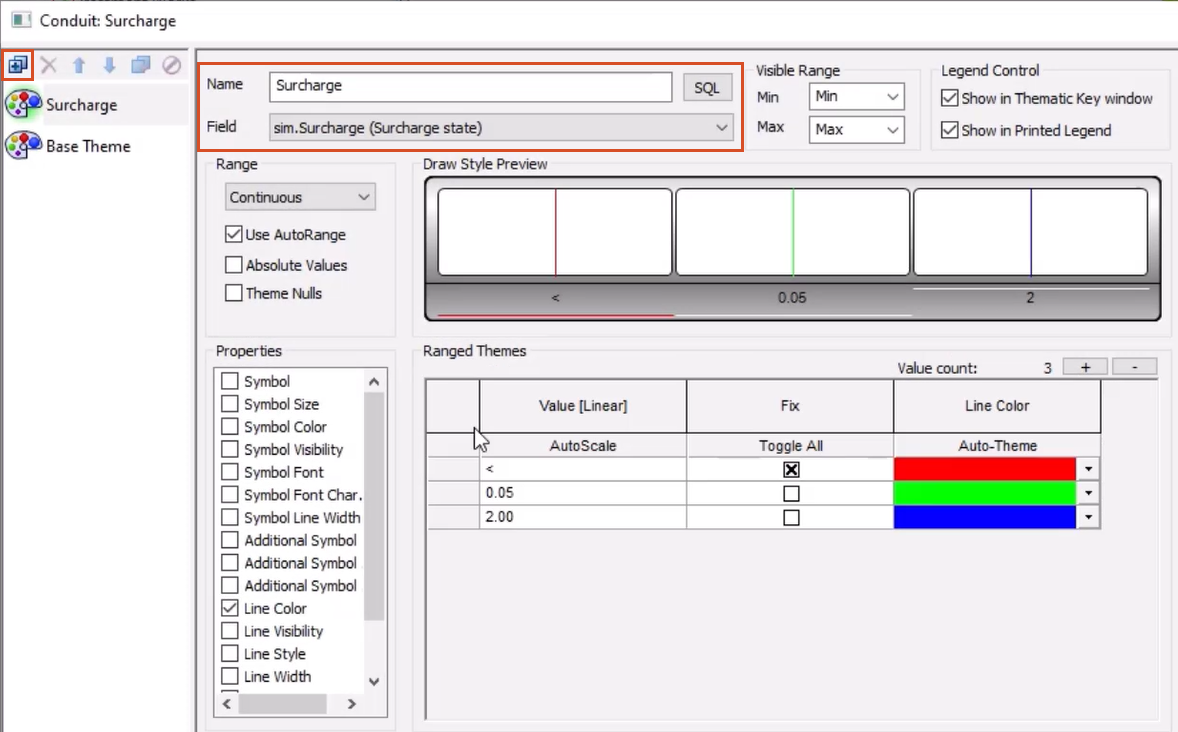
In the Name field, enter “Surcharge”.
01:44
In the Field drop-down, select sim.Surcharge (Surcharge state).
01:49
The data is auto-populated into the Ranged Themes section.
01:54
You can change the display of this data.
01:57
In the Properties list, leave Line Color enabled, and select Line Width and Ignore.
02:05
Under Ranged Themes, set up the rows as follows:
02:10
Row 1: Enable Ignore
02:14
Row 2: Value 1.00, Fix toggled, Line Color Light Blue, Line Width 2
02:28
Row 3: Value 2.00, Fix untoggled, Line Color Hot Pink, Line Width 2
02:40
Click Apply and then OK to return to the GeoPlan Properties and Themes dialog.
02:46
To make it easier to view the results, in the Subcatchment row, disable Display.
02:54
Click OK to close the GeoPlan Properties and Themes dialog.
02:60
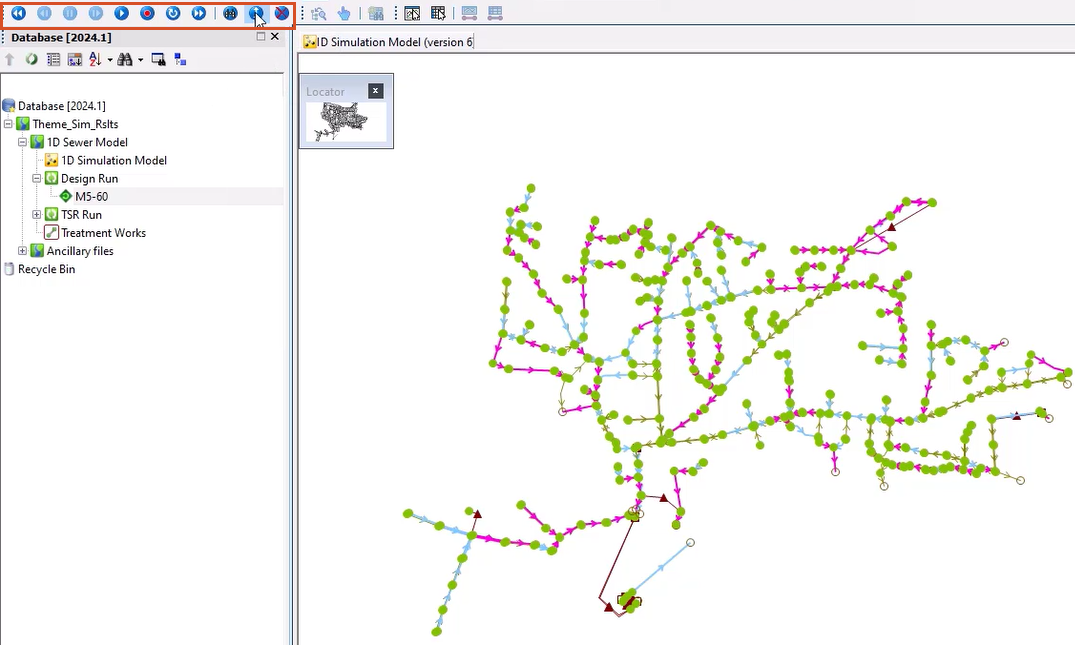
Use the Replay Control toolbar to play through the simulation and see the surcharge theme applied to the conduit links.
03:08
Click Show maxima to display the maximum results for all locations at once.
03:14
You can now set up your second theme for flooding nodes.
03:18
Right-click on the GeoPlan and select Properties & Themes.
03:23
On the Layers and Themes tab, for the Nodes object layer, enable AutoLabel.
03:30
This helps identify particular flooding nodes.
03:34
In the Theme column for the Node object layer, click Edit to access the themes for nodes.
03:41
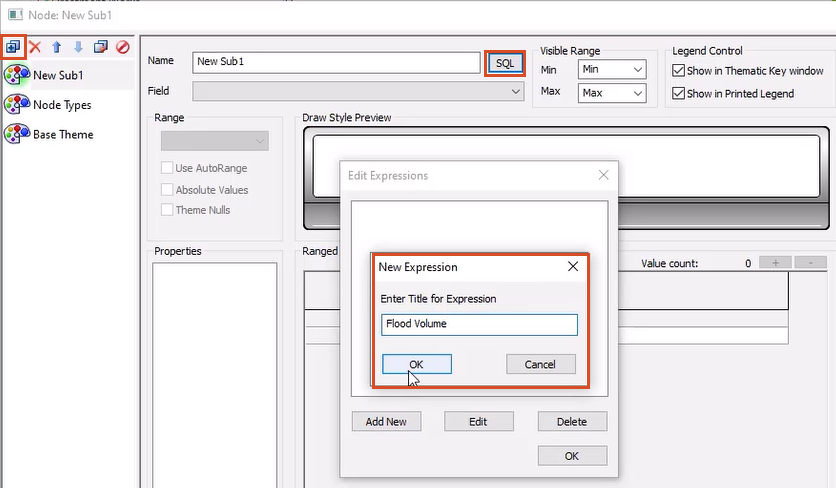
In the Layer Theme Editor, click the Add New button.
03:46
In this exercise, you want to add a theme to sum both the stored and lost flood volumes so they can be seen collectively.
03:55
Click SQL to create an expression, and in the Edit Expressions popup, click Add New.
04:03
In the New Expression dialog, enter the name “Flood Volume”, then click OK.
04:10
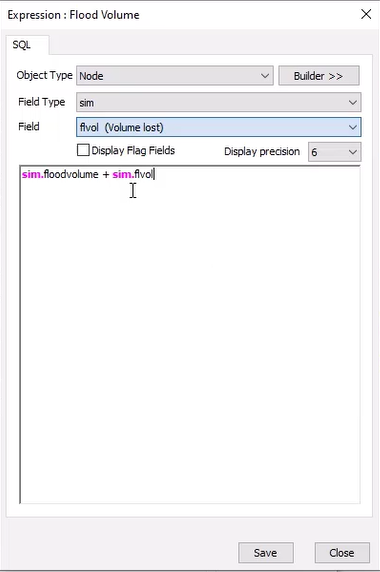
Now build the query.
04:13
Set the Object Type to Node and the Field Type to sim.
04:18
Expand the Field drop-down and select floodvolume.
04:22
In the query, type a SPACE, a plus sign (+), and then another SPACE.
04:29
Finally, from the Field drop-down, select flvol (volume lost).
04:34
Your query should look like this: sim.floodvolume + sim.flvol
04:44
Click Save, and then Close.
04:47
You can see your new query in the Edit Expressions popup.
04:53
The query is applied, but you can change how the results are displayed.
04:58
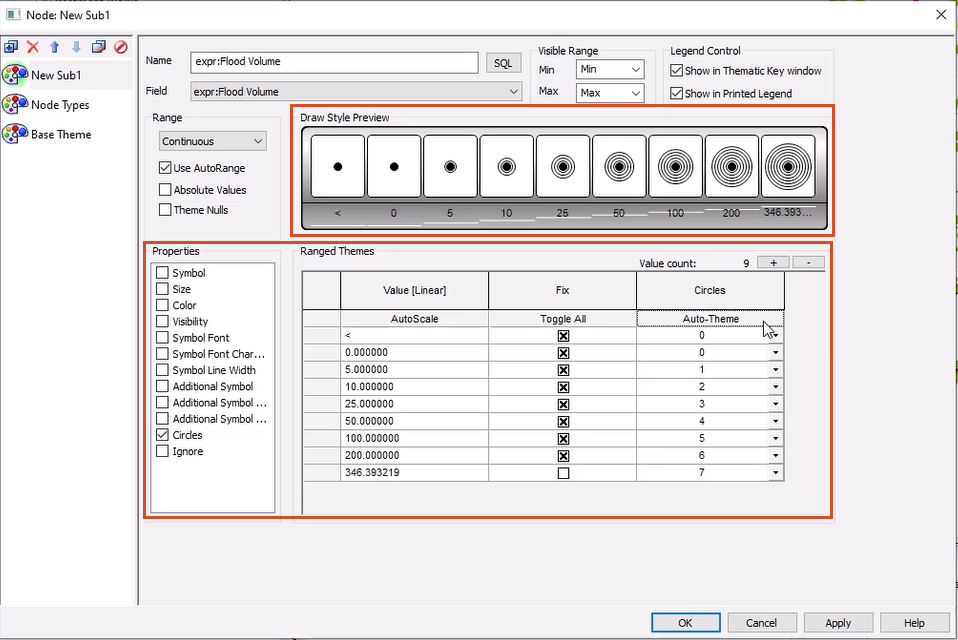
In the Layer Theme Editor, in the Properties list, deselect Colour and select Circles.
05:05
In the Ranged Themes section, click the Value count plus symbol (+) until you have 9 rows.
05:12
In the Value [Linear] column, leave the first and last values as they are, and set rows 2 to 8 to 0, 5, 10, 25, 50, 100, and 200, respectively.
05:27
In the Fix column, click Toggle All, and then deselect the box in the last row.
05:34
In the Circles column, set the last row to 7, and then click the Auto-Theme button.
05:41
In the Draw Style Preview section, you can see a preview of the circles with the values at which they will be applied.
05:52
You can save these themes for future use.
05:55
Click Save, and then in the Network editing properties - save options popup, click OK.
06:02
Enter a descriptive name, such as “1D Results” and select a location in the database to save the themes.
06:10
Click Save, and then OK to save all the properties.
06:16
These themes are now available to re-use with any simulation.
06:20
Click OK to close the GeoPlan Properties and Themes dialog.
06:26
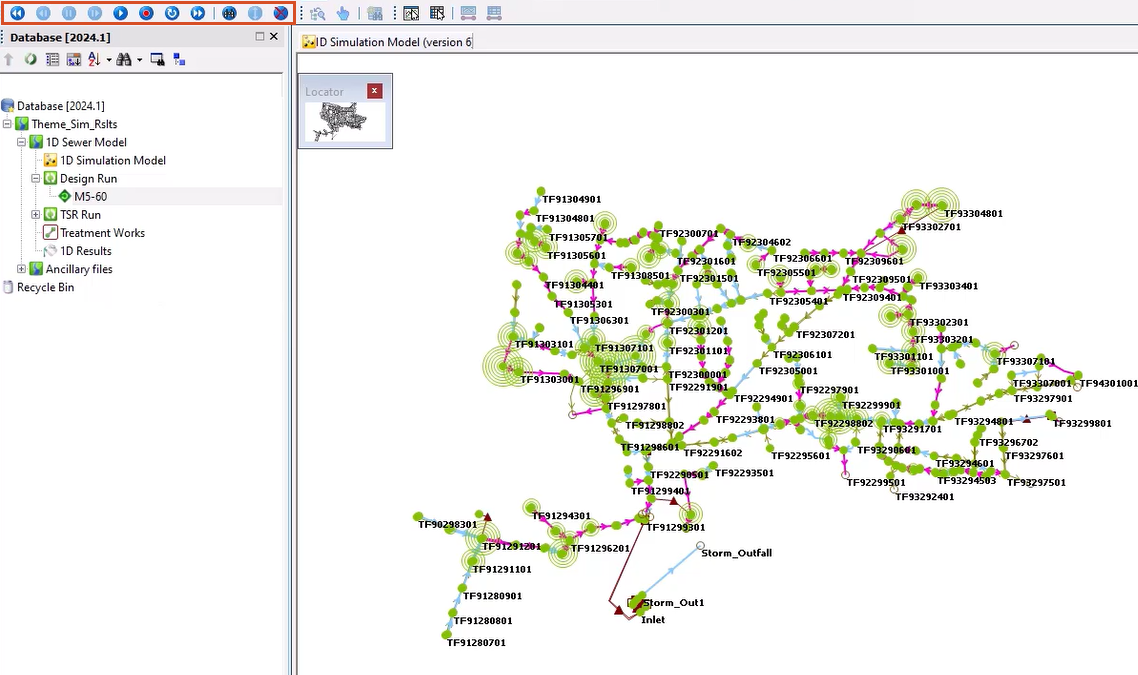
Back in the GeoPlan, you can now see that the flooding manholes have concentric circles around them
06:32
which indicates the volume of flooding that occurs.
06:35
Use the Replay Control toolbar to play through the simulation to see the movement of flooding through the 1D network.
06:43
Click Show maxima to display the maximum results for all locations at once.