00:03
With a set of results loaded onto the GeoPlan,
00:06
you can use 2D results analysis objects to interrogate larger groups of elements within a 2D mesh.
00:21
can be extremely useful for high-level results investigations.
00:25
Once created, results analysis objects can be saved as results analysis items for use on different sets of results.
00:34
The calculations are undertaken using the time-varying element results, so they should be used with caution.
00:40
For accurate results, especially relating to flows,
00:44
the Network results objects (2d) should be used but these must be built into the mesh prior to simulation.
00:51
To start, from the File menu, select Open>Open transportable database.
00:57
Open the folder where you downloaded the files for this exercise and select the .icmt file.
01:05
If a popup displays about opening the database as read-only, click Yes.
01:10
Right-click the top-level folder and select Copy.
01:14
When the pop-up displays, click Continue.
01:17
In the Explorer window, right-click the Database and select Paste (with children).
01:23
In the Copying pop-up, enable Copy simulation results.
01:29
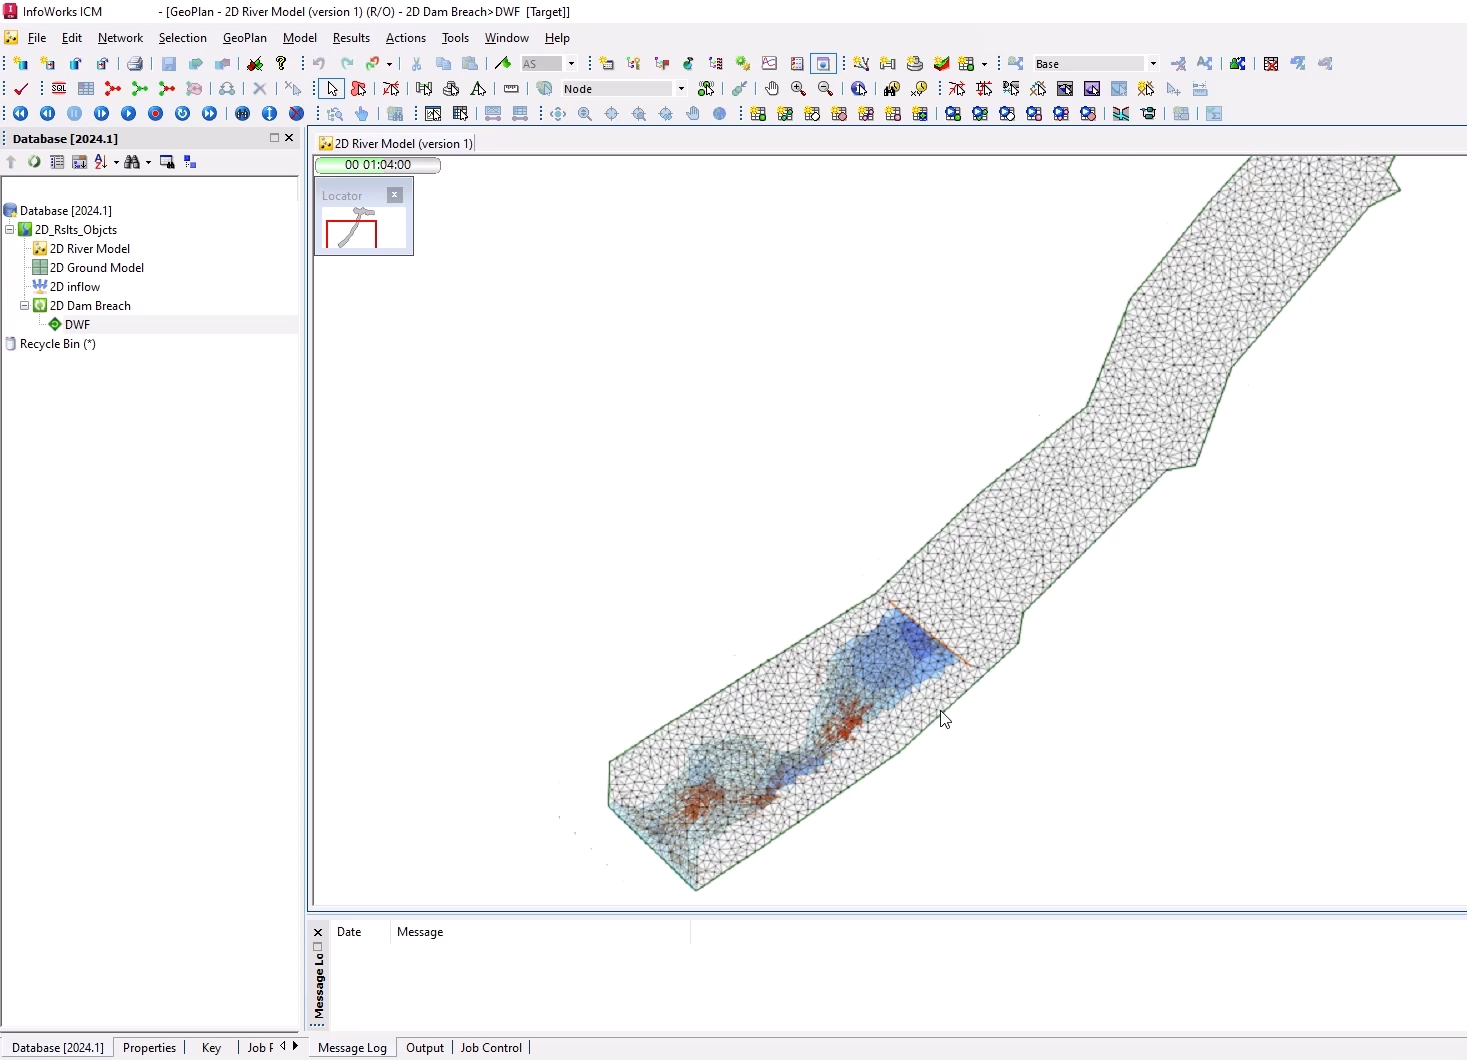
Open 2D Dam Breach on the GeoPlan, to ensure the model opens with the simulation results applied.
01:35
Progress the simulation to the point before the structure fails, and then zoom into that area.
01:42
First, create a 2D results polygon.
01:46
In the GeoPlan Tools toolbar, expand the New Object Type drop-down and select Polygon.
01:53
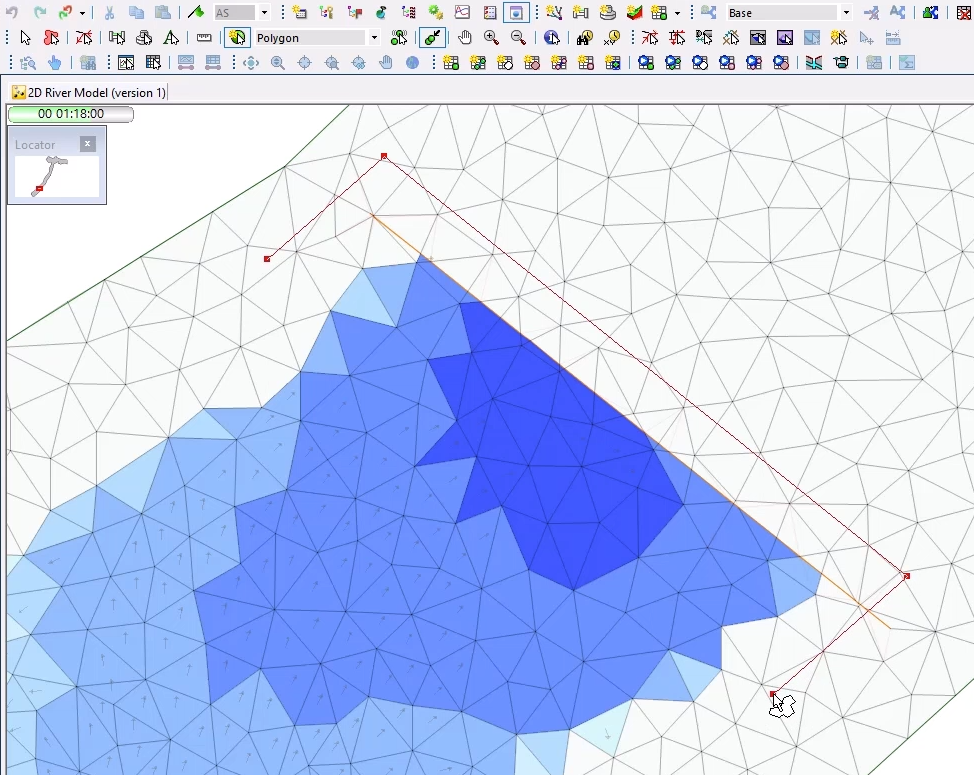
Click New Object. If needed, zoom out for a clear view of the water approaching the dam.
01:58
Right click to create a polygon around an area of the water and the dam.
02:03
Double-click to close the polygon.
02:07
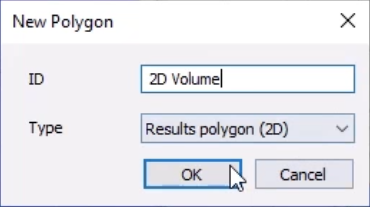
In the New Polygon dialog, ID field, type “2D Volume”, and then click OK.
02:14
The polygon you created now appears highlighted.
02:17
Next, create a results section.
02:19
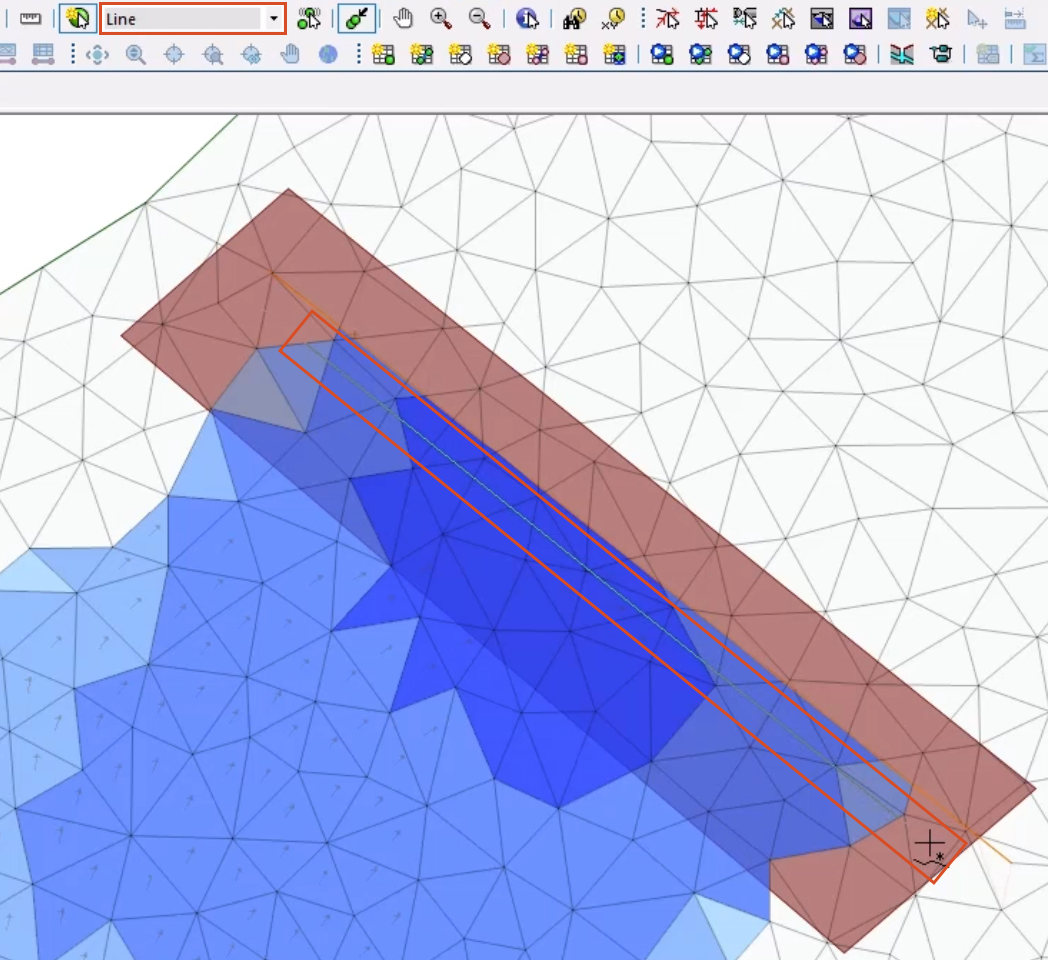
In the New Object Type drop-down, select Line,
02:23
and then draw a line along the dam on the upstream side.
02:29
In the New Line dialog, in the Name field, type “2D Collapse”, and then click OK.
02:35
Now, you can use some of the graphing tools to look at the results.
02:39
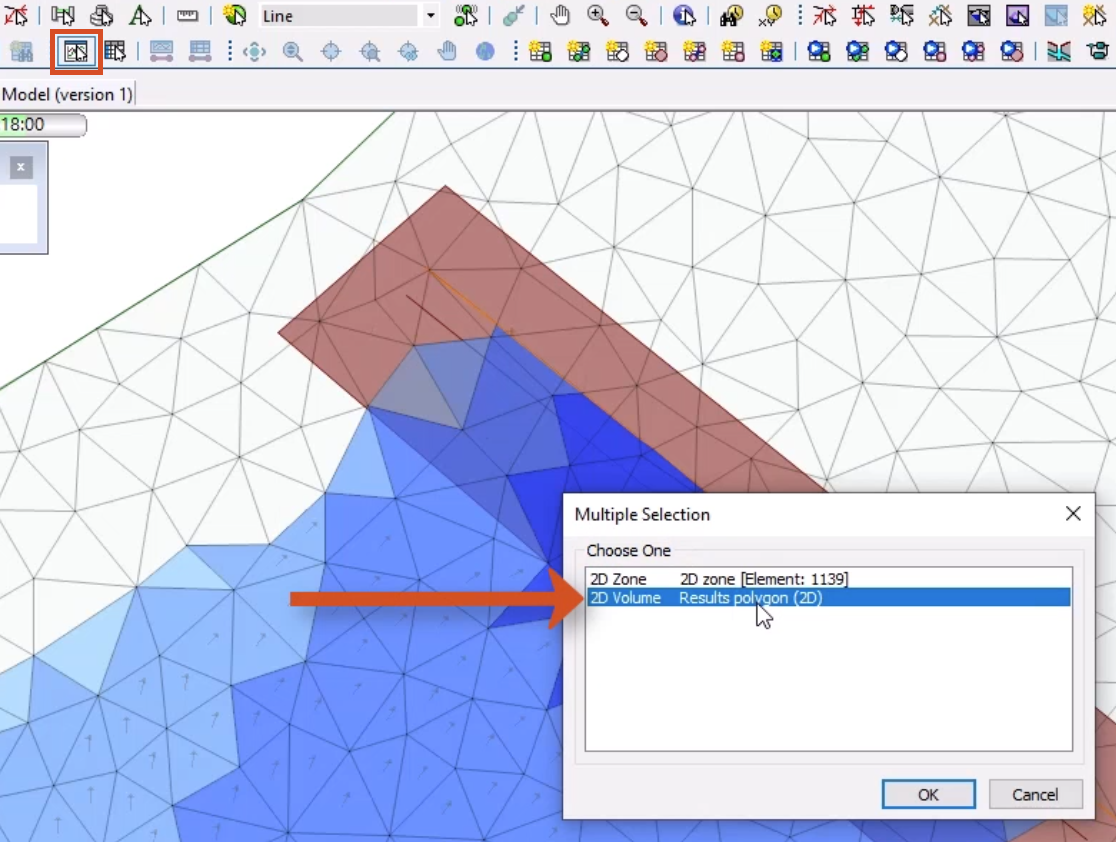
In the Results toolbar, select Graph Pick.
02:43
Click inside the polygon on your 2D River Model.
02:46
The Multiple Selection dialog appears.
02:49
Select 2D Volume Results polygon 2D.
02:55
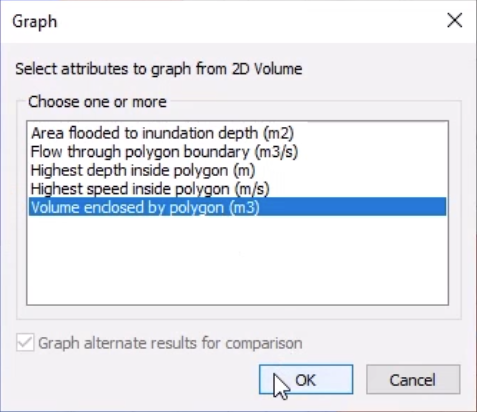
The Graph dialog appears with several options.
02:59
Select Volume enclosed by polygon (m3).
03:04
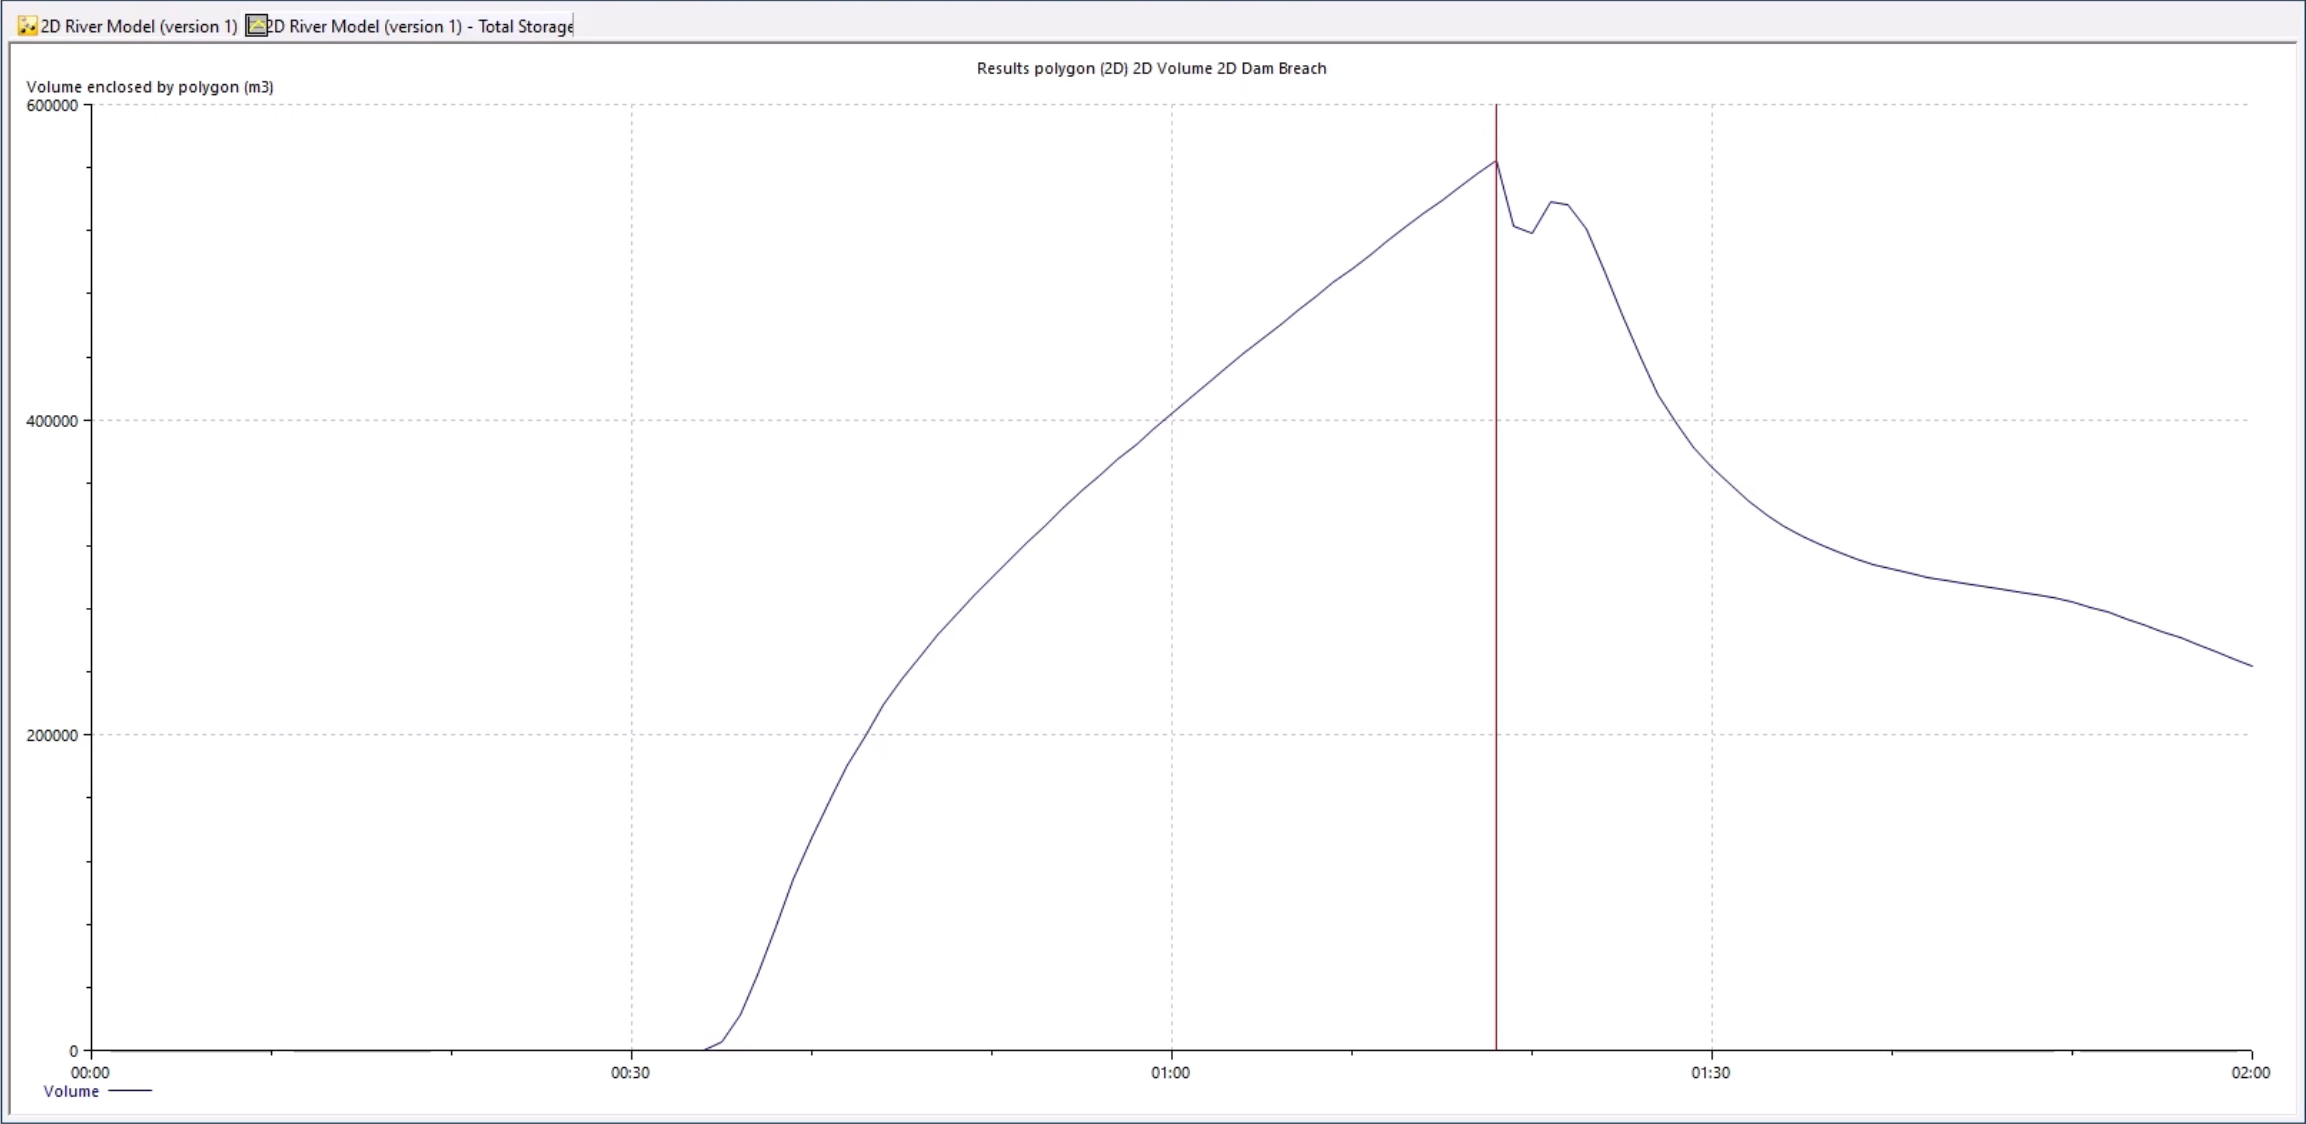
A 2D River Model graph window displays the maximum volume contained by the structure prior to collapse.
03:13
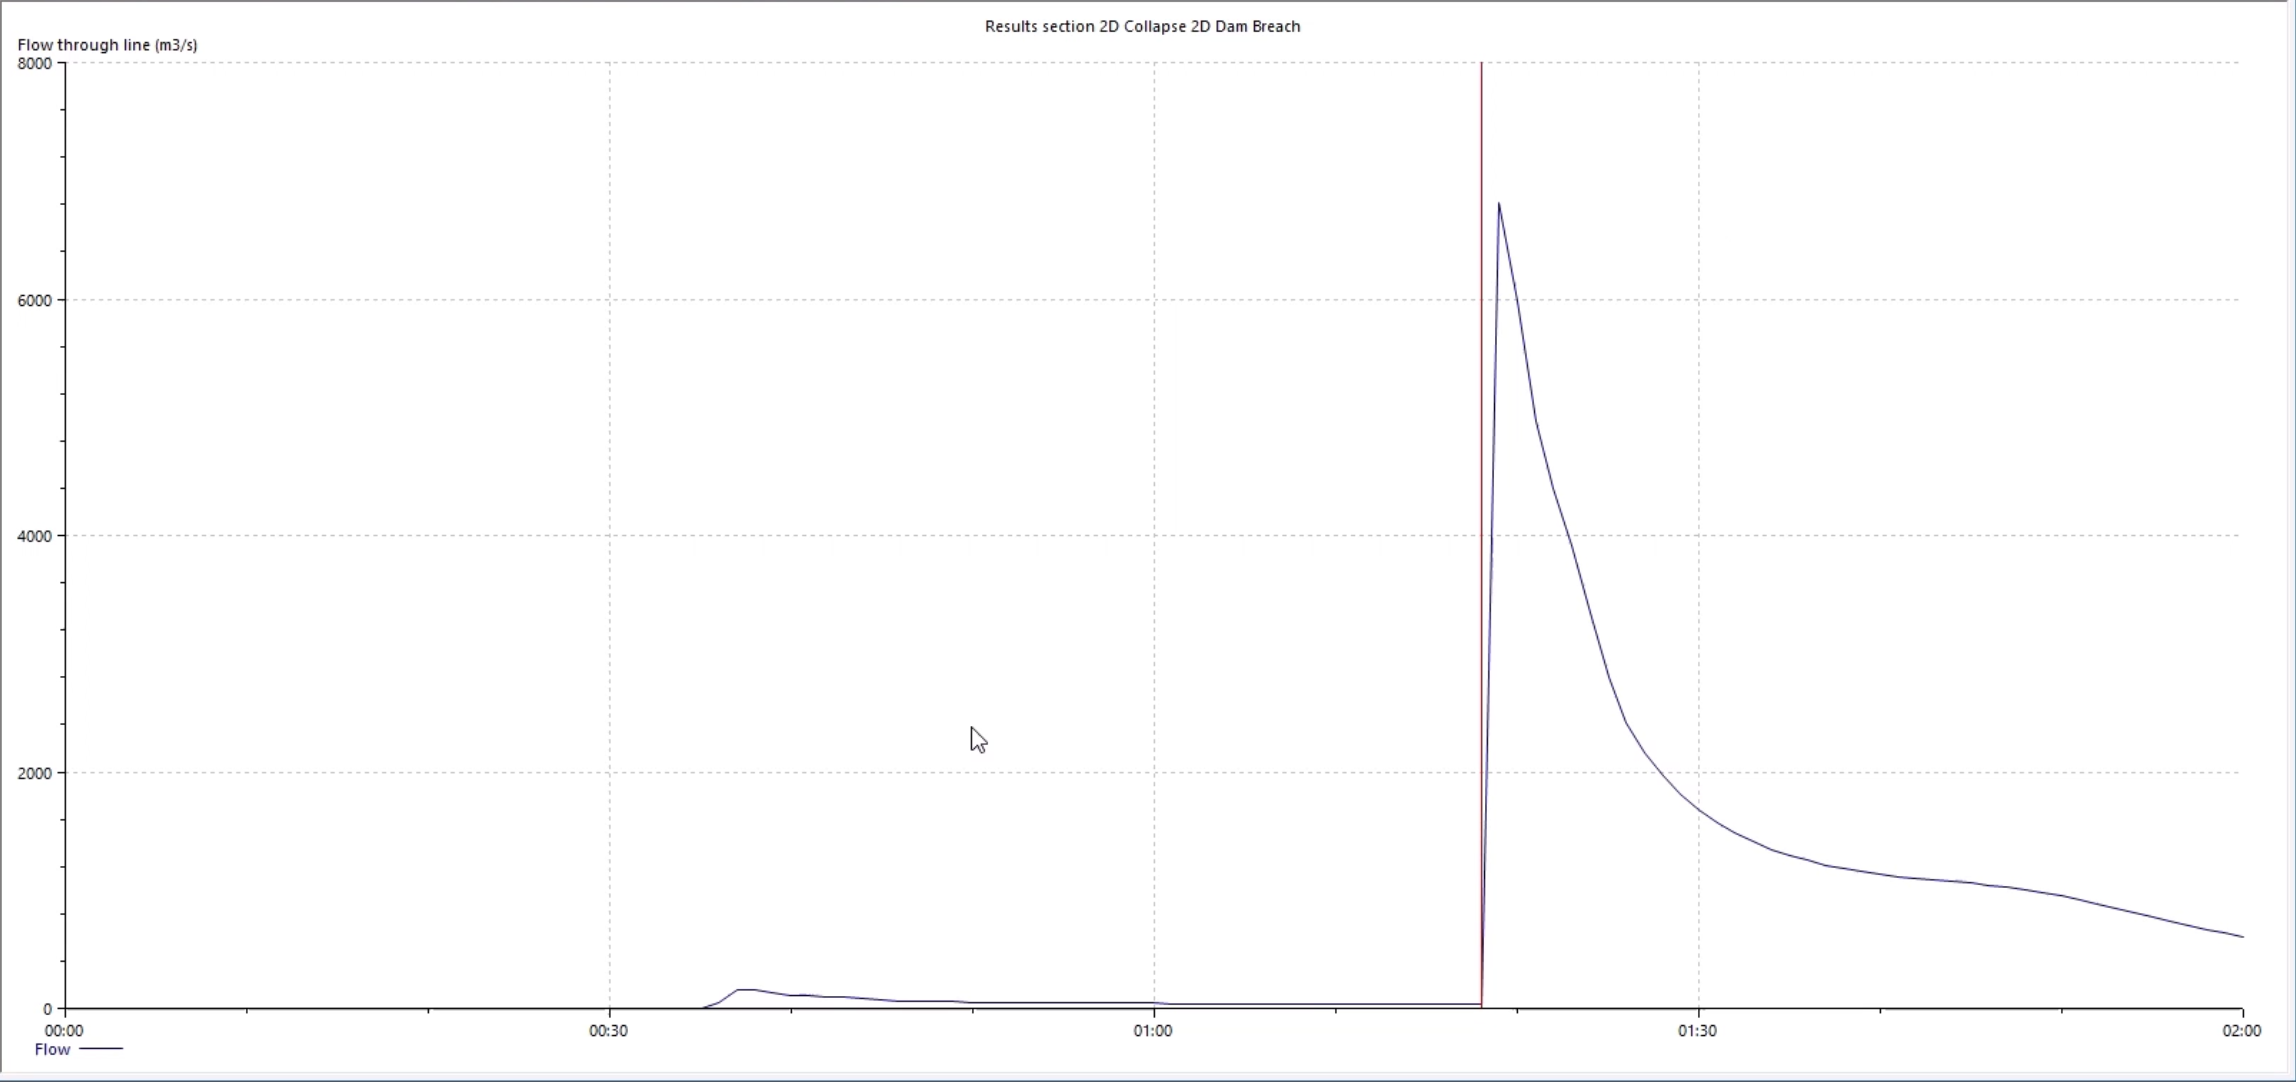
Next with the graph pick on, click the results section line you drew.
03:17
In the Graph dialog, select Flow through line (m3/s).
03:24
The resulting graph displays the flow through the line you drew as reaching over 7000 m3/s,
03:30
meaning the water would do significant damage to anything in its path.
03:36
Once you create 2D results objects, you can save them for future use, or add them to a different set of results.
03:43
To do this, in the Explorer window, click the Database tab.
03:47
In the GeoPlan Tools toolbar, click the Selection tool and make sure the GeoPlan is selected.
03:53
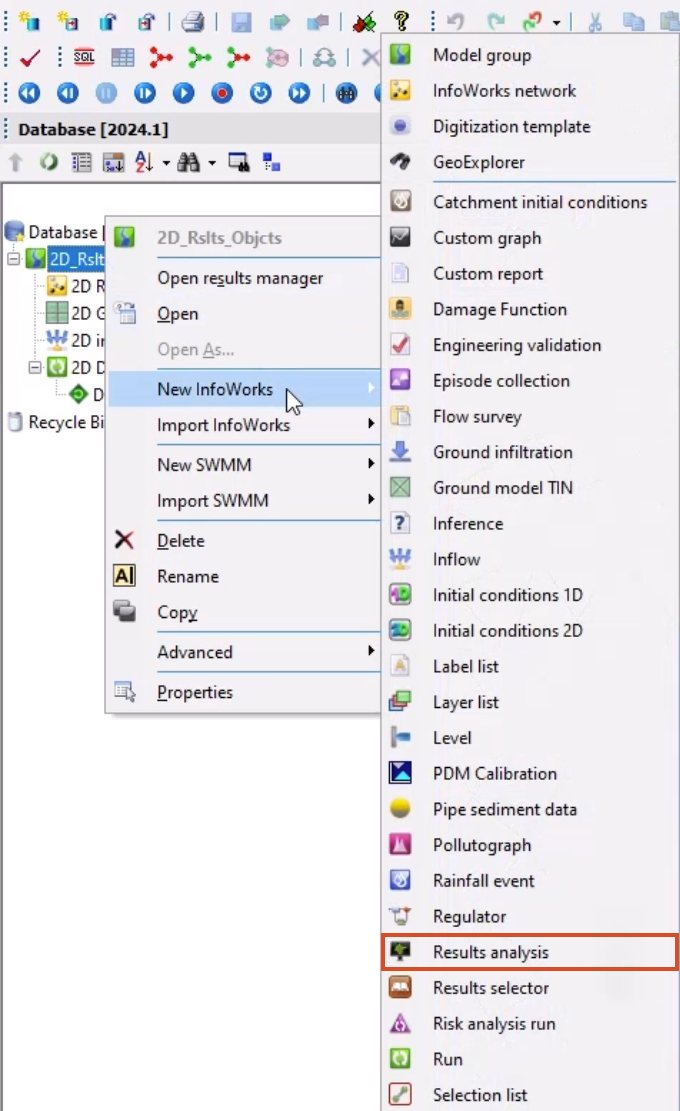
Right-click on the model group and select, New InfoWorks > Results analysis.
03:58
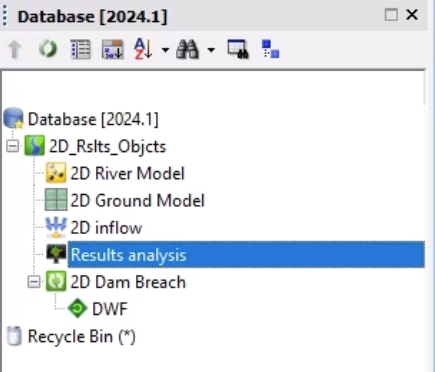
In the Results analysis dialog, you can rename your results analysis, but for this exercise, click OK.
04:05
In the Explorer window, your work is saved within the new Results analysis item, which can also be viewed as a graph or exported.