00:04
works. WS pro allows you to export both time varying data, TVD and summary data
00:12
summary data provides a summary of the time varying
00:15
data such as maximum minimum and average values.
00:20
This can be useful for exporting large numbers of objects. For comparison.
00:26
you will export a summary report of the average minimum and
00:29
maximum pressure values for a selection of customers to CSV,
00:34
create a folder on your desktop and name it results.
00:39
This is where you will save the results of this exercise.
00:43
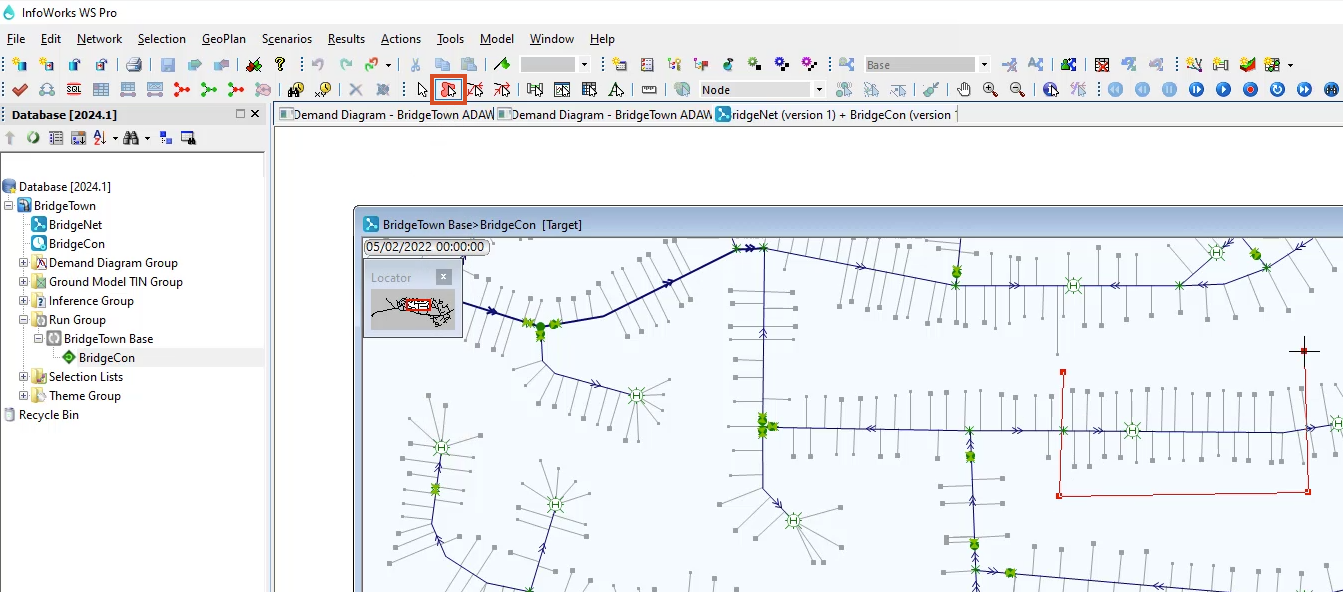
Open a completed run with results by dragging the simulation into the workspace
00:49
zoom into a part of the network populated with customer points
00:54
with the polygon select tool active,
00:56
draw a polygon around several customer points.
01:00
It is acceptable if the selection includes other objects
01:04
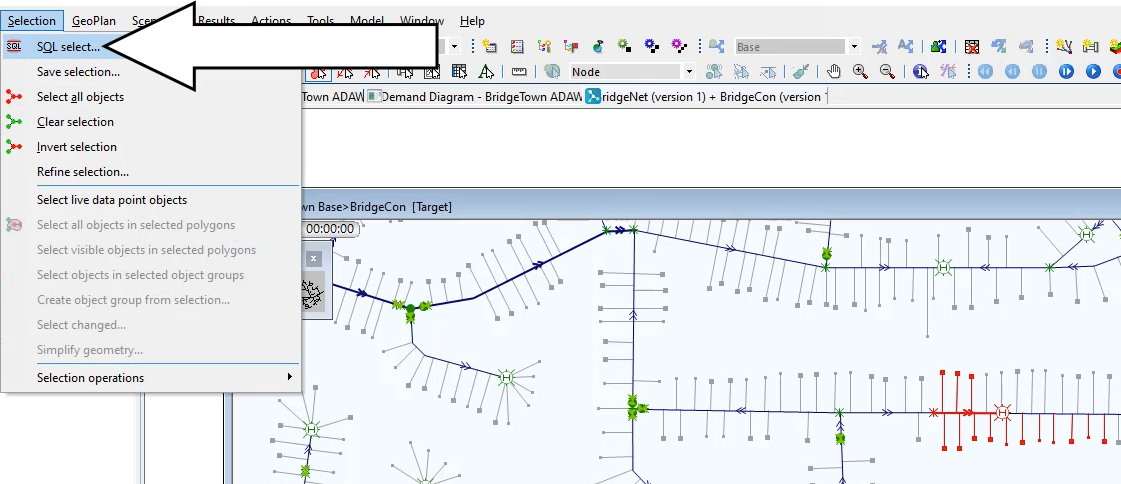
from the selection tab click SQL,
01:07
select to open the SQL
01:11
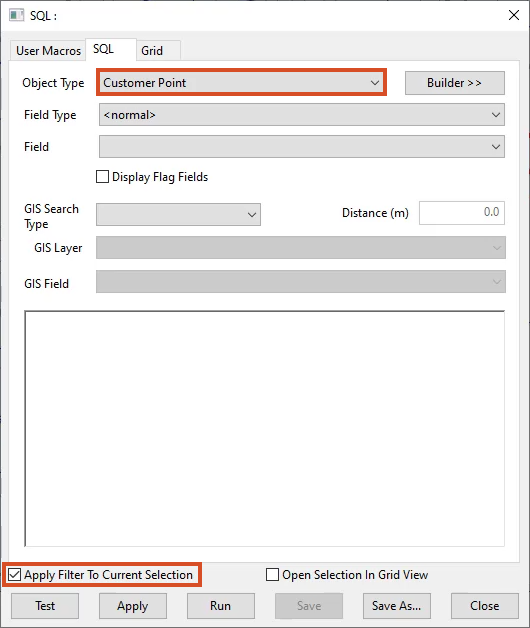
expand the object type field and click customer point,
01:15
check the box next to apply filter to current selection.
01:20
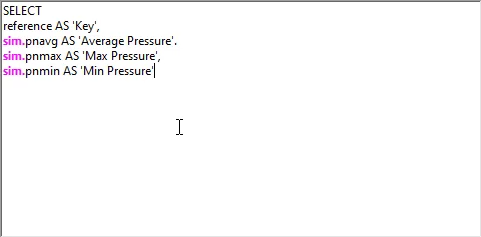
Then enter the following query into the large type Boxx.
01:31
AVG as average pressure
01:33
SIM dot PN Max as max pressure
01:41
click the test button,
01:43
click OK. In the notification saying the query has valid syntax
01:50
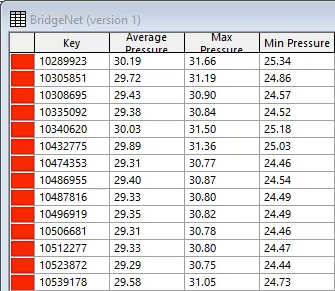
This opens a grid with the average minimum and
01:53
maximum pressures of all the selected customer points.
01:58
You can copy and paste the contents of this grid
02:01
into a spreadsheet or export it to a CSV file
02:05
to export to a CSV file. Close the grid results window
02:11
dialogue, start a new line in the query and type into file followed by a double quote,
02:19
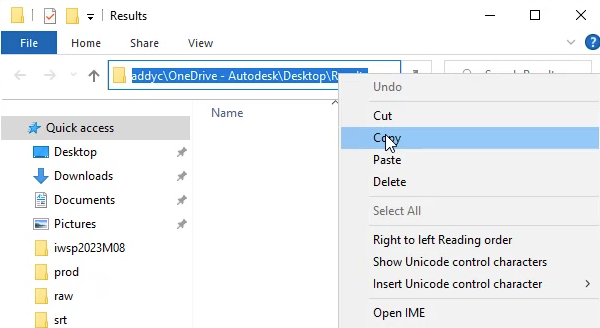
open file explorer and navigate to the results folder you created earlier.
02:24
Left, click the address bar to see the full path. Then right click and select copy,
02:30
return to the WS pro SQL
02:34
press control V to paste the file path.
02:37
And then at the end type backslash customers
02:41
results dot CSV followed by a double quote,
02:47
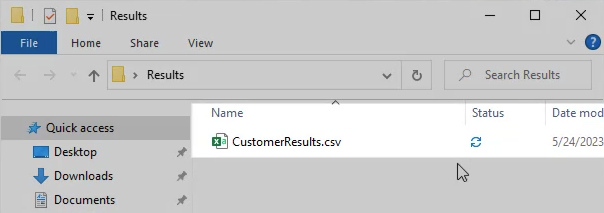
return to your results folder.
02:49
You will see the customers
02:50
results dot CSV file. You just exported,
02:54
you can open this file in a spreadsheet application.