00:03
InfoWorks WS Pro is capable of modelling fire flow availability.
00:08
You can determine the capacity of individual hydrants in a network
00:12
to sustain additional levels of demand for firefighting using the Fire Flow Availability simulation.
00:19
In the Model Group window, expand the BridgeTown Fire flow model,
00:22
and open the network control and demand diagram.
00:26
Then, right-click the model and pick New > Run Group, and then click OK to accept the default name.
00:37
Right-click the new Run Group and select New > Run.
00:41
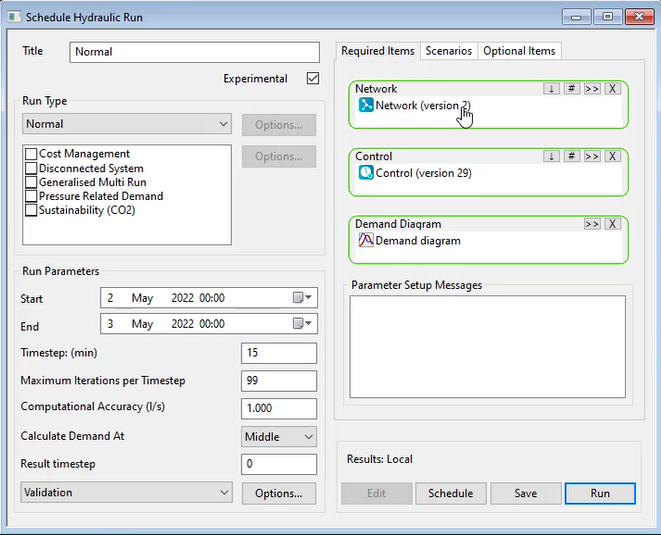
In the Schedule Hydraulic Run dialog, name the new Run.
00:45
In this example, it is called “Normal”.
00:48
Check the box next to Experimental.
00:51
Then, drag and drop the Network from the Model Group window into the dialog.
00:56
Click Save, and then Run.
00:59
Now, you will set up a Fire Flow Availability run.
01:03
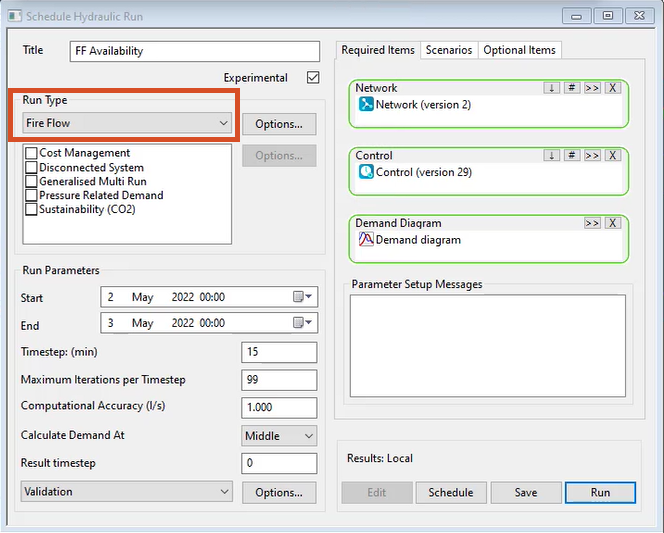
Right-click the Run Group, start another new run, and name it “FF Availability”.
01:09
Ensure the run is Experimental, and populate the Network, Control, and Demand Diagram areas the same as you did before.
01:19
In the Run Type group box, expand the drop-down and select Fire Flow.
01:25
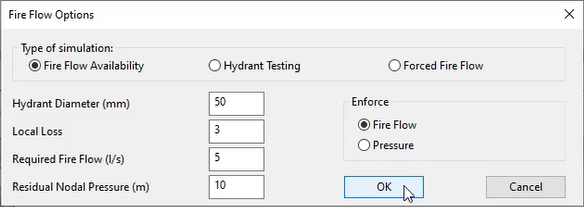
In the Fire Flow Options dialog, in the Type of simulation: group box, ensure that Fire Flow Availability is enabled.
01:32
Then, set the hydrant diameter to 50, the local loss to 3, the required fire flow to 5, and the residual nodal pressure to 10.
01:42
In the Enforce group box, make sure Fire Flow is enabled.
01:47
When Fire Flow is enabled, the run will determine the ability of each hydrant in the network to provide the required fire flow
01:54
while retaining the specified residual pressure.
01:57
When Pressure is enforced, the run will determine the ability of each hydrant in the network
02:02
to retain the specified residual pressure while providing the required fire flow.
02:09
In the Schedule Hydraulic Run dialog, click Save and Run.
02:13
Expand the Run Group link tree to find the FF Availability run
02:17
and then click and drag the results to the GeoPlan.
02:22
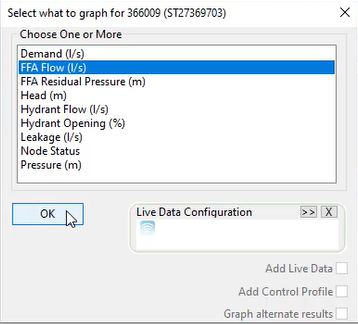
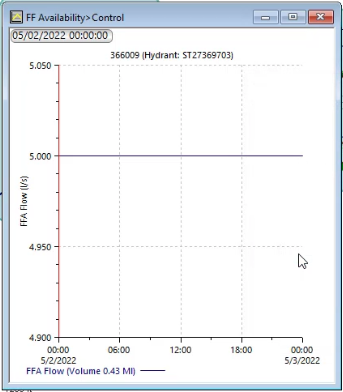
In the toolbar, activate the Graph tool, and then select any hydrant.
02:28
In the dialog, graph for FFA Flow, and then click OK to open the graph,
02:34
which shows the FFA flow maintained at 5 liters per second.
02:39
Looking at hydrant results one-by-one can be time-consuming,
02:42
so you do have the option of looking at how they all performed in a grid.
02:47
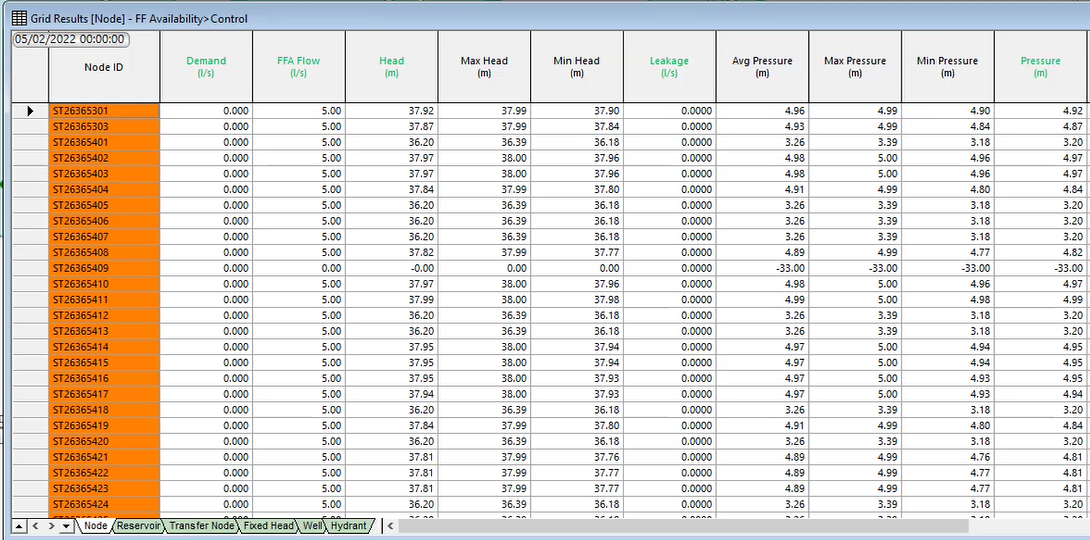
In the toolbar, expand the Grids windows drop-down and select Node results.
02:52
This opens a grid that displays the FF availability for all hydrants in the network,
02:57
including values for FFA flow, head, and pressure.
03:03
Essentially, it shows what is happening across the network if you force 5 liters per second from every node independently,
03:10
as if no other hydrant in the system is open.