00:03
The sustainability analysis functionality in InfoWorks WS Pro
00:08
allows energy losses in the network to be calculated as a Carbon Dioxide (CO2) equivalent.
00:14
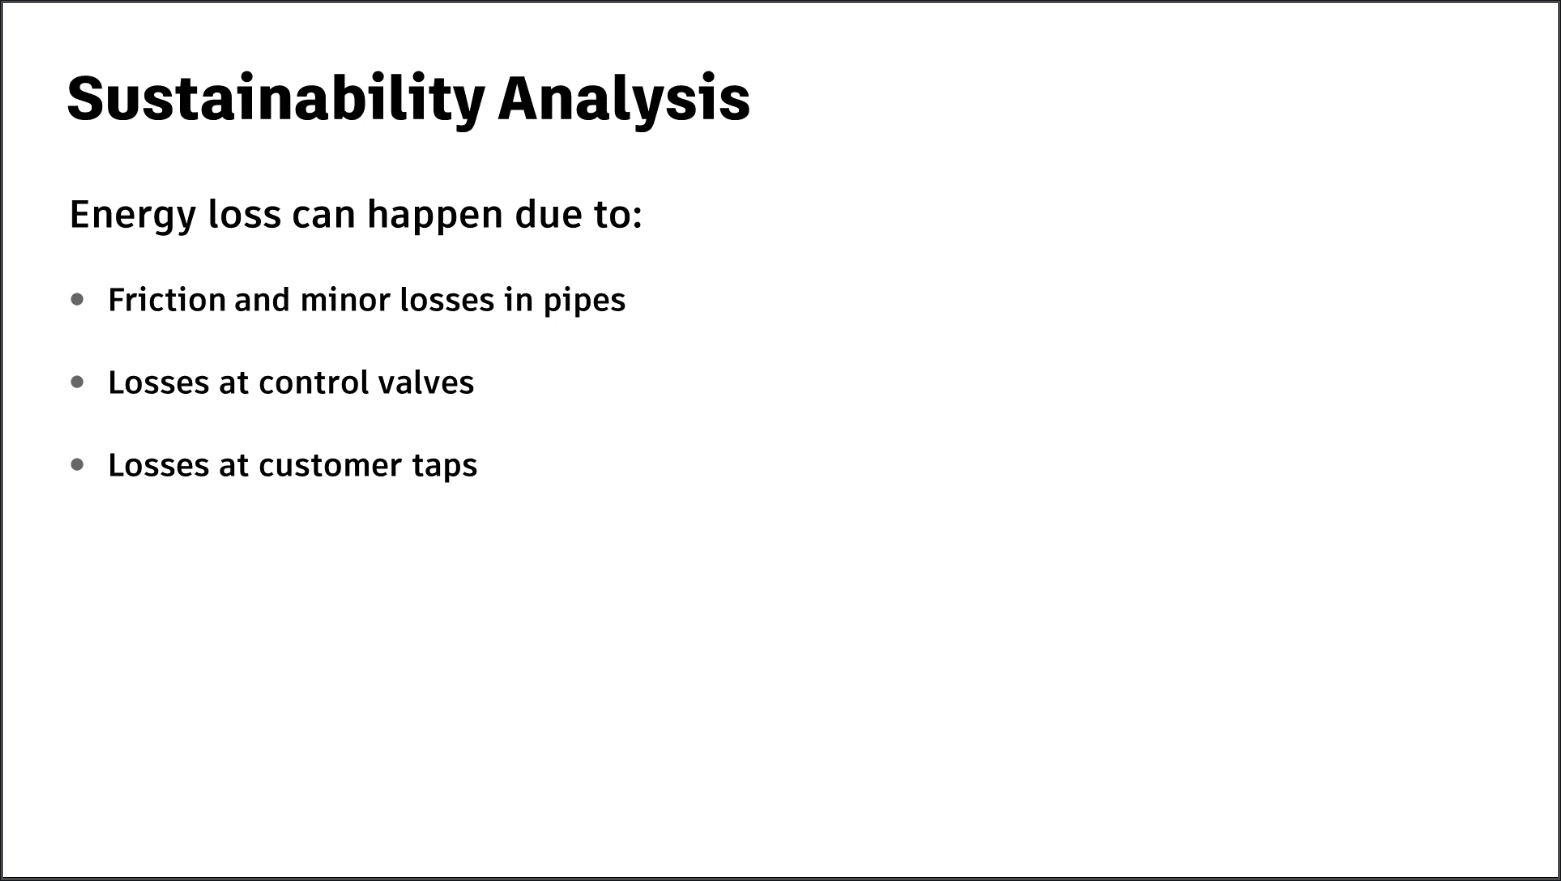
Energy loss can happen due to friction and minor losses in pipes,
00:19
losses at control valves,
00:21
and losses at customer taps.
00:23
For pumping stations, a carbon dioxide equivalent of pump energy usage is also calculated.
00:30
The results of the analysis can be used to review and manage energy losses through the network.
00:35
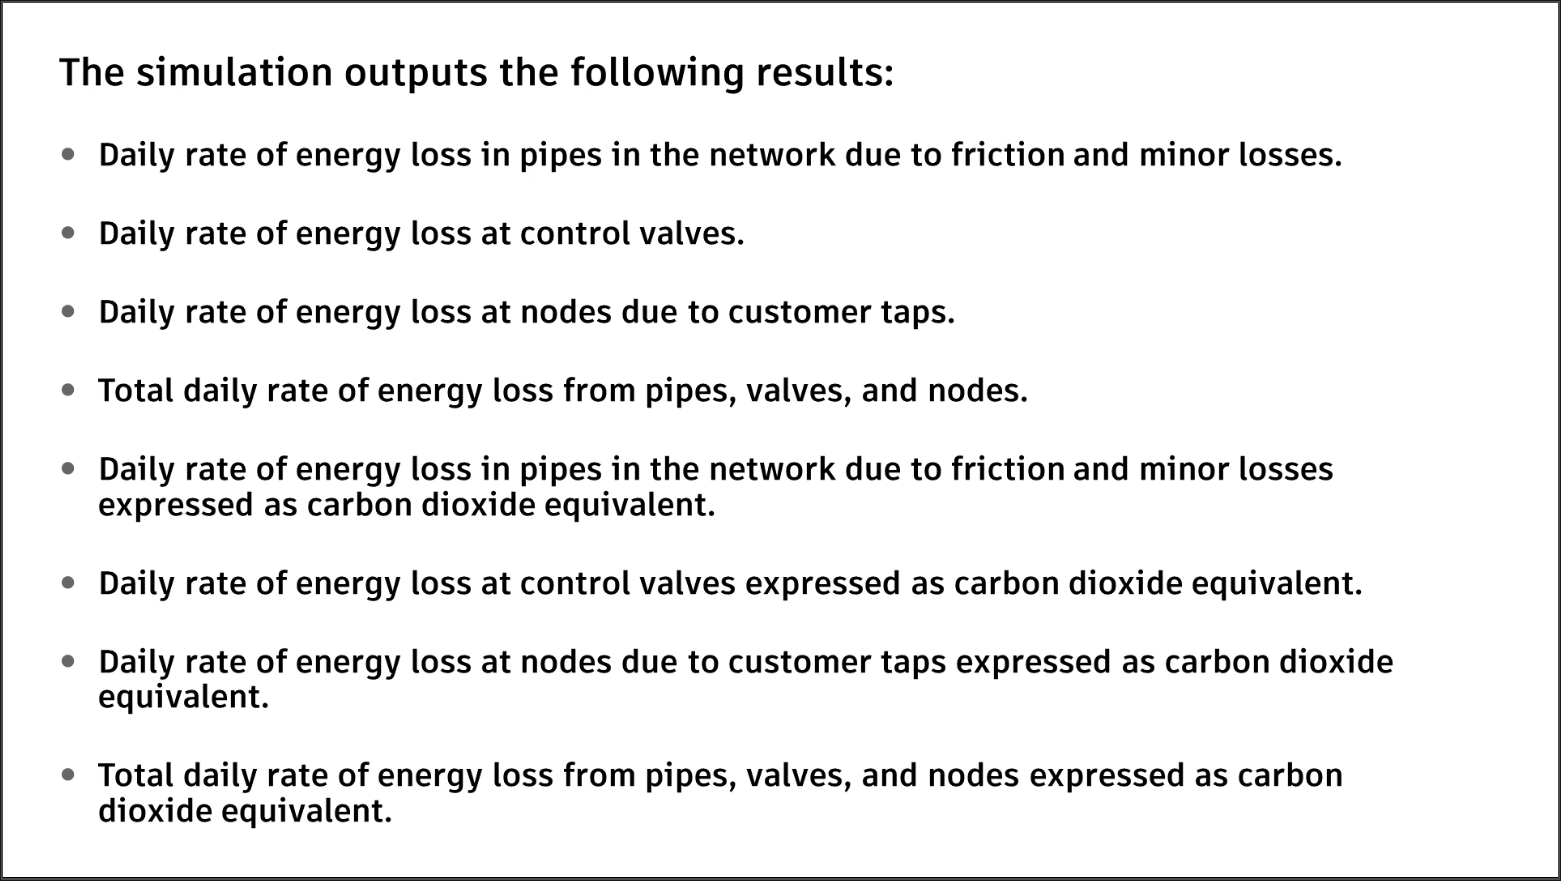
The simulation outputs the following results:
00:39
Daily rate of energy loss in pipes in the network due to friction and minor losses.
00:45
Daily rate of energy loss at control valves.
00:49
Daily rate of energy loss at nodes due to customer taps.
00:53
Total daily rate of energy loss from pipes, valves, and nodes.
00:59
Daily rate of energy loss in pipes in the network due to friction and minor losses expressed as carbon dioxide equivalent.
01:07
Daily rate of energy loss at control valves expressed as carbon dioxide equivalent.
01:13
Daily rate of energy loss at nodes due to customer taps expressed as carbon dioxide equivalent.
01:19
Total daily rate of energy loss from pipes, valves, and nodes expressed as carbon dioxide equivalent.
01:27
To carry out sustainability calculations, CO2 conversion factors need to be defined.
01:34
Different conversion factor regimes can be set up for use in calculating network losses,
01:39
or for use with different pumping stations.
01:42
To run a sustainability analysis, you need to set up the appropriate CO2 configuration for the model.
01:49
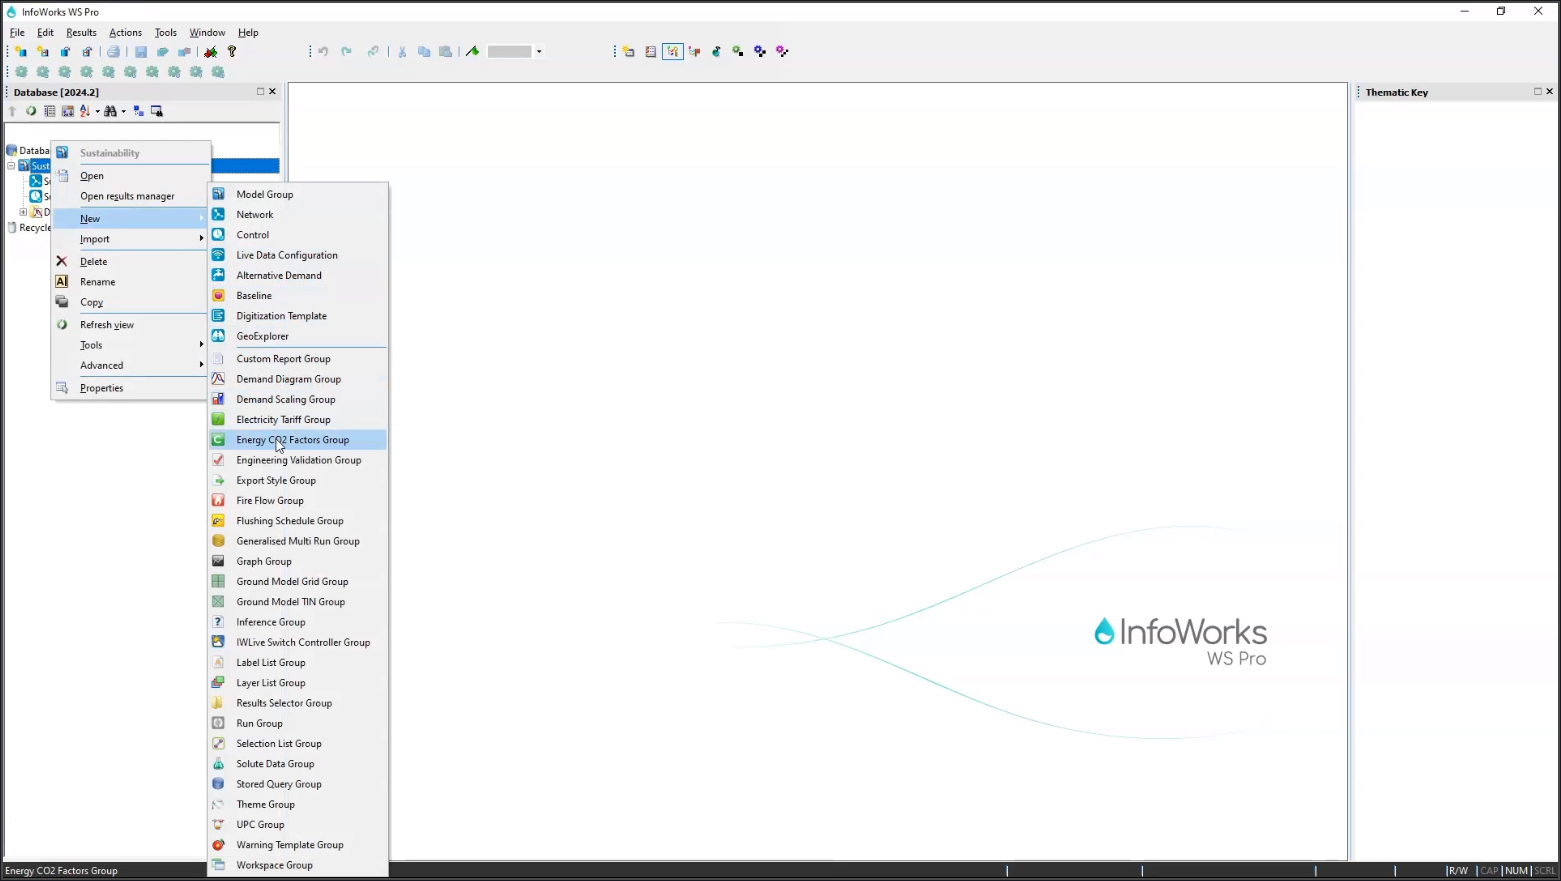
From the Model Group window, expand the Sustainability Model Group.
01:54
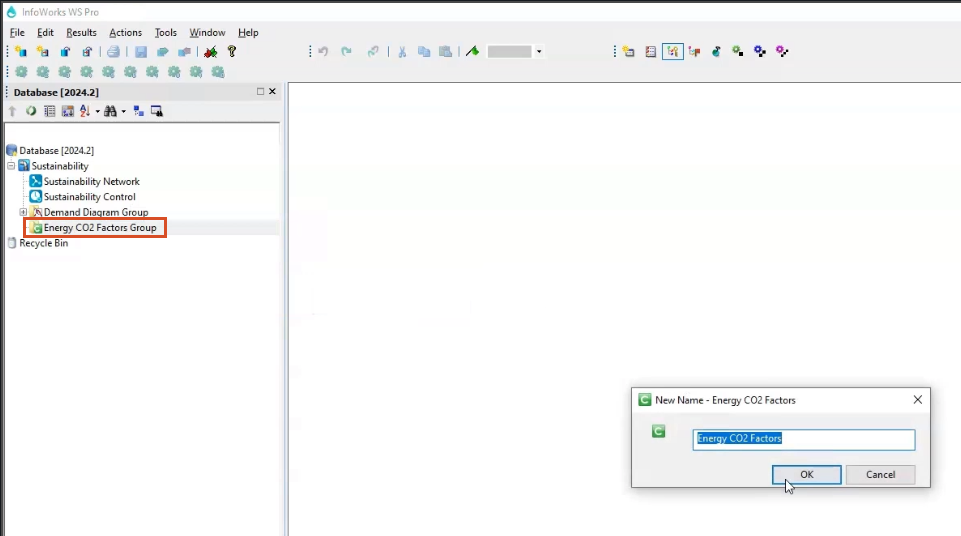
Create a new Energy CO2 Factors Group.
01:58
Right-click the Bridgetown Model Group and select New > Energy CO2 Factors Group.
02:04
Keep the default name, and click OK.
02:08
Next, create a new Energy CO2 Factors Object.
02:11
Right-click the Energy CO2 Factors Group and select New > Energy CO2 Factors.
02:18
Keep the default name, and click OK.
02:22
To configure the energy factors, double-click Energy CO2 Factors.
02:27
This opens the Energy CO2 Factors dialog.
02:31
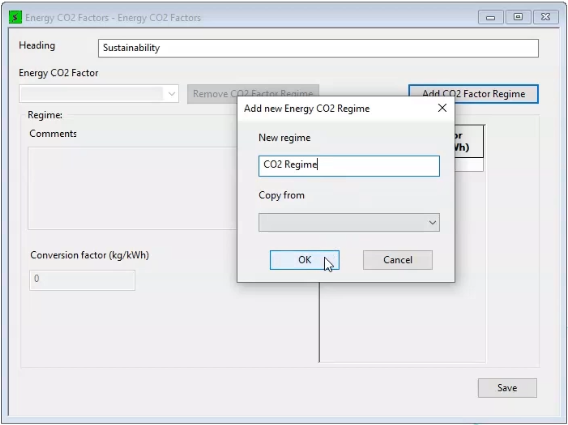
Type a name for the Heading.
02:33
In this example, enter “Sustainability”.
02:37
Click the Add CO2 Factor Regime button, and then enter a name in the pop-up.
02:42
For this example, type, “CO2 Regime”.
02:48
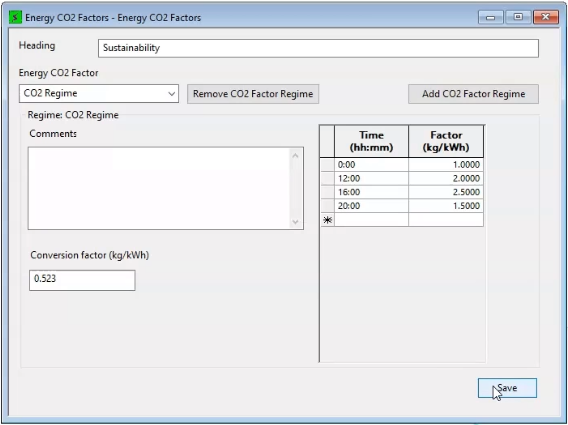
The new regime has been populated under the Energy CO2 Factor drop-down.
02:53
On the right side of the Energy CO2 Factors dialog, enter the following Time and Factors:
03:19
Then, close the Energy CO2 Factors dialog.
03:23
To run the sustainability simulation, create a new Run Group.
03:27
Right-click the Run Group, then select New > Run.
03:32
The Schedule Hydraulic Run dialog opens.
03:35
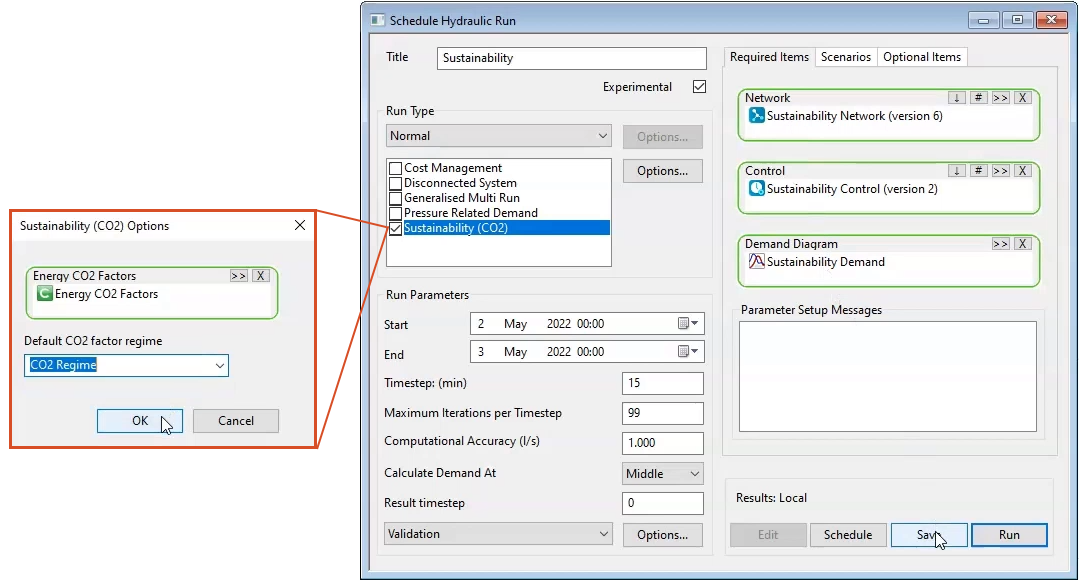
Type “Sustainability” as the name for the run.
03:39
Check the box next to Experimental.
03:43
Then, under the Run Type, ensure that Normal is selected from the drop-down.
03:48
Next, click the Sustainability (CO2) option to enable it.
03:53
A Sustainability (CO2) Options pop up appears.
03:57
Drag and drop the new Energy CO2 Factors object
04:01
and then expand the default CO2 Factor Regime drop-down and select CO2 Regime.
04:07
Then, from the Model Group, drag the Sustainability network and drop it into the Network group box
04:12
in the dialog to populate the Network, Control, and Demand Diagram dialogs.
04:18
Click Save and then Run.
04:19
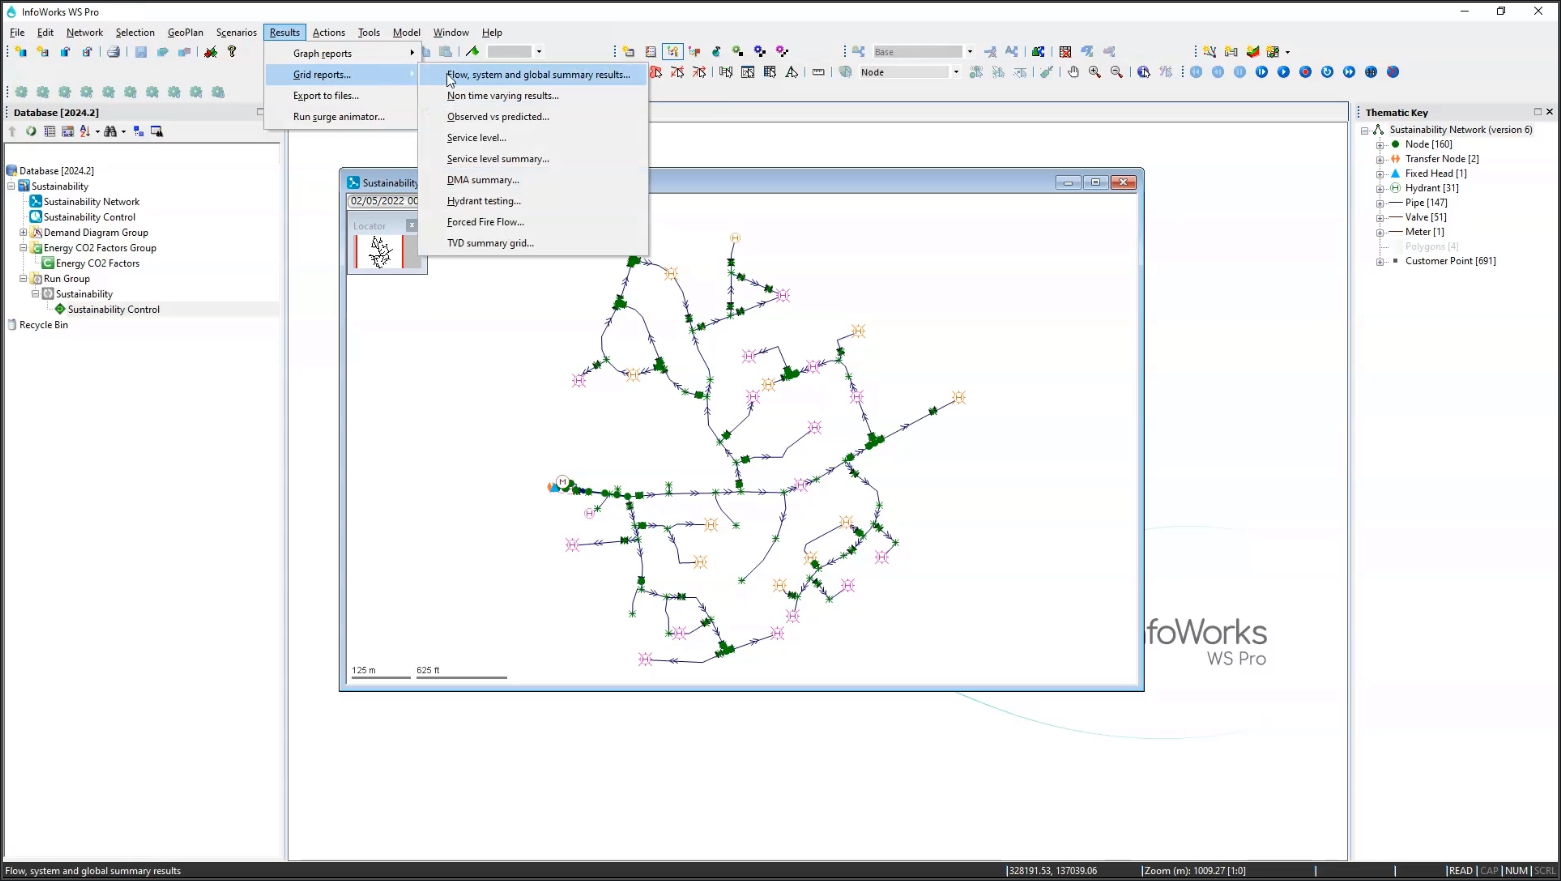
To view the results, double click the Sustainability Control simulation.
04:26
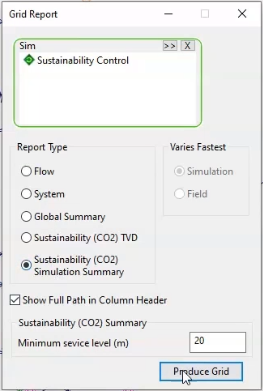
Navigate to the Results ribbon and select Grid Reports > Flow, system and global summary results.
04:34
The Grid Report Window opens.
04:37
If the Sustainability Control simulation has not auto-populated in the Sim box, drag and drop it from the model tree.
04:45
In the Report Type group box, select Sustainability (CO2) Simulation Summary.
04:53
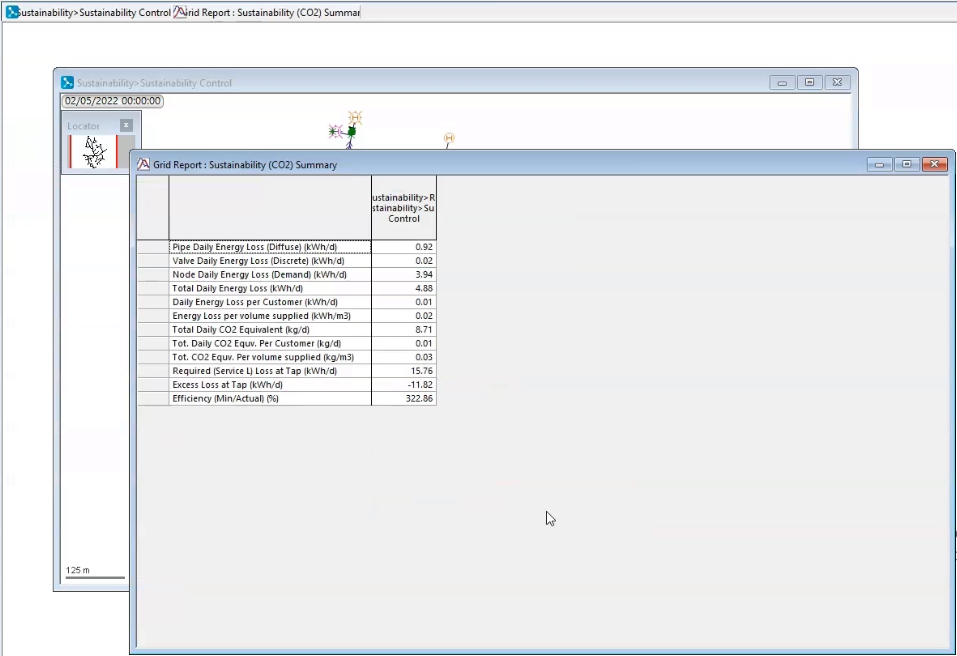
The Sustainability Summary grid report opens.
04:58
Here, you can review the various CO2 output and statistics from across the simulation.