00:04
Categorizing demand and info works W S pro allows you to easily
00:08
visualize different demand profiles which can
00:11
be crucial for planning new developments.
00:15
you will create a new demand category representing
00:18
a school within a planned housing development.
00:21
Before starting be sure to copy session five dot wpt into your database.
00:26
Open the bridge net GEO plan and work
00:28
within a new scenario named housing development.
00:32
This new scenario will need a node
00:34
with allocated demand linked to the existing network
00:38
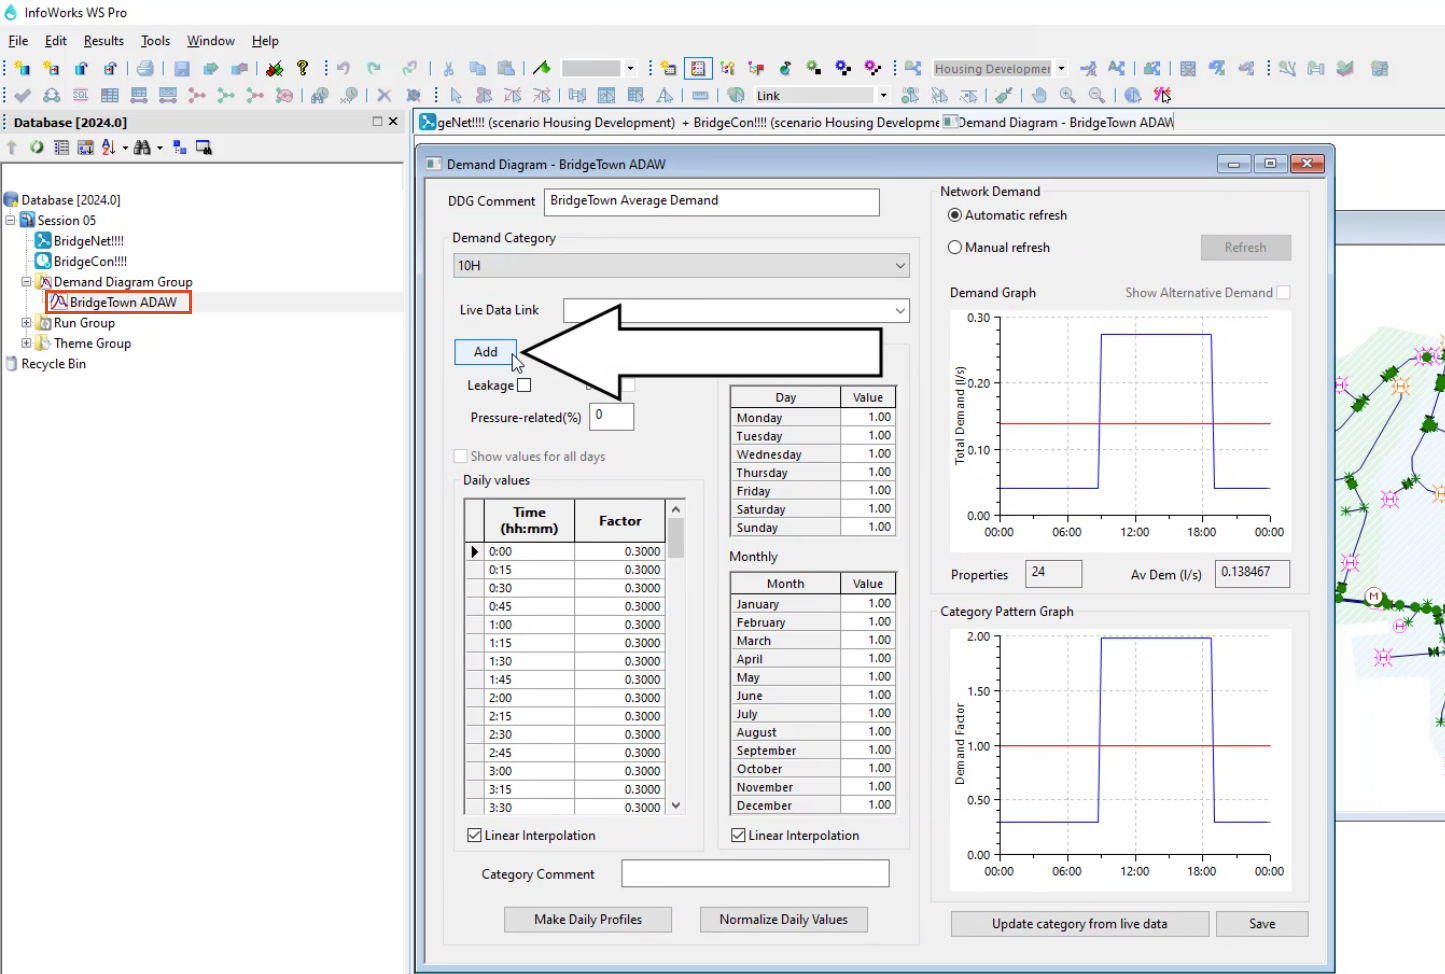
from the model group window under demand diagram group select
00:42
Bridgetown ad A W to open the demand diagram.
00:51
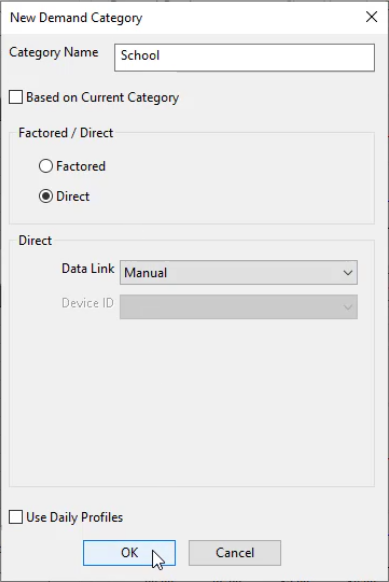
this displays the new demand category dialogue
00:55
from here in the category name field.
00:58
Enter a descriptive name for the new category such as school
01:02
to use demand data from a live data
01:05
source from the factored direct section select direct
01:10
ensure the data link is set to manual which allows the
01:13
category data in the demand diagram editor to be entered manually.
01:21
The demand diagram opens again with the demand category set to
01:25
the newly created category which in this case is named school.
01:30
Now you can manually enter the data for the new demand category
01:34
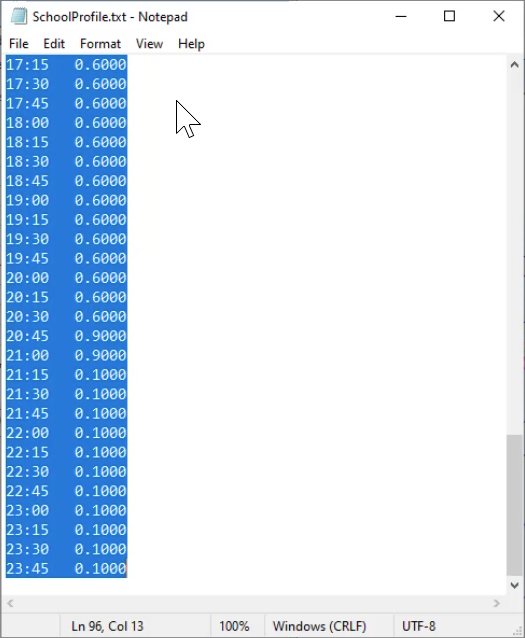
from your devices, file explorer, open the school profile text document.
01:40
The data in this document represents a demand pattern for a 24 hour period
01:46
from the document, select all the data and copy it.
01:50
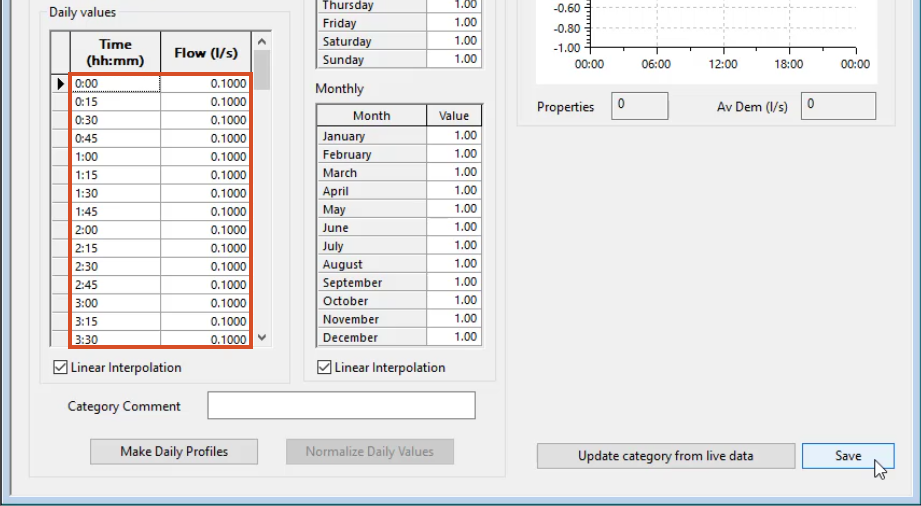
Then back in info works ws pro demand diagram under daily values,
01:56
select the top left cell and paste the data
02:00
with the data pasted into the diagram. Click save.
02:05
You can now use this new demand category.
02:08
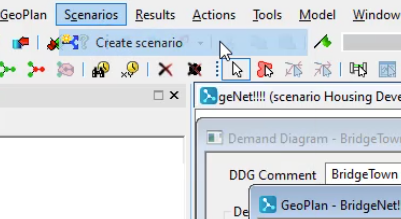
Return to the GEO plan and create a new scenario
02:13
from the toolbar select scenario,
02:18
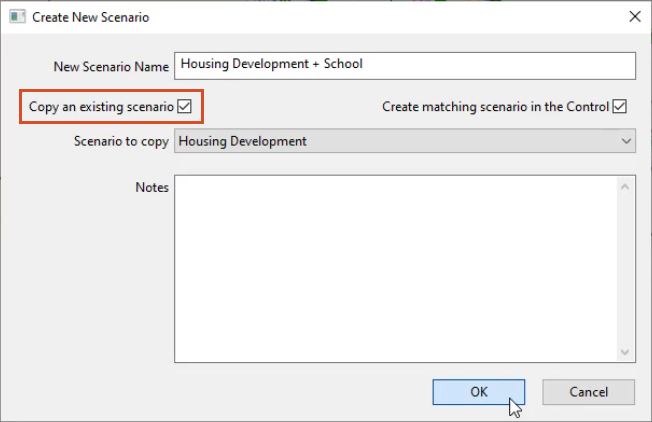
in the create new scenario, dialogue name this scenario,
02:22
housing development plus school and select copy an existing scenario
02:28
from the scenario to copy drop down. Ensure housing development is selected
02:37
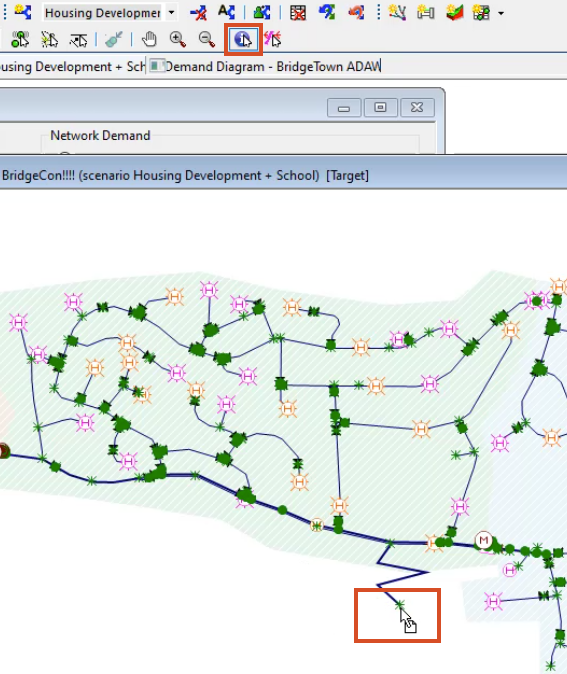
Now in the toolbar select properties and then in the
02:41
GEO plan select the node that represents the planned development
02:46
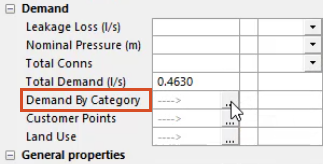
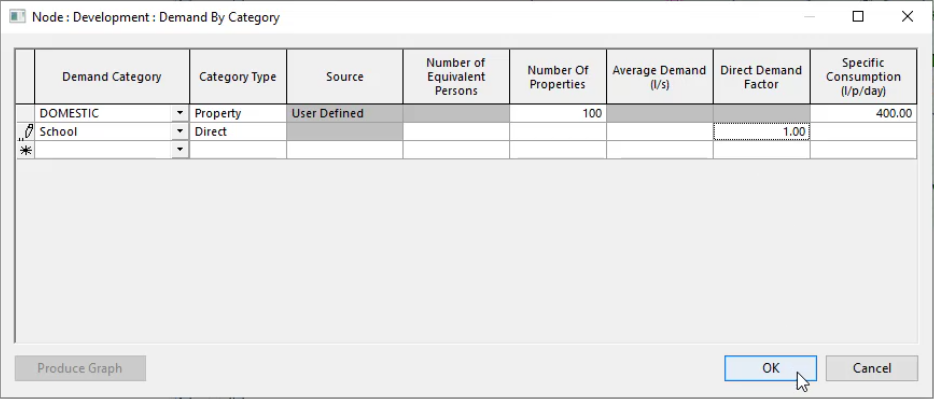
from the development nodes properties window under demand,
02:50
select the demand by category ellipsis button,
02:54
the demand by category dialogue displays
02:58
in the second row, expand the demand category drop down and select school
03:05
set category type two direct
03:09
in the direct demand factor cell enter one
03:12
so that it is not given a multiplier
03:18
Commit the changes to both the bridge net network and the bridge con control.
03:24
Now that there are three scenarios in this model,
03:27
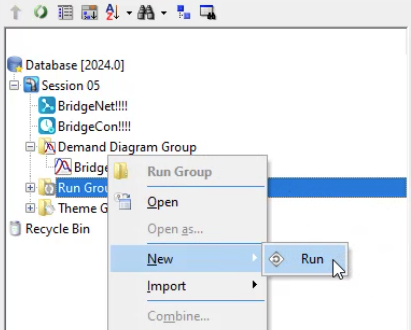
you can create a new run to simulate all three of them
03:32
from the model group window, right, click run group and select new
03:41
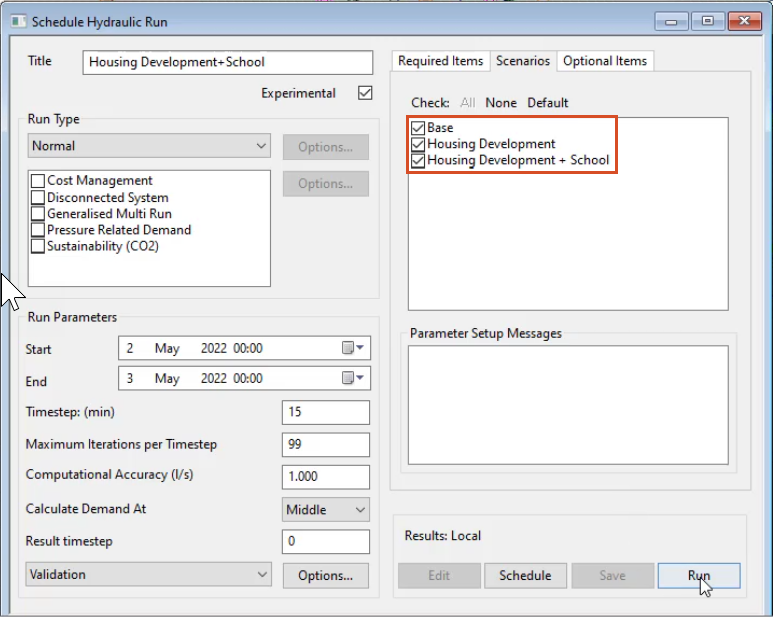
in the schedule. Hydraulic run dialogue
03:43
name the run housing development plus school and set two experimental
03:50
drag the bridge net network into the network section.
03:54
And from the scenarios tab select all three scenarios and then click run
04:02
in the warning dialogue, click yes to continue.
04:06
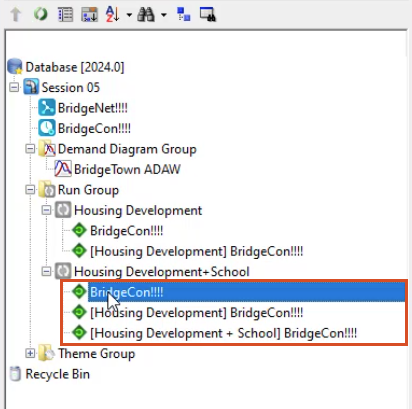
Once the run is processed, it displays in the model group window.
04:12
You may need to expand the link tree in order to navigate to it.
04:17
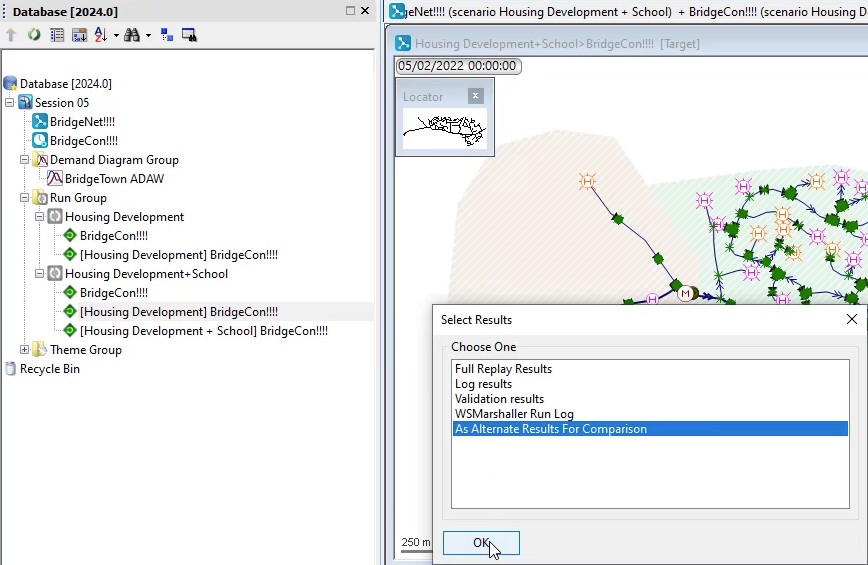
You can now open the base scenario simulation
04:20
and then open the other two simulations.
04:22
As alternate results. For comparison
04:29
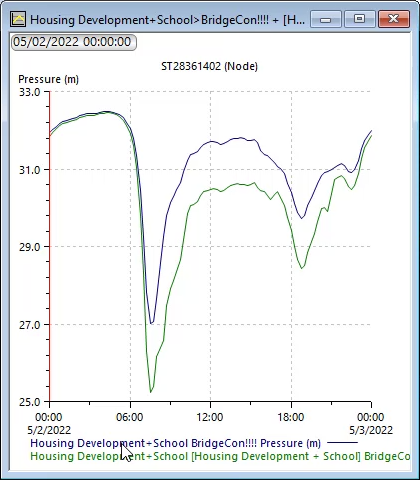
you could use the graph command to select the development node to
04:32
visualize the differences in flow or pressure for the three scenarios.