00:04
In addition to creating scenarios, info works.
00:07
WS pro also gives you the ability to
00:10
perform hydraulic runs with multiple scenarios included.
00:14
When you include multiple scenarios in a run,
00:17
you can observe how they both performed during
00:19
the simulation by graphing the results simultaneously.
00:24
Best practice before creating a new run is to ensure you commit any changes,
00:29
right? Click the bridge net network
00:31
pick commit changes to database
00:34
and click. OK. In the following dialogue,
00:37
repeat this process for the control.
00:40
Be aware that committing these changes to the database
00:42
only overwrites the pipe replacement scenario but not the baseline
00:47
to create a new run with multiple scenarios in the model group window, right,
00:52
click run group, then select new run
00:56
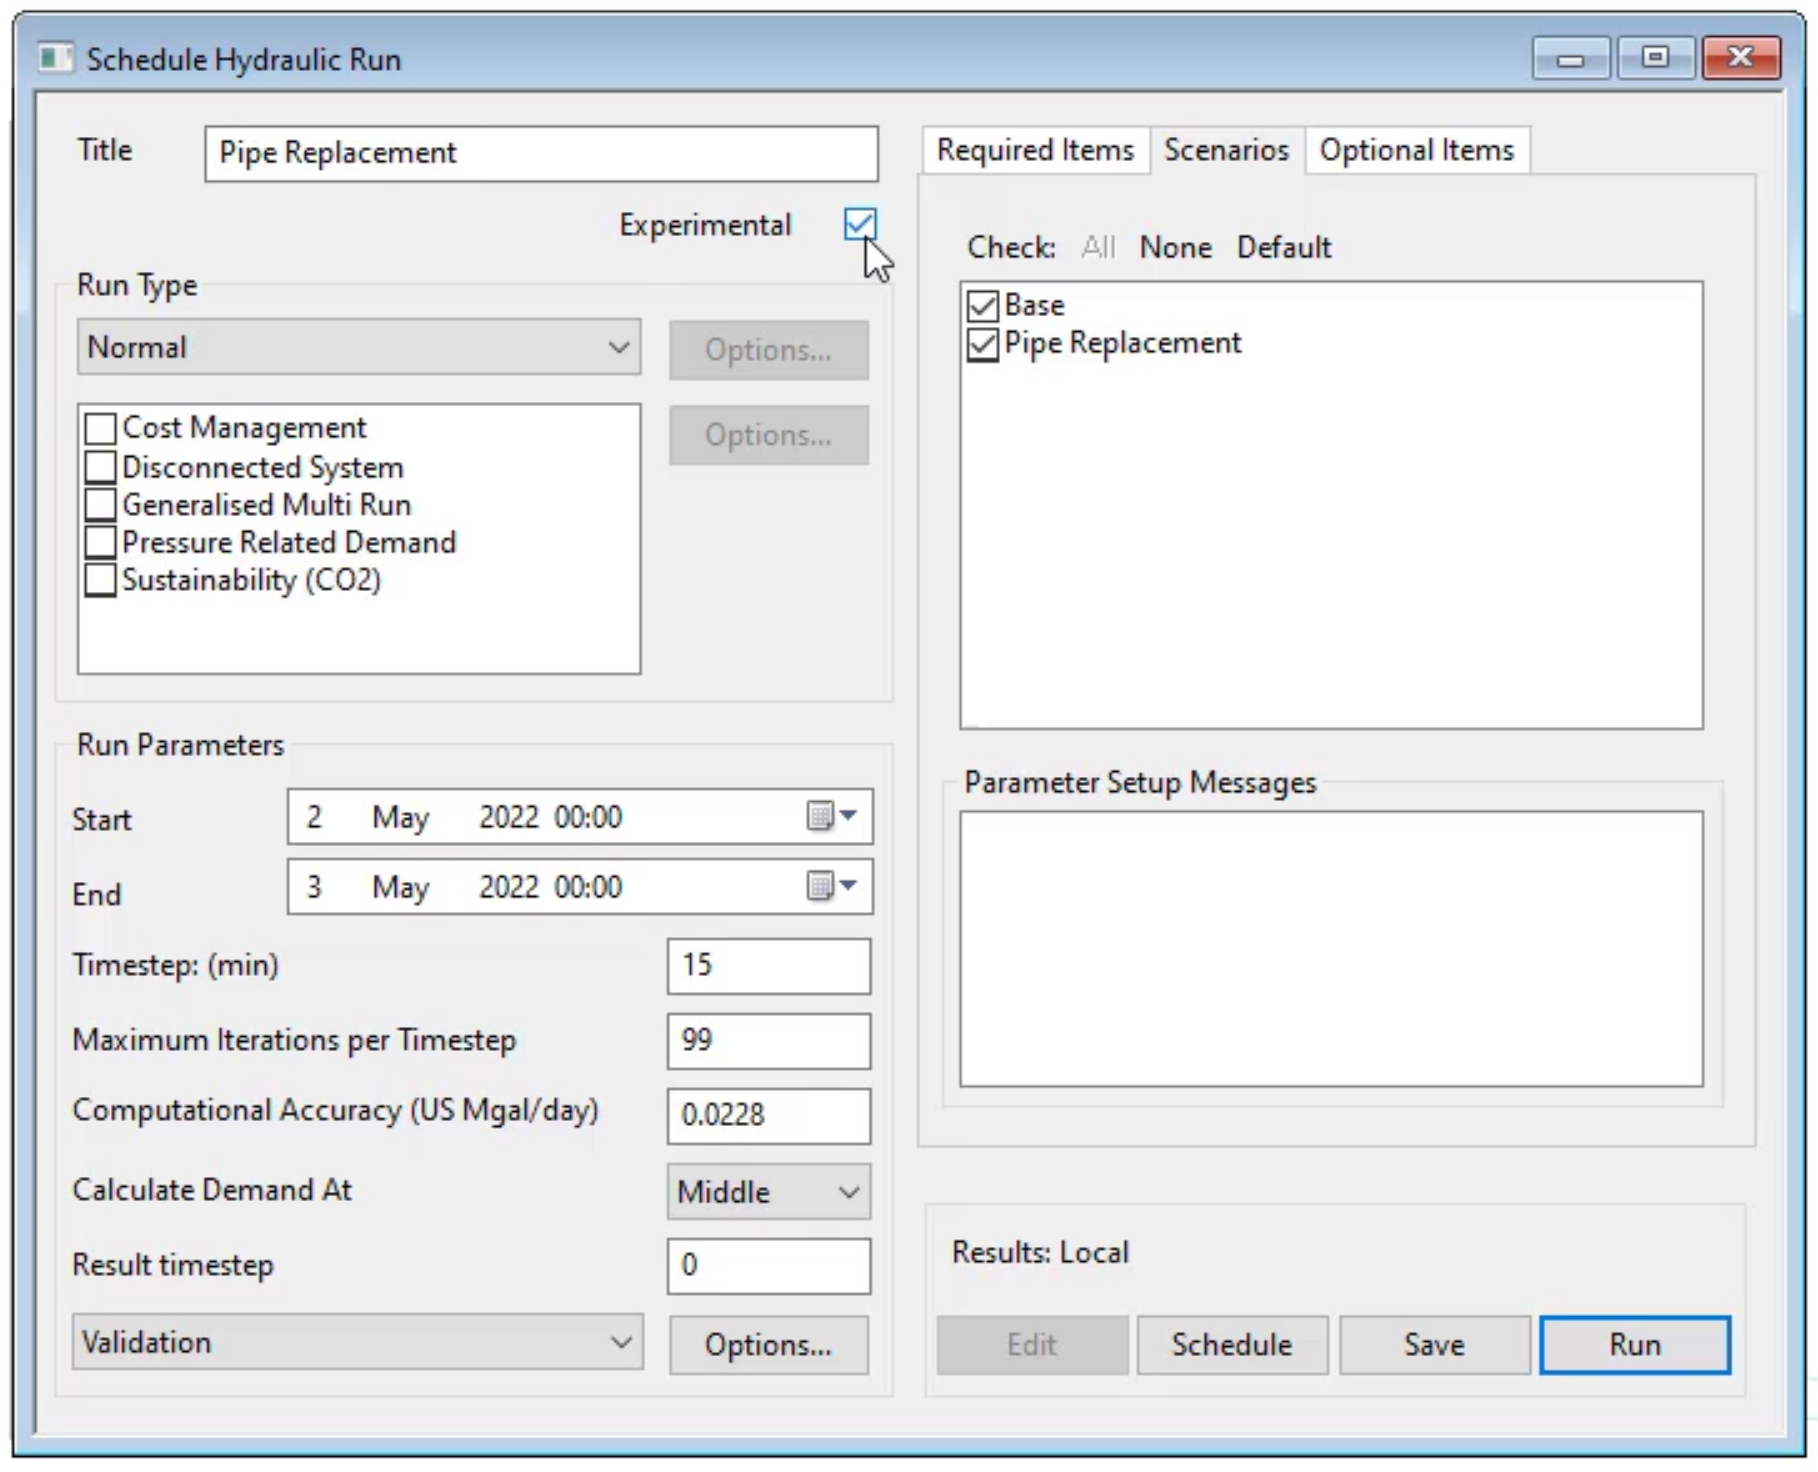
in the schedule hydraulic run dialogue, enter pipe replacement in the title field,
01:01
then click and drag the bridge net network from
01:04
the model group window into the network group box.
01:09
Now click the scenarios tab and check the box next to pipe replacement.
01:14
You can choose to include the base scenario as it can
01:17
be convenient to have the run results for both packaged together.
01:22
Check the box next to experimental,
01:26
then click save and run
01:31
a notification appears telling you that this run will
01:34
perform two simulations and may take a long time.
01:39
Once the icons for both entries under the pipe replacement run are green,
01:44
you can view the results,
01:47
you can click and drag either entry into an empty part of
01:50
the workspace window to view the results in the GEO plan.
01:53
this example, the second in the list is selected
01:58
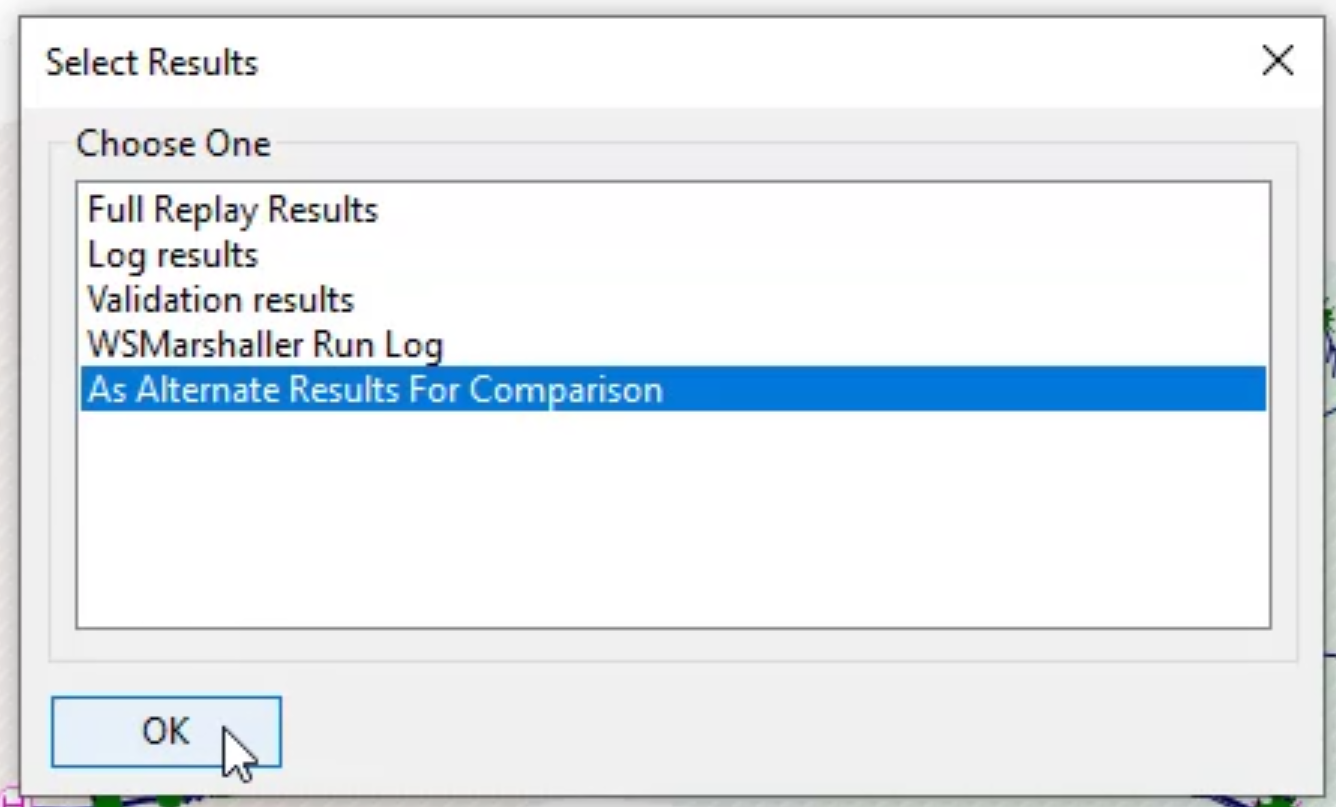
right click bridge con and select open as
02:03
in the dialogue, select as alternate results for comparison
02:10
In the toolbar, click the graph tool
02:13
then in the results window zoom in and click
02:16
a section of pipe just downstream from the pipe.
02:22
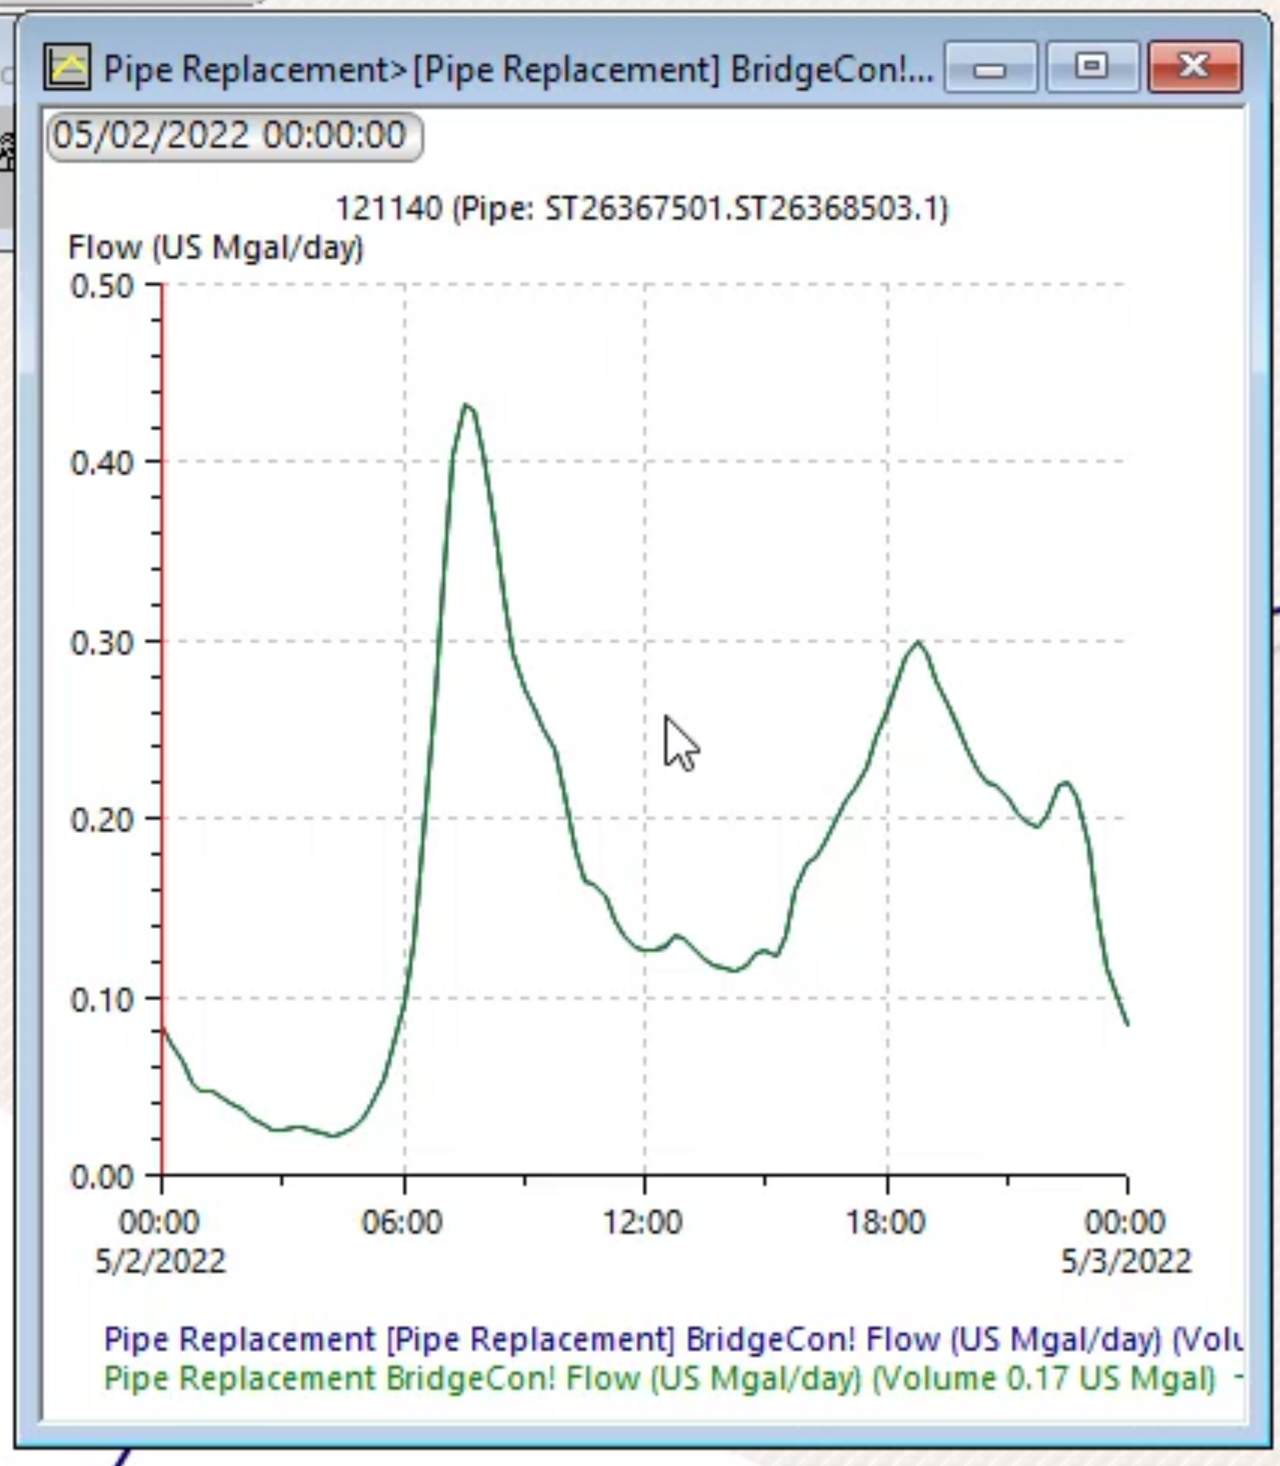
in the dialogue, select flow and then check the box next to graph alternate results.
02:30
A graph window opens showing the flow rates of both pipes.
02:34
The original and the new bypass pipe you created.
02:39
there is little noticeable difference between the two
02:42
as both graph lines largely overlap each other.
02:46
If there were significant differences,
02:48
you would need to adjust variables like
02:50
flow rate or friction coefficient to compensate,
02:53
close the graph window and the results window.