00:04
When using info works.
00:05
WS pro you will likely need to view the results of a simulation.
00:10
There are several ways to view those results in order to better understand how
00:13
a model is performing as well as making it easier to locate and address mistakes
00:19
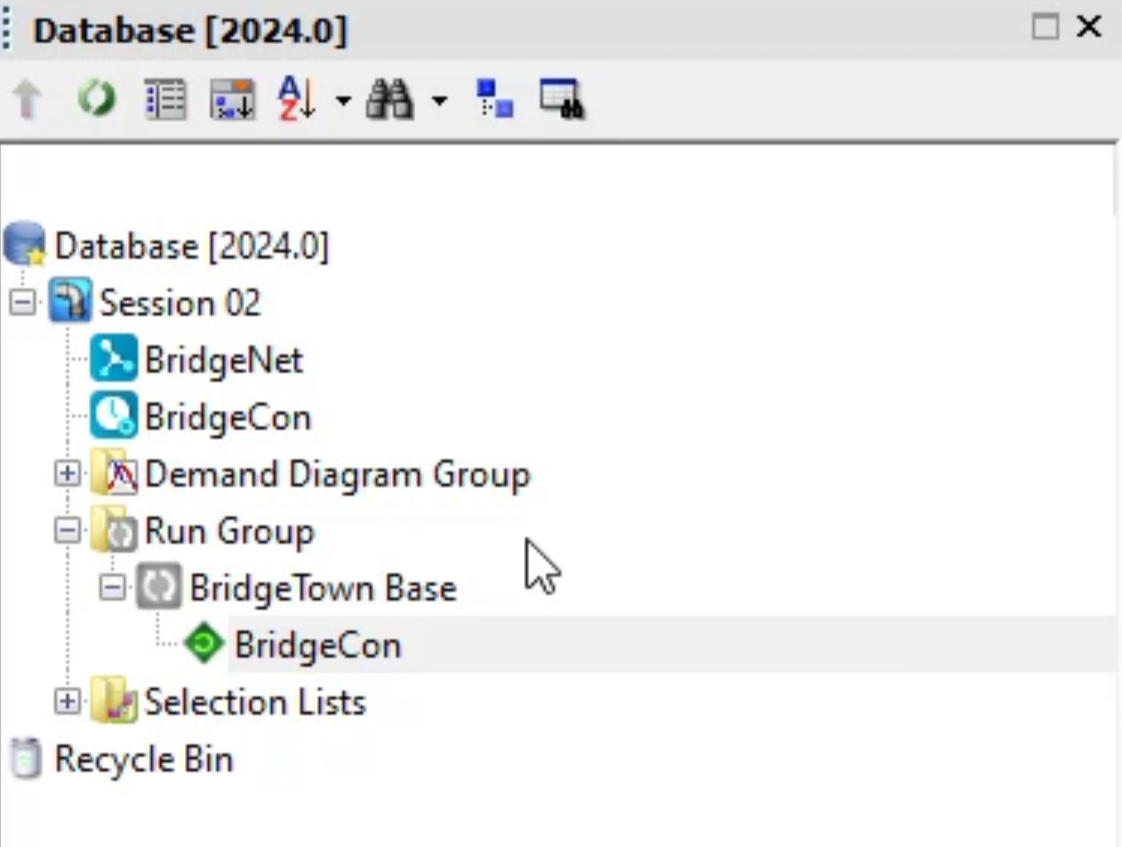
in the model group window, expand, run group and Bridgetown base
00:24
if bridge con is slightly transparent,
00:26
right, click bridgetown base and select rerun,
00:32
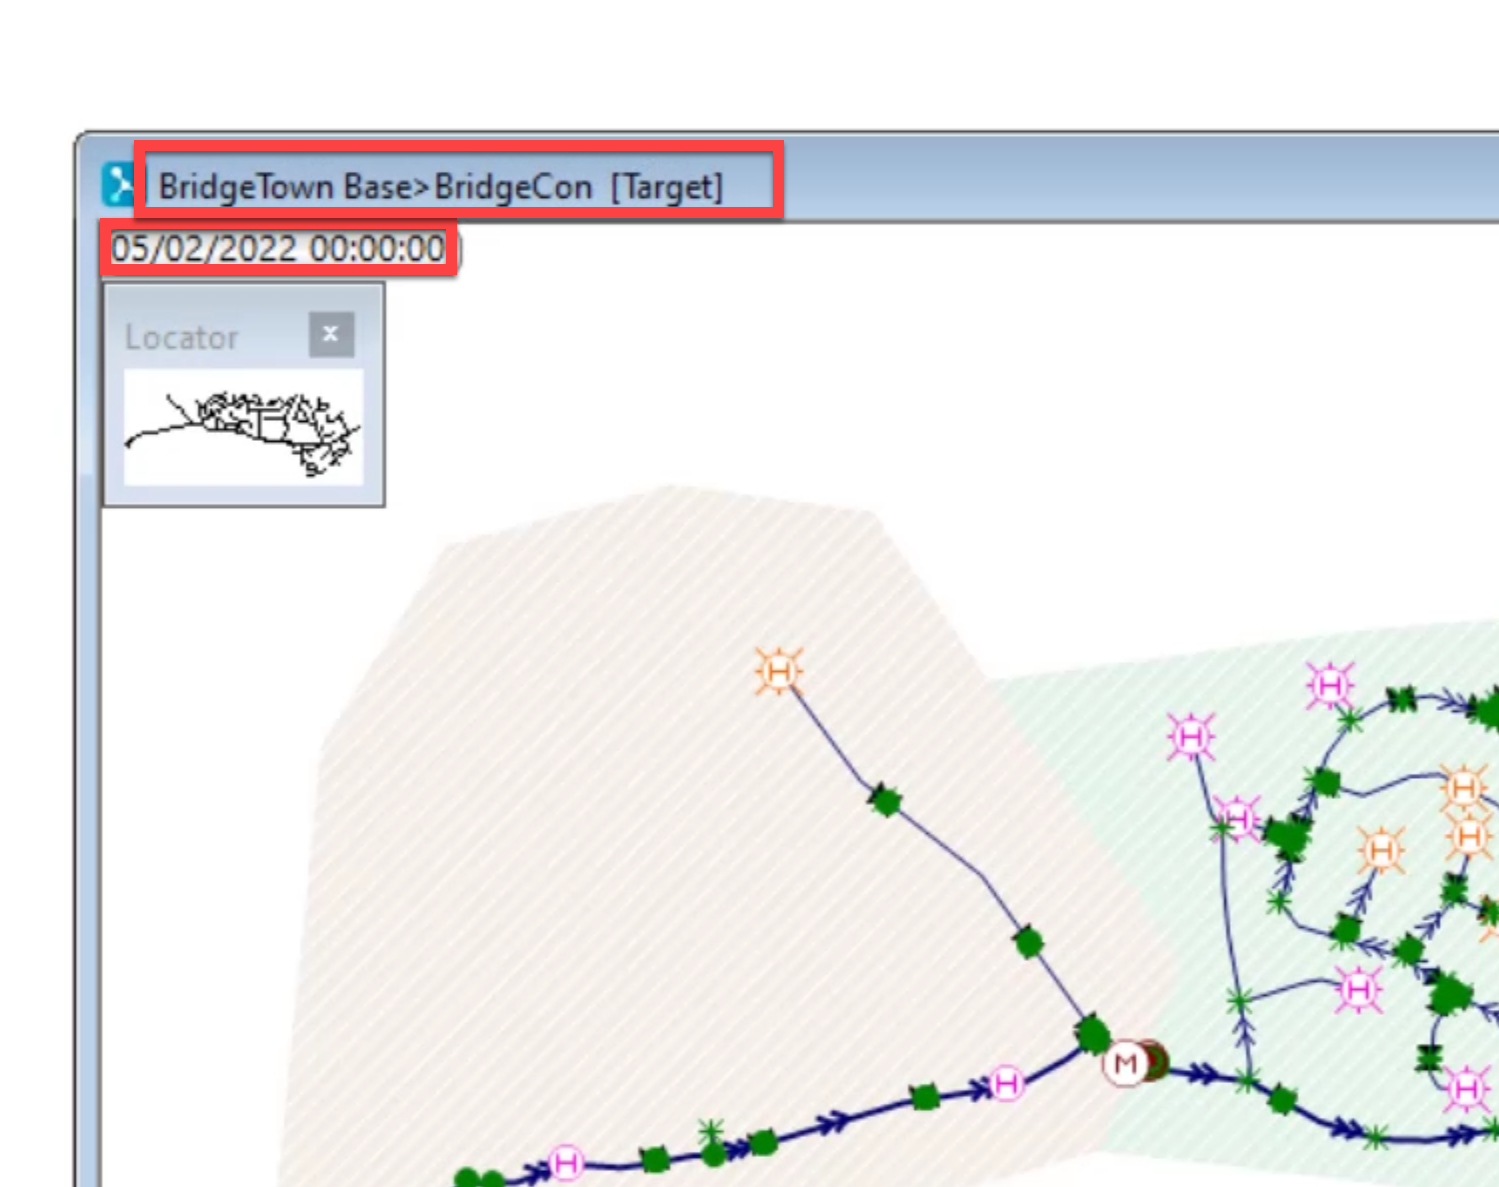
click and drag bridge con into the workspace to view its results.
00:36
It must be noted that simulation results are read only.
00:40
Therefore, changes cannot be made within the results GEO plan
00:45
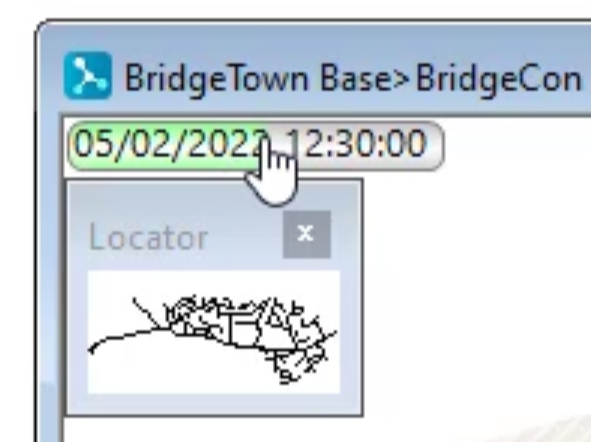
two elements indicate that this contains results data.
00:48
One is a panel that shows the date and time of when the model run occurred.
00:52
And the other is the right angle bracket separating
00:54
the names of the run group and the run.
00:59
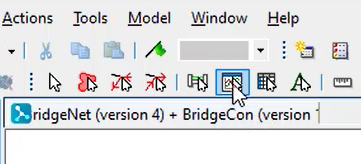
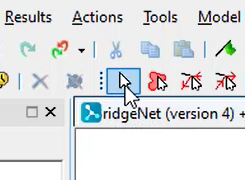
The graph tool is useful for reviewing simulation results for individual objects
01:05
in the toolbar, click the graph button.
01:08
Then with the Bridgetown based GEO plan still open, pick any object in the network.
01:14
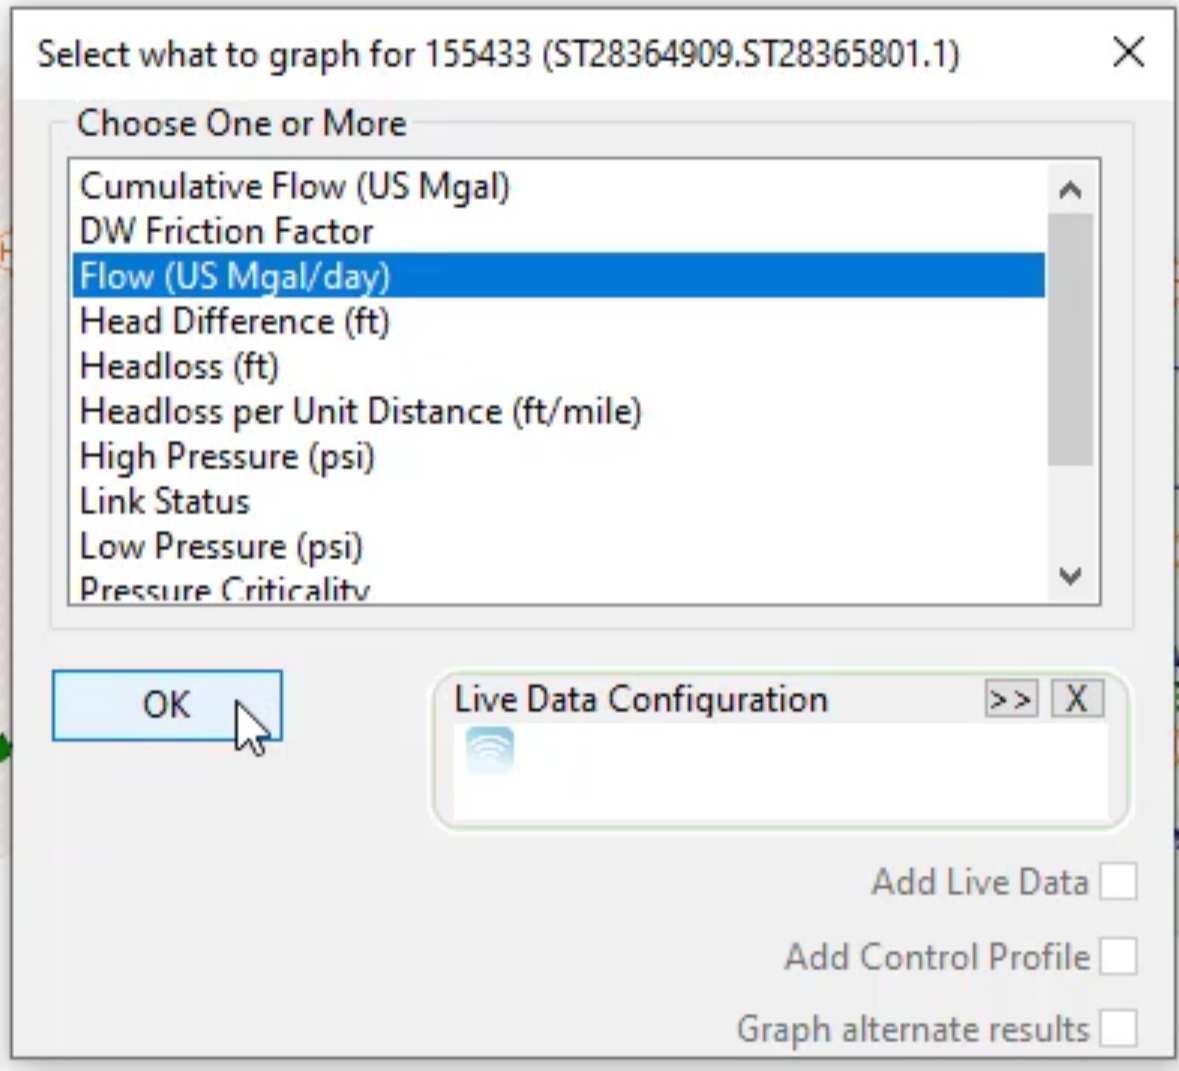
In this example, a pipe is selected,
01:17
this opens a selection dialogue in which you can choose from several options.
01:22
Click the flow liters per second option to highlight it. Then click OK.
01:28
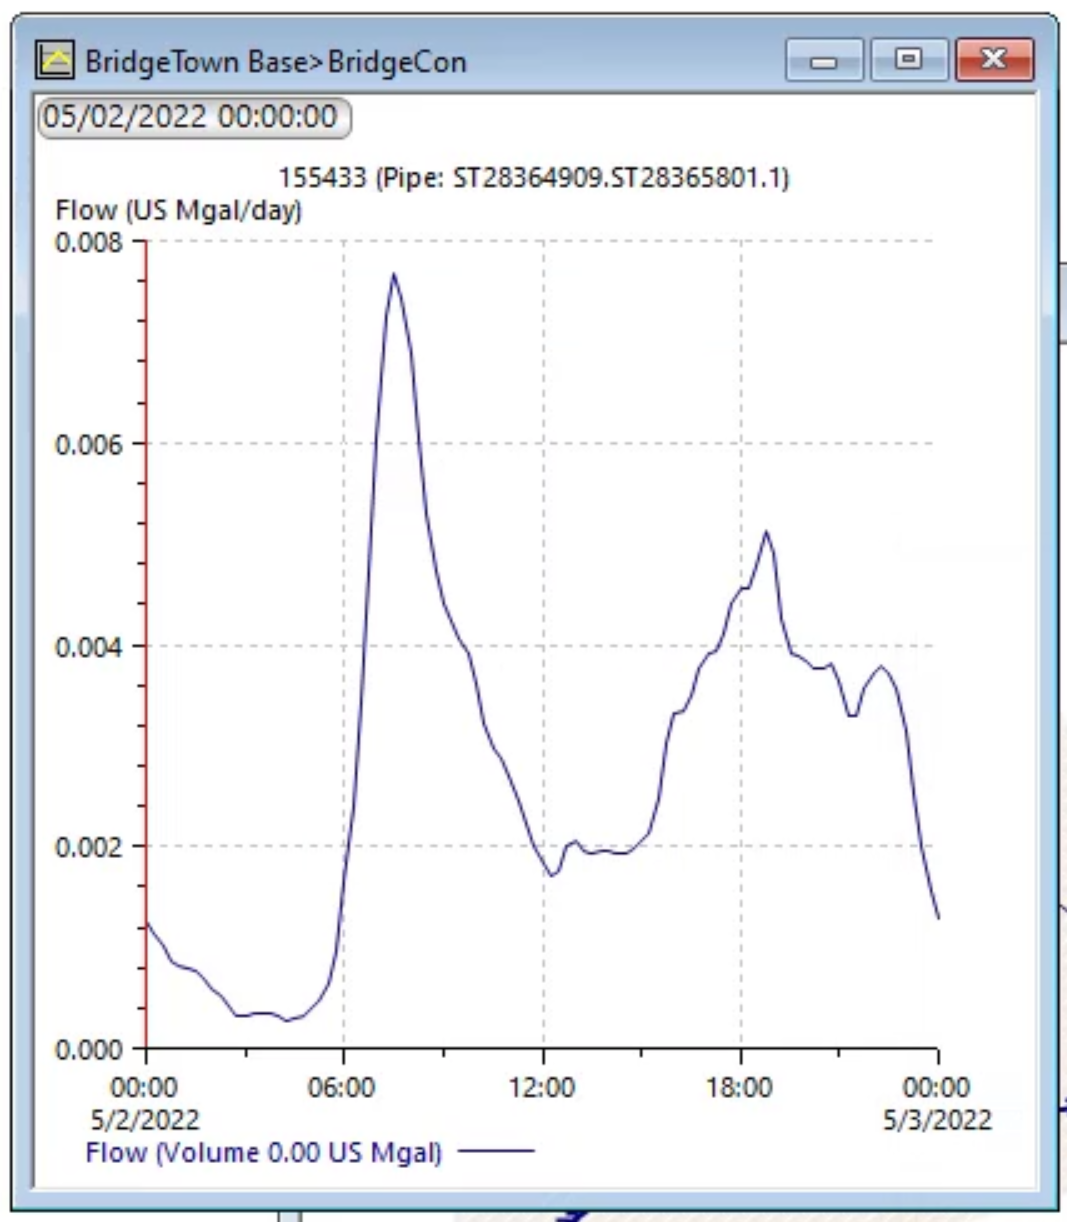
This opens a graph detailing the flow through the pipe,
01:31
the Y axis over a 24 hour period.
01:37
You can repeat this process with other objects in the network to view the results.
01:43
The green arrows on pipes depict the direction of water flow.
01:47
You can move through the simulation timeline by clicking
01:50
different points on the date and time panel.
01:52
With the left side of the panel being the starting point.
01:57
it shows the flow direction changing at various
01:59
times depending on the demand and velocity.
02:04
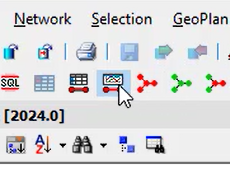
There may be times when you want to graph the results for more than one object at a time
02:09
in the toolbar, click the select tool,
02:13
then click any object in the network to
02:15
highlight it and while holding the control key,
02:17
click another object.
02:20
In this example, two pipes are chosen
02:23
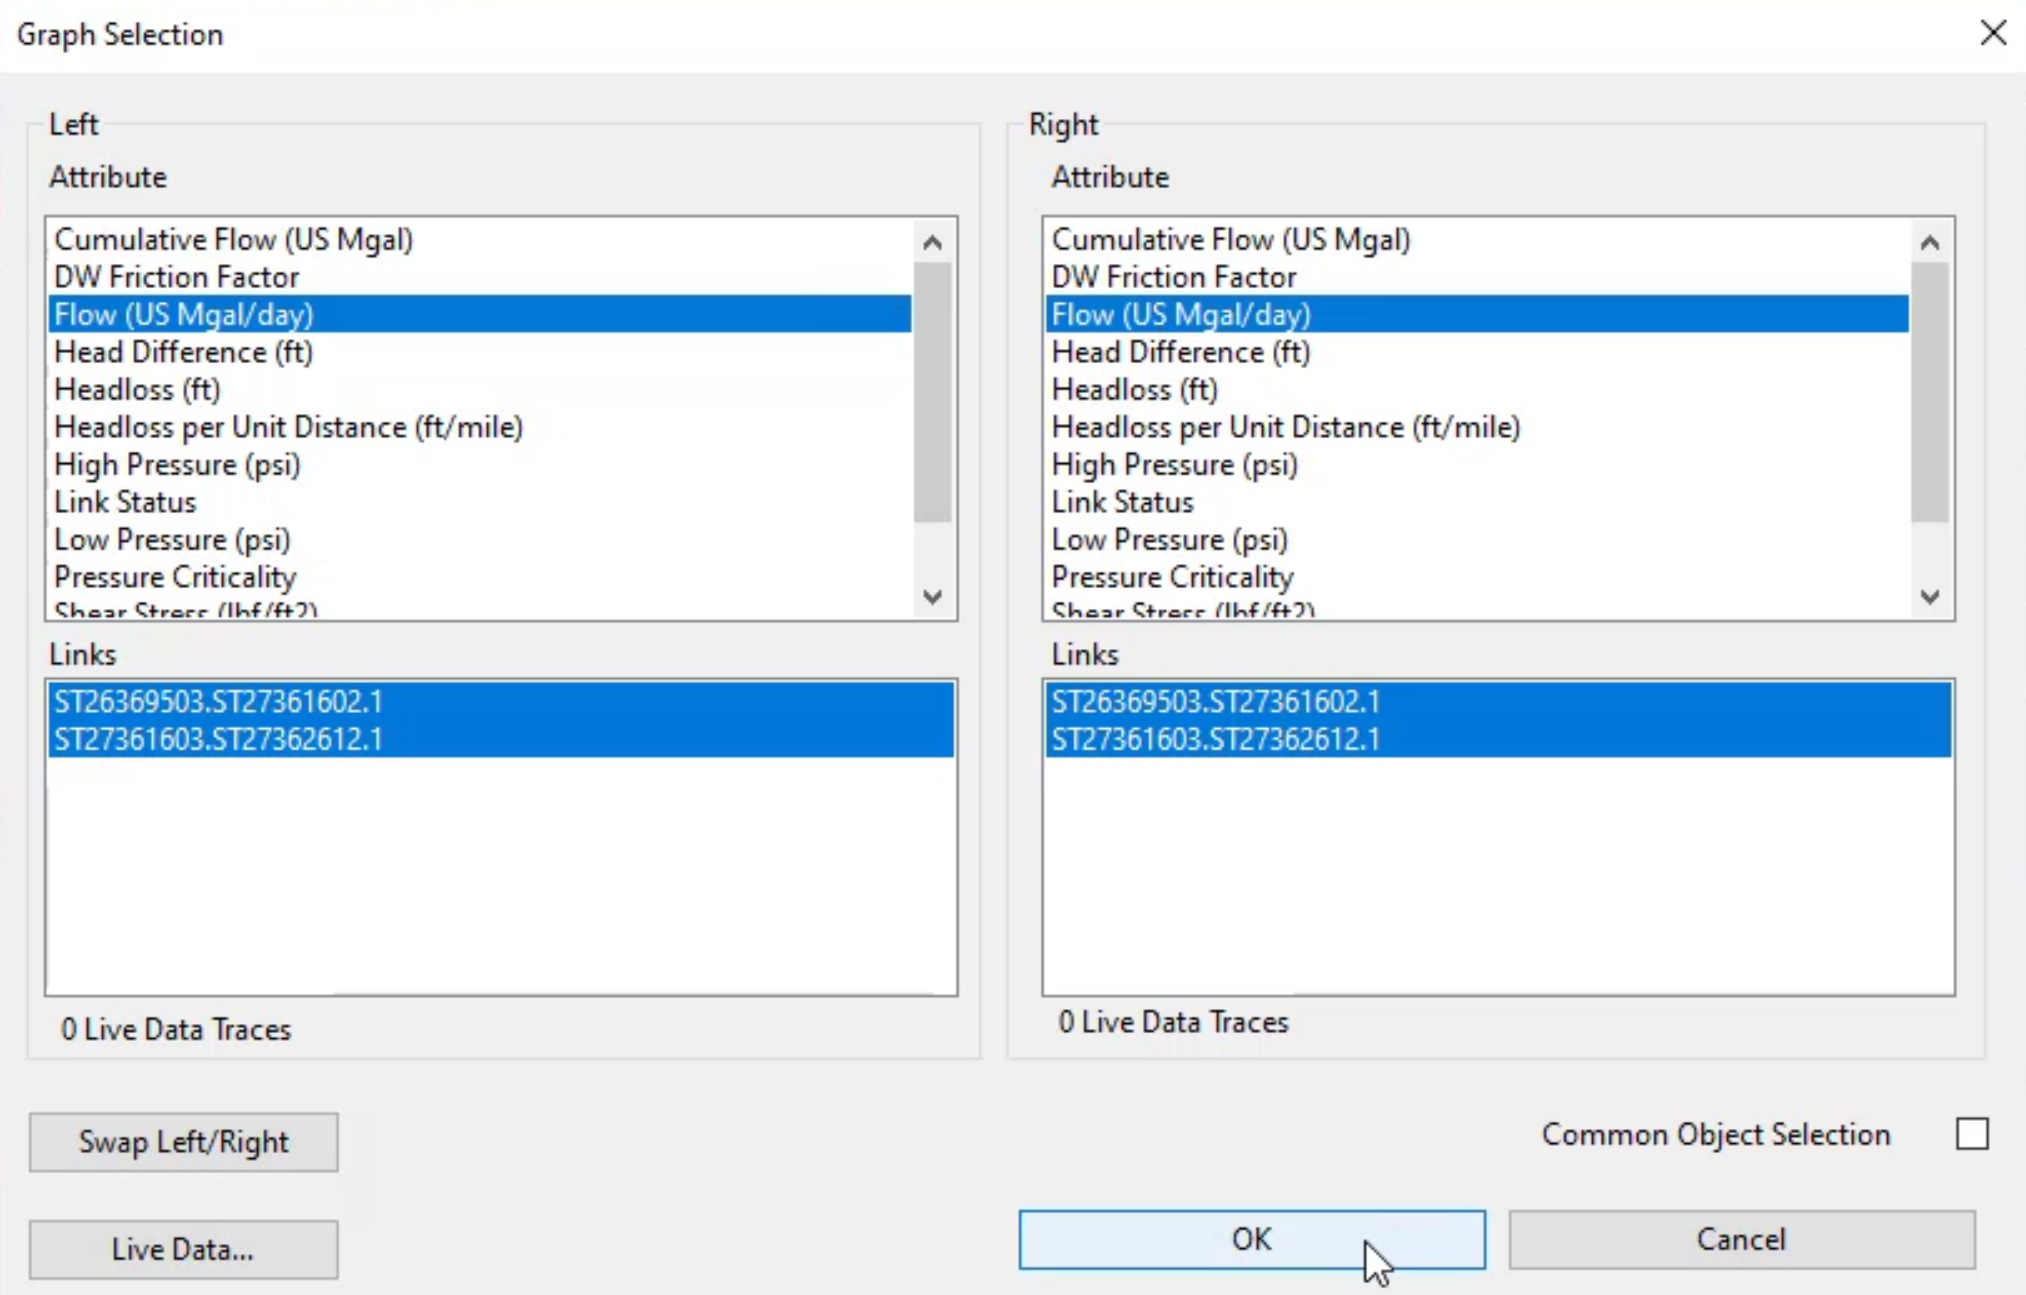
in the toolbar click graph selected objects to open the graph selection dialogue.
02:29
The dialogue shows a list of attributes for both objects.
02:33
In this example, flow liters per second is selected for both objects.
02:40
This opens the multiple objects window with a graph
02:42
that shows the flow of the two pipes simultaneously.
02:46
Be aware that you can graph the
02:48
results of different attributes for different object types
02:51
such as the flow through a pipe and the pressure in a nearby hydrant.
02:56
You can click different points on the date and
02:58
time panel which corresponds with the vertical red line
03:01
to see what each object was doing at that point in the simulation.
03:09
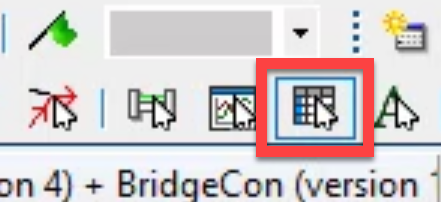
you can also view results in a grid format if you prefer
03:13
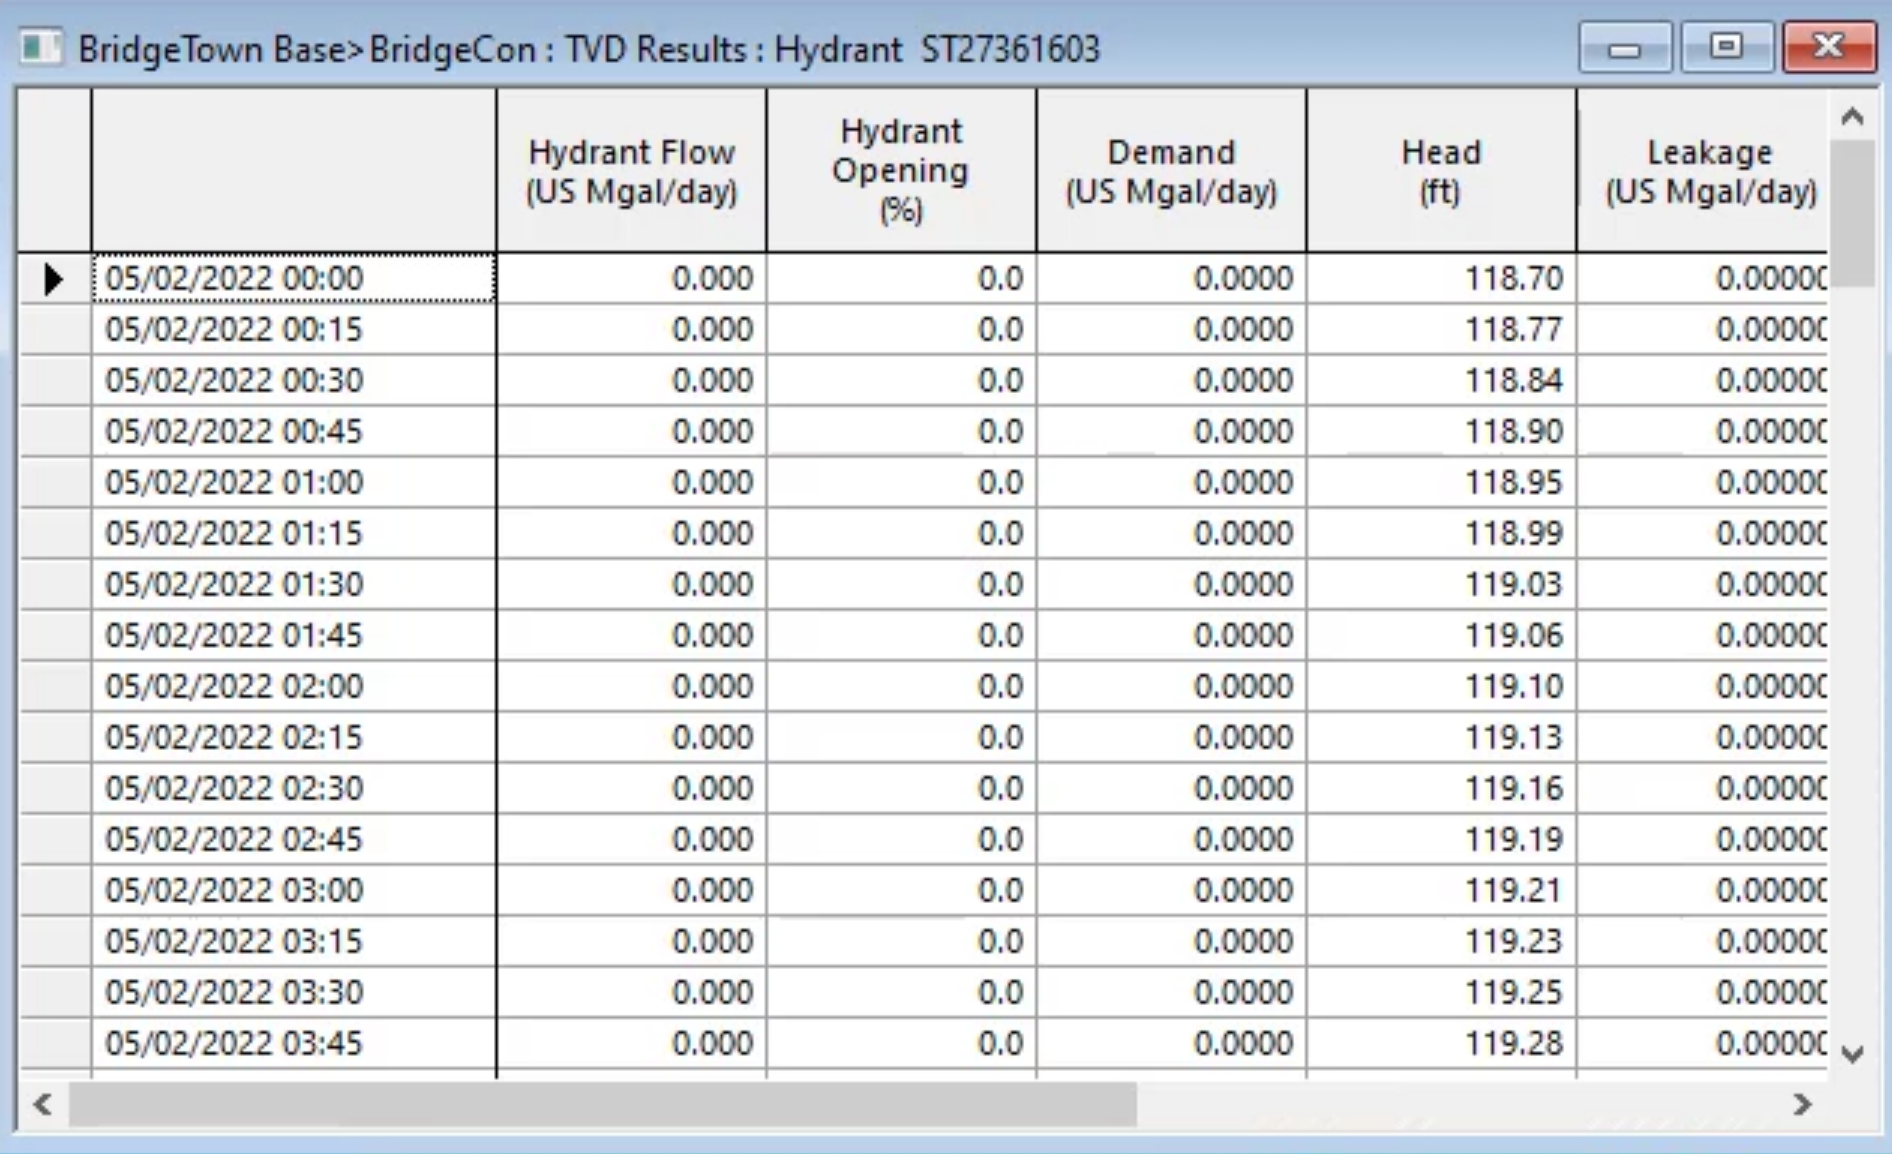
in the toolbar select grid and then pick an object in the network.
03:18
In this example, a hydrant is chosen,
03:21
this opens a grid showing the date and time by row in 15 minute intervals.
03:26
And the objects attributes listed by column headings
03:30
note that you can copy and paste this grid into Excel if needed.
03:37
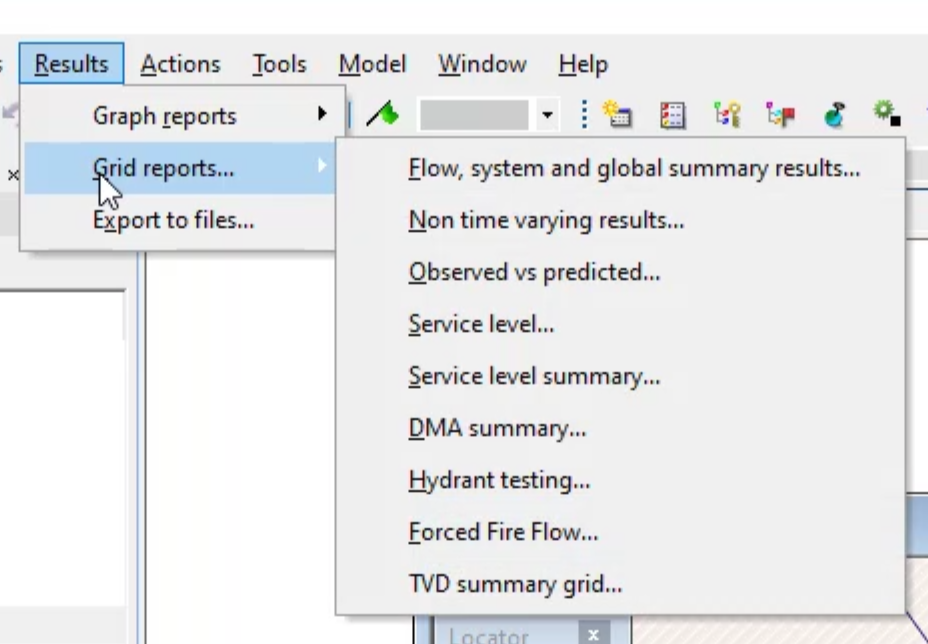
You can also view results by clicking the results
03:39
tab in the ribbon with options to graph results,
03:43
and export to files.
03:46
The first two options are for summary graph and
03:49
grid information with sub menus listing various results options,
03:54
click export two files to open the export results, data files,
03:58
dialogue where you can choose which data you want to export.