00:04
WS pro a demand area analysis provides data that allows users to
00:09
review the current demand for water and project future potential demand areas.
00:15
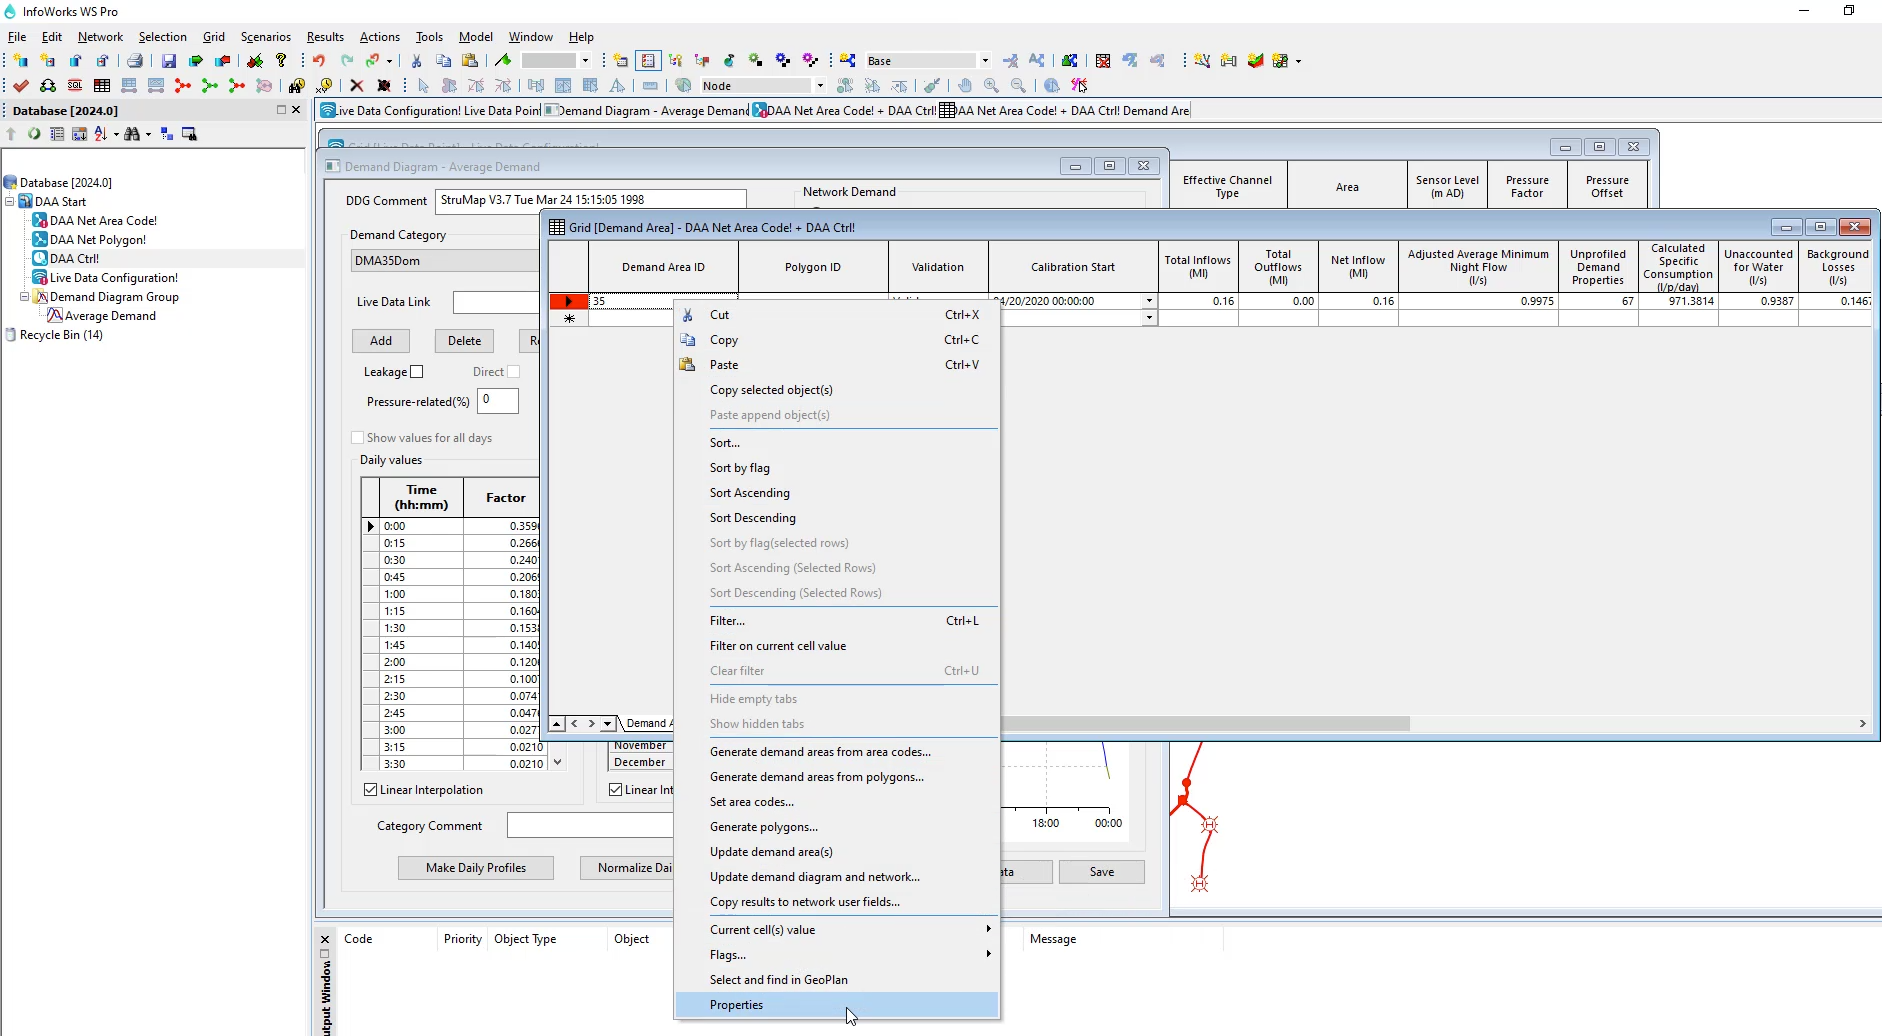
After generating demand areas from area codes with the demand area grid open,
00:19
you can view and edit a list of target points within the selected demand area
00:23
from the grid right, click demand area 35 and select properties.
00:28
The demand area 35 dialog box appears which
00:32
contains the properties for this specific demand area
00:35
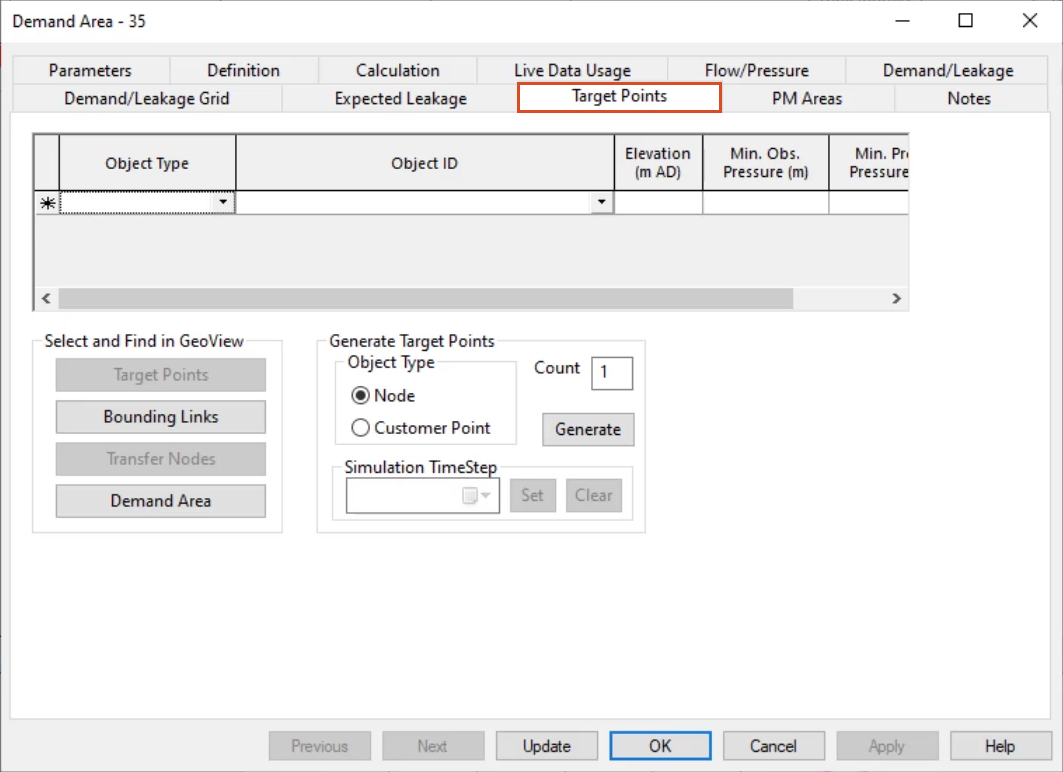
to view the results as a grid open the target points tab
00:40
the target points list defines nodes or
00:42
customer points for level or service monitoring.
00:46
These points can be selected manually or they can be
00:49
generated automatically based on either snapshot pressure results or elevations
00:56
for the selection to be based on results.
00:58
The simulation results must be based on the
00:60
same network and control that are currently being used
01:05
You will need to drag the results into the network
01:07
and control view so that they share the same window
01:11
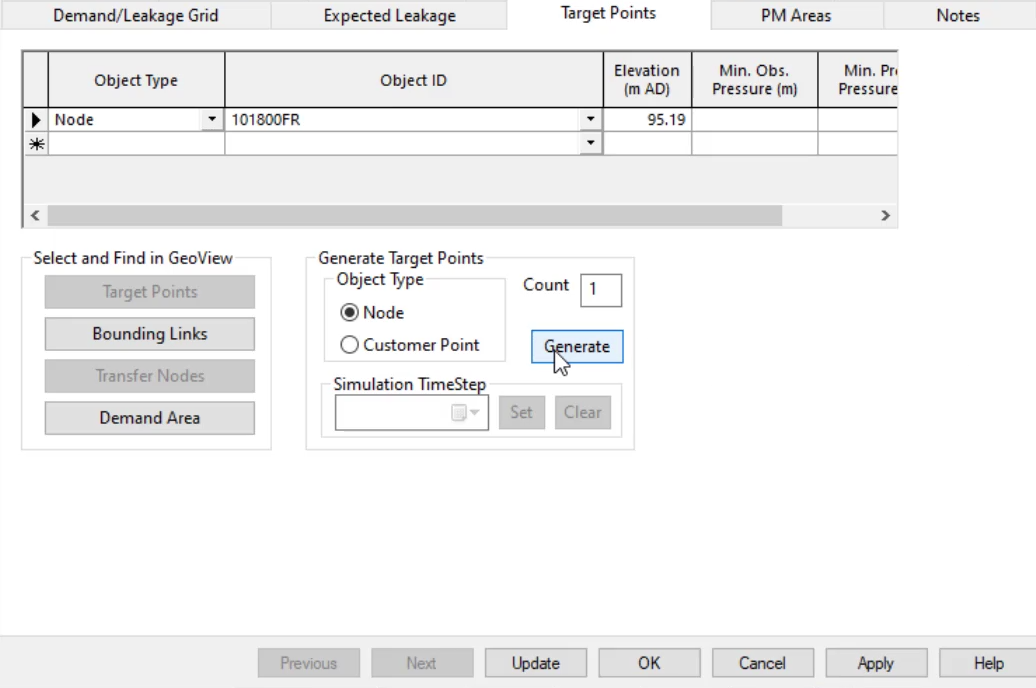
to generate a list of target points automatically from the generate target
01:15
points group specify the number of points to be generated such as one
01:19
select the type of point to be used either customer point or node.
01:24
In this case, select node
01:27
if there are simulation results open on the GEO plan click set
01:31
and then select a simulation time step,
01:34
finally click generate to generate a list of target points.
01:39
Without simulation results,
01:41
the list will be generated by searching for the
01:43
node or customer point with the highest elevation.
01:47
If there are simulation results open on the GEO plan,
01:49
then the list will be generated by searching for the node slash customer
01:53
point with the lowest pressure at the time step selected by the user
01:58
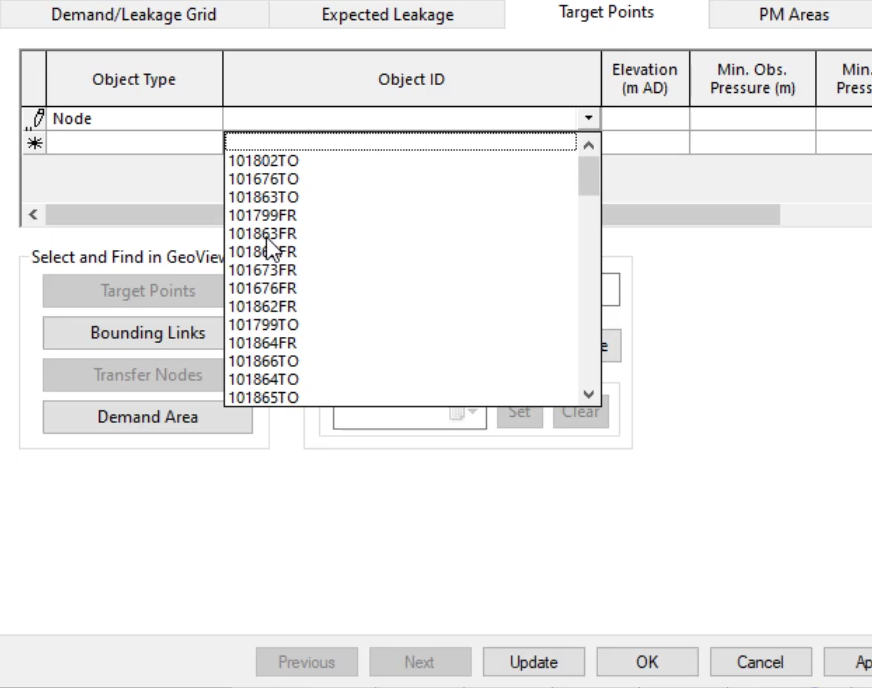
to define a list of target points manually from the target points grid,
02:02
expand the object type drop down and select node,
02:06
then expand the object ID dropdown and select an object ID
02:12
click update to populate the elevation field,
02:15
minimum observed pressure and minimum predicted pressure columns.
02:20
Note that the minimum observed pressure is
02:22
calculated only if live data are available
02:24
and the minimum predicted pressure is calculated
02:27
only if there are simulation results.
02:30
Viewing and editing the target point list allows you to ensure
02:34
reliable and efficient service to targeted points within a demand area.