00:03
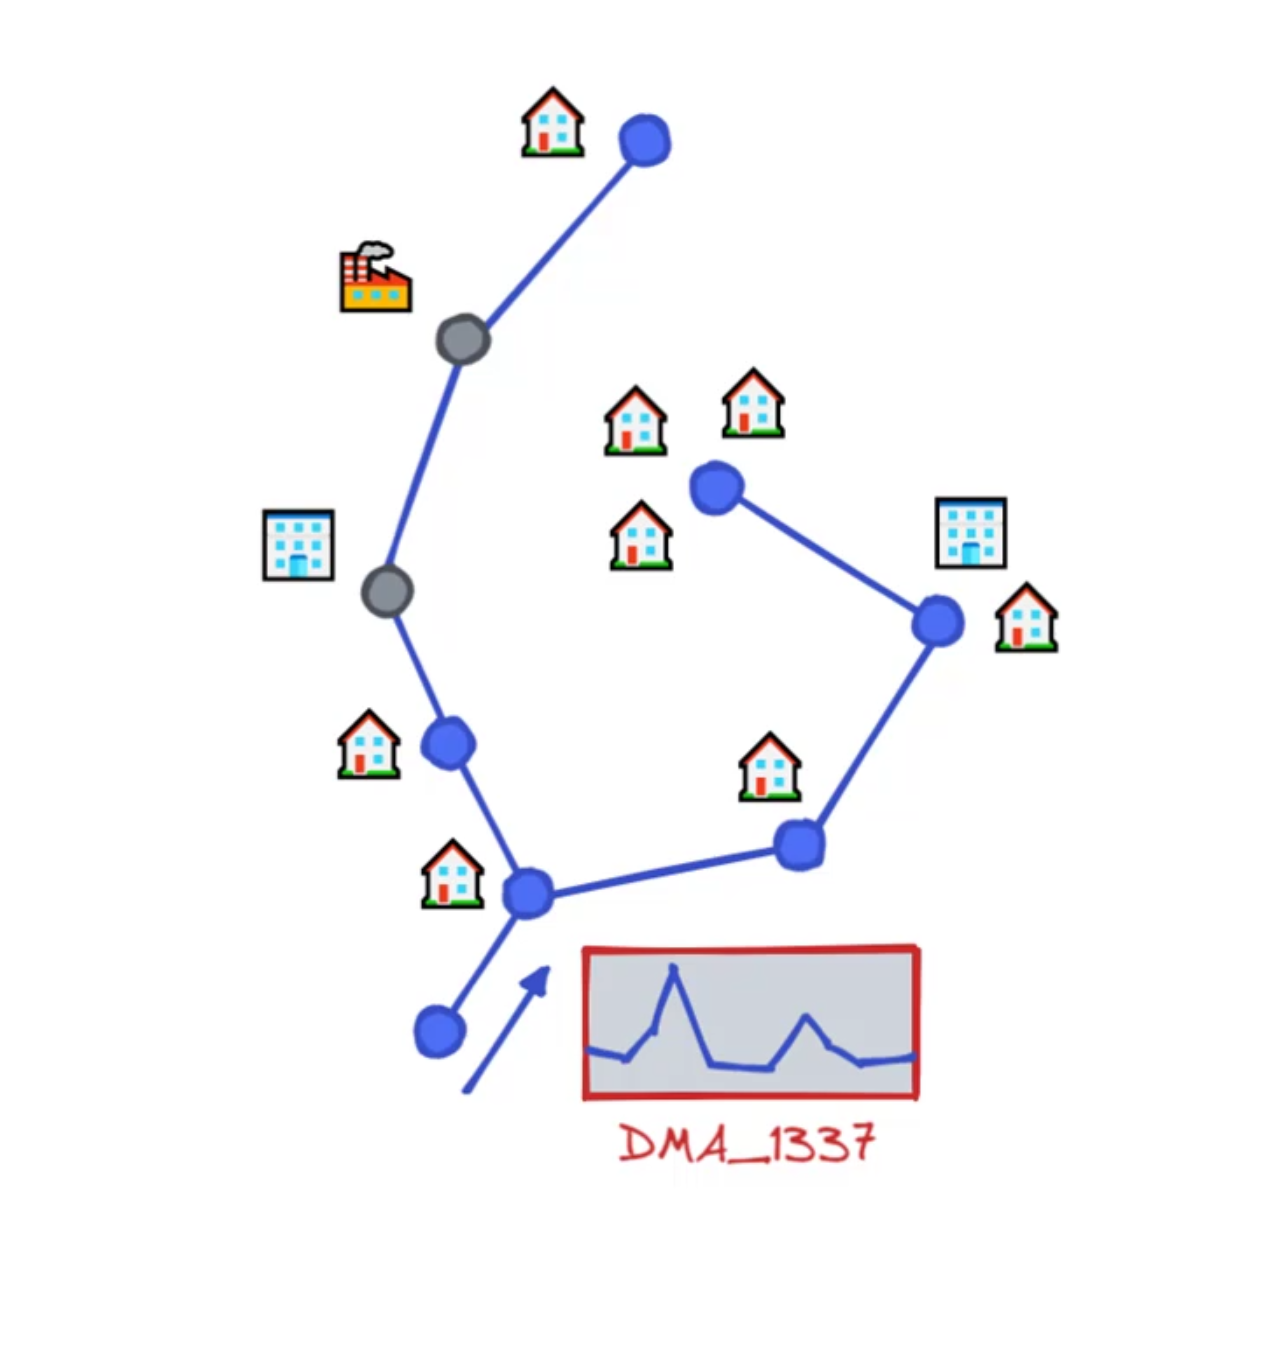
A network model also referred to as simply a model is comprised
00:07
of all the digital information that
00:09
represents a pressurized water distribution system.
00:12
These digital representations are used to simulate
00:15
different scenarios such as large scale hydraulics
00:20
WS pro the model is a combination of at least a network,
00:24
a control and a demand diagram file.
00:29
A model can represent an entire supply area or only a subset of an area.
00:34
Network models can be calibrated to represent a particular day
00:37
or scenario such as average peak or future demand.
00:43
When a model simulation runs,
00:45
the results will depict data such as flow and pressure.
00:49
These results can be visualized on the map
00:51
as tables grids or graphs.
00:54
The results can also be used to run statistical queries.