Step-by-step Guide
Setting up a live data configuration in InfoWorks WS Pro can sometimes be complicated, as the process can change, depending on the types of connections, and for what purpose.
Note: This example uses a relatively simple method involving a CSV database. This method would probably not be used in the real world, except for calibration purposes. However, it serves as an easily understandable example of the steps involved with connecting a live data configuration.
- Open a transportable database and import the file by copying and pasting it into the Database.
- Right-click the model group and select New > Live Data Configuration.

- The New Name - Live Data Configuration dialog box opens. The name “Live Data Configuration” appears by default. Click OK.
The Live Data Configuration now appears under the model group.
- Double-click the Live Data Configuration to open a blank grid.
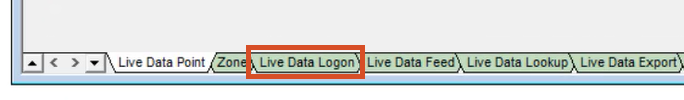
At the bottom of the window, there are several tabs, including Live Data Point, Zone, and Live Data Logon.
- Click the Live Data Logon tab to open it.
This is where you will tell the model where to look for the databases you want to connect to and enter any other relevant information.
It is best practice to work in the Live Data Logon tab first when connecting to a new database.
- Click the cell in the first row of the Connection Name column.
- Enter the name "Bridge".
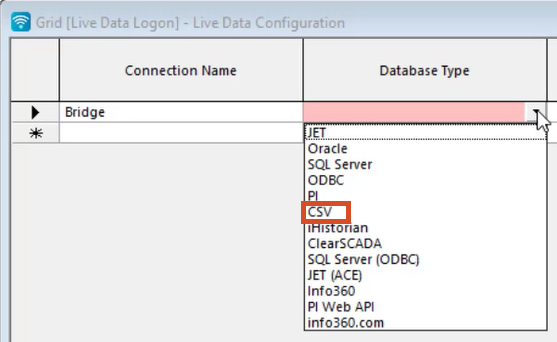
- In the first row of the Database Type column, expand the drop-down on the right side of the cell.
There are several live data connection options, including JET, Oracle, and SQL Server.
- Click CSV.
Note: If the database were in a different time zone than your own, then you would expand the drop-down under the Time Zone column and select the appropriate one. In this example, no time zone is selected.
- Click the cell in the row below CSV in the Database Type column, then scroll to the right.
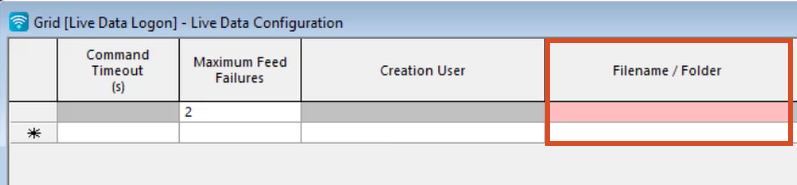
All cells in the first row are now grayed out except for the cell under the Filename / Folder column, which is red. A red cell indicates that there is required data that is missing and will change depending on the type of database you choose. For example, if you set the database type as an SQL Server, several additional cells highlight in red. Generally, more complex database types require more information.
- Change the database type back to CSV.
- In the first row under the Filename / Folder column, copy the file path Data > Live Data and paste it into the cell using CTRL+C and CTRL+V.
- Right-click the left margin of the first row and select Test connection....
In this example, a notification appears to tell you the connection test was successful.
- Click OK or close the notification.
In the event of a failed connection test, the notification would list the causes, such as an incorrect username or insufficient permission.


