Step-by-step guide
InfoWorks WS Pro’s critical link analysis, or CLA, run type allows automated testing and reporting of the effects of failure of a selection of links. First, define the time of outage and method of failure for the selected links. Then, a simulation is run either for each selected link, or for each isolation area in the selection, in turn.
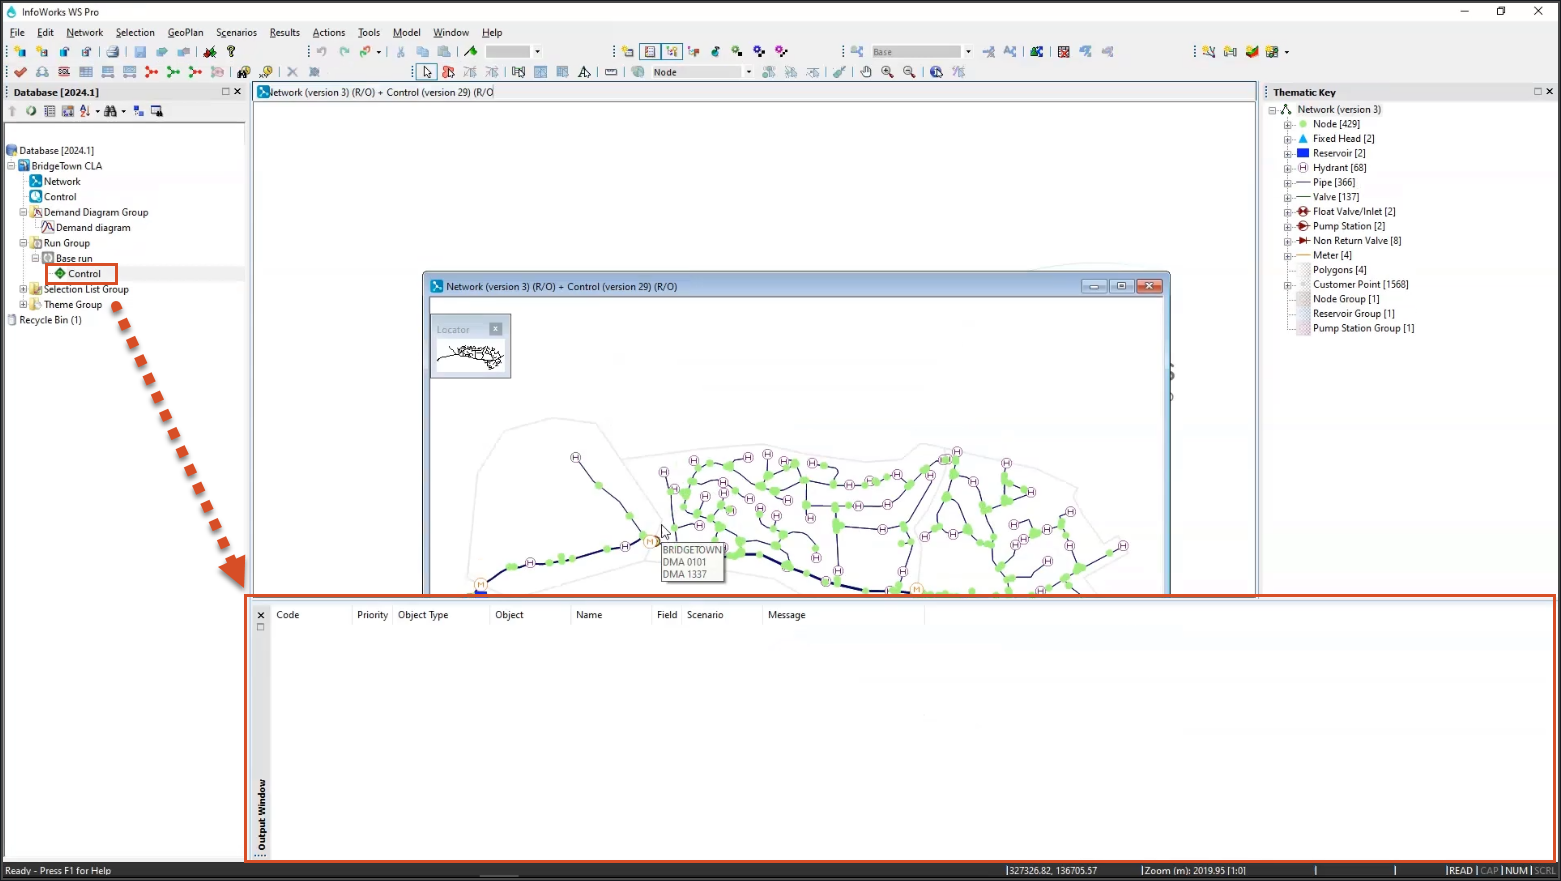
- It is best practice to start with a base run. In the Model Group, right-click the Run Group.
- Select New > Run.
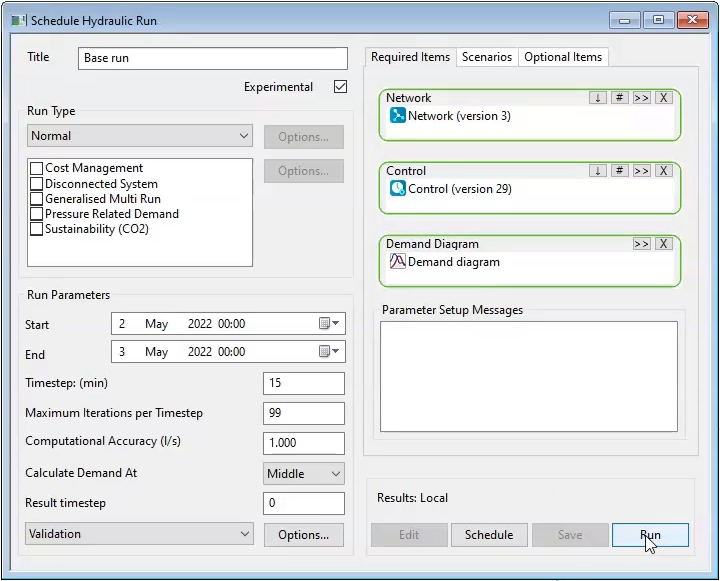
- In the Schedule Hydraulic Run dialog box, Title field, type “Base run”.
- Enable Experimental.
IMPORTANT: Check the validity of the baseline by right-clicking Control simulation > Open As… and selecting Validation Results. No errors or warnings in the Output window means that the model is suitable to perform a CLA.
- From the Model Group, drag and drop Network, Control, and Demand diagram into their respective panes in the dialog.
- In the Run Parameters group box, adjust Start date and time to May 2nd, 2022, at midnight.
- Change the End date and time to May 3rd, 2022, at midnight.
- Click Save.
- Click Run.
Note: To find the exact number of pipes in the entire network, click the Network menu and select Network overview.
To create the CLA run:
- Right-click Run Group.
- Select New > Run.
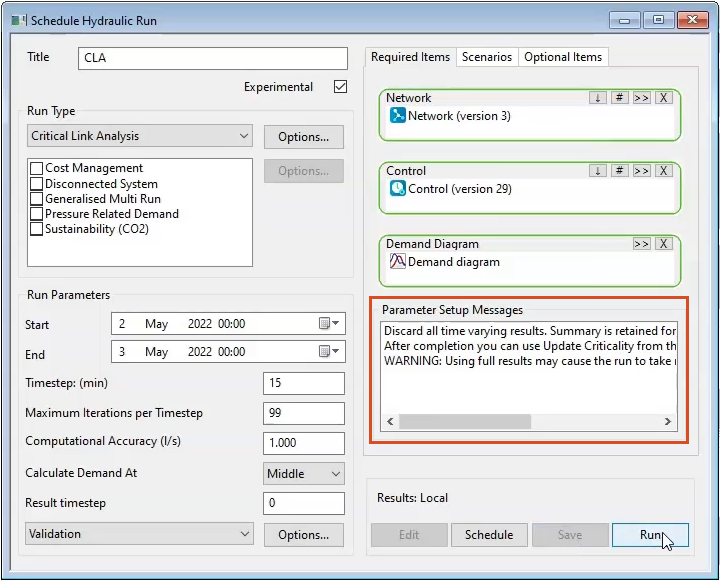
- In the Schedule Hydraulic Run dialog, in the Title field, enter “CLA”.
- Enable Experimental.
- Drag and drop the same Network, Control, and Demand diagram as were used for the base run.
- In the Run Parameters group box, adjust the Start time to May 2nd, 2022.
- Adjust the End time to May 3rd, 2022.
- In the Run Type group box, expand the drop-down menu and select Critical Link Analysis.
- From the Model Group, drag the Pipes selection list and drop it into the Selection List pane.
Note: The values in the Minimum Pressure group box. In this example, the minimum pressure is set to 10, and the duration is set to 30 minutes.
- In the Failure count type: group box, enable Customer Points.
In the Single Pipe or Isolation Area group box, select whether a single link or a group of links in an isolation area is to be closed for analysis:
- Close single link for each test: Each link included in the selection list is closed and simulated one at a time.
- Close isolation area for each test: For each isolation Area Code found in the selection list, all links in the isolation area will be closed and simulated at once. There will be one simulation run per isolation area.
- Keep Close single link for each test enabled for this exercise.
Note: When working on large models, enable Discard time varying results so that the CLA will only generate a summary report and criticality values.
- Enable Discard time varying results.
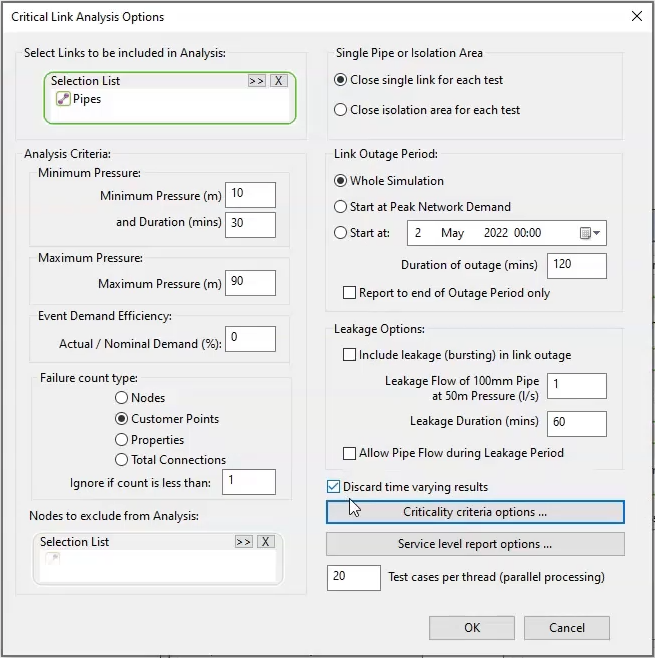
- Next, click Criticality criteria options… to open the Criticality Criteria grid.
- Adjust the values in the Below Minimum Pressure column, starting in the first row: 0, 20, 50, 100, and 150.
- In the Isolated (Count) column, change the values to: 0, 10, 20, 30, and 40.
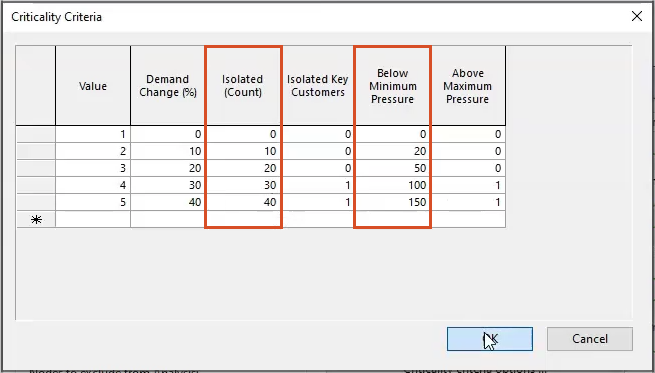
- Leave the default values in the Isolated Key Customers column.
- Click OK.
- Click OK again to close the Critical Link Analysis Options dialog box.
- Back in the Schedule Hydraulic Run dialog, click Save.
- Click Run.
A notification appears with the number of simulations the CLA will run, and that it may take a long time.
- Click Yes to continue.


