00:04
WS pro is capable of modeling water quality in a
00:07
network tracking dissolved substances as they travel through it,
00:13
water quality runs especially those dealing with chlorination tend to
00:17
happen over an extended time to create a more stable simulation
00:22
You will set a baseline chlorination for all nodes in the
00:25
network that will represent the residue chlorine within the network.
00:29
Then you will simulate the reservoir being regularly dosed with
00:32
chlorine to maintain a concentration level throughout the network.
00:36
First open session two bridge net into the GEO plan.
00:41
Select the create scenario button
00:44
name the new scenario, water quality
00:49
enable the create matching scenario in the control
00:52
option by clicking on the selection box.
00:57
Ensure that the water quality scenario is open
01:01
zoom into the reservoir on the left side of the network.
01:04
Double click node 54421 to view its properties,
01:11
expand water quality
01:15
in the cell next to water quality concentration.
01:18
Click more the button with the ellipsis.
01:22
A profile graph opens
01:25
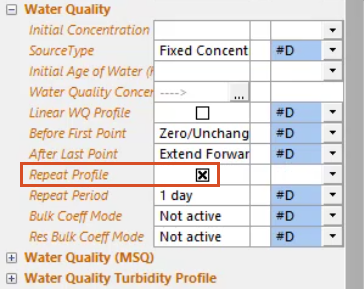
in the first row of the date time column, expand the dropdown and select 2nd May 2022
01:32
leave the time of day set to midnight,
01:35
set the concentration to one
01:38
in the second row. Set the date to the same as the first row and adjust the time to 0 800
01:44
set the concentration to 100
01:48
in the third row. Set the date to the same as the first row and adjust the time to 1400.
01:55
Set the concentration to one
02:00
Check the box next to repeat profile,
02:04
set the same dates times and concentrations for the other reservoir node.
02:10
You can do this easily by clicking and dragging your
02:13
cursor to select the values from the first node.
02:19
right click in the left margin of the table in the
02:21
second nodes profile graph and select paste from the sub menu.
02:28
Commit the changes to the database.
02:30
Now you'll need to create a new solute data object to test in the system.
02:35
You do this by assigning the properties of a substance. In this case, chlorine
02:40
to the solute data object,
02:44
right? Click the model and select new solute data group.
02:52
Then right click the new salute data group and pick new sou
02:58
in the following dialogue name the new solute
03:02
press enter or click. OK.
03:05
Chlorine now appears in the salute data group.
03:10
a window arranged by tab appears each with a
03:13
grid for customizing the properties of the solute data
03:18
in the basic water quality tab set the solute to be a conservative substance
03:23
set a value of five for initial concentration for unset nodes
03:27
and set the concentration limit to be 500
03:34
Now create a new run using the bridge net and bridge con network and control
03:43
name it water quality dash chlorine, same as the new solute data.
03:50
Make sure to enable the experimental option
03:54
in the scenarios, tab disable the base scenario
03:58
and enable water quality.
04:00
You will need to run this model for an extended time.
04:03
So in the run parameters group box, adjust the end field to 0905 2022.
04:12
In this example, the start field is already set to two May 2022
04:17
a week before the end of the run.
04:20
It is not necessary to adjust the exact time for either field
04:26
in the run type group box, expand the dropdown and pick water quality
04:31
with the water quality options.
04:32
Dialogue, open click and drag the chlorine solute data into the solute group box.
04:38
Note that if you close this dialogue,
04:40
you can easily reopen it by clicking the options button in the run type group box.
04:49
In the schedule, hydraulic run dialogue, click save and then run
04:57
the simulation results now appear under the water quality chlorine run
05:02
click and drag the results to the GEO plan
05:09
in the toolbar, click the graph tool,
05:13
select a node and double click it to open the list of data to graph four.
05:18
In this example, select concentration 01 and then click. OK.
05:23
Notice that it is possible to include more than
05:25
one substance at a time in a simulation.
05:28
So it is possible to compare how the concentrations of each dissipate over time.
05:34
In this case, concentration, one represents the chlorine data object.
05:39
If you had added more than one solute data object,
05:42
they would also appear in this list.
05:45
A graph opens showing how the concentration of
05:47
chlorine changes at the selected node over time.
05:52
Because the node selected in this example
05:54
is immediately downstream from the reservoir.
05:57
The initial concentration is low around five mg per
06:00
liter and then increases suddenly as the chlorine arrives,
06:05
you can graph the concentrations at other nodes
06:07
in the network to see how they behave.