00:03
the pond currently has an estimate for its volume,
00:06
which has been calculated using the quick storage estimate
00:10
now that the inlets,
00:11
outlets and overflows have been defined.
00:14
It is time to accurately size the pond using dynamic simulation
00:19
with a model open in the ribbon analysis tab criteria,
00:24
panel click analysis criteria.
00:28
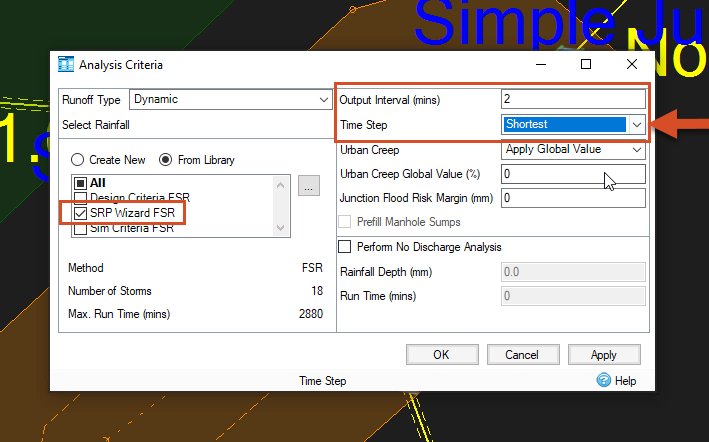
In the analysis criteria dialog,
00:30
make sure that only the box next to srp wizard
00:33
F S R is checked so that there are 18 storms
00:38
Set the output interval to two minutes.
00:42
The time step drop down is set to default but for this example,
00:45
change it to shortest to give the model the best chance of producing stable results.
00:51
When running simulations,
00:52
you must strike a balance between getting accurate results
00:56
and how long it takes to get them.
00:59
Complex models require complex hydraulic calculations,
01:02
so setting the time step two shortest will
01:05
make for a longer but more stable simulation,
01:11
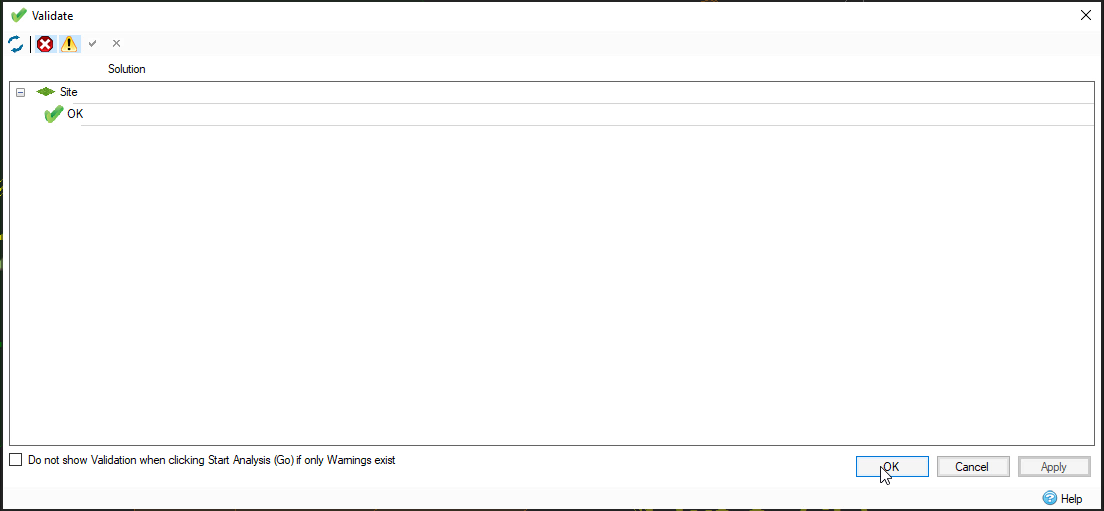
In the analysis panel click validate
01:14
in this example. The validate dialogue shows no errors.
01:19
If there were any, for example, a pipe or orifice missing a crucial measurement.
01:24
You would double click each listing to see what caused it
01:27
and resolve each. one
01:29
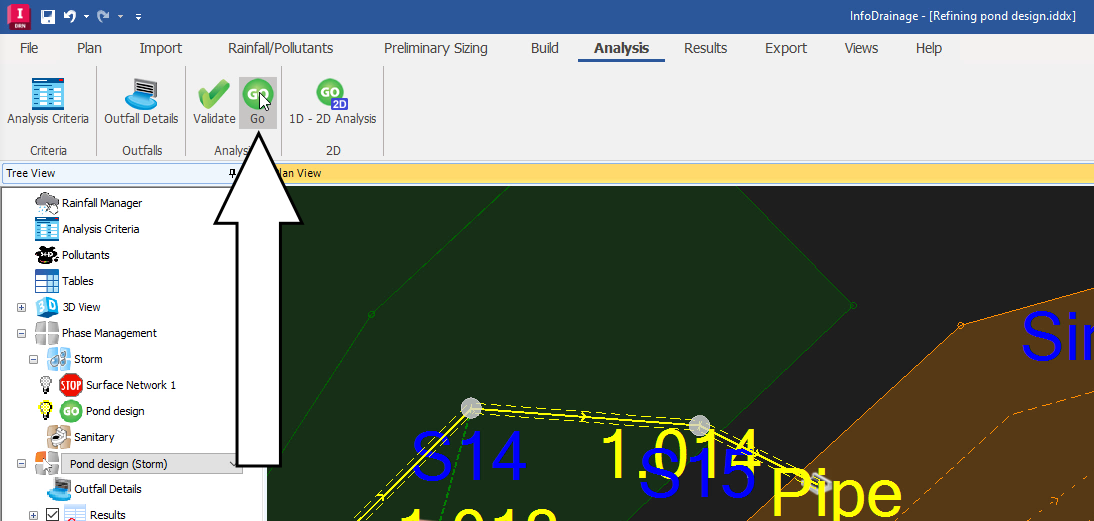
click OK to close the dialog and then save your progress
01:34
in the analysis panel, click go to run the simulation.
01:39
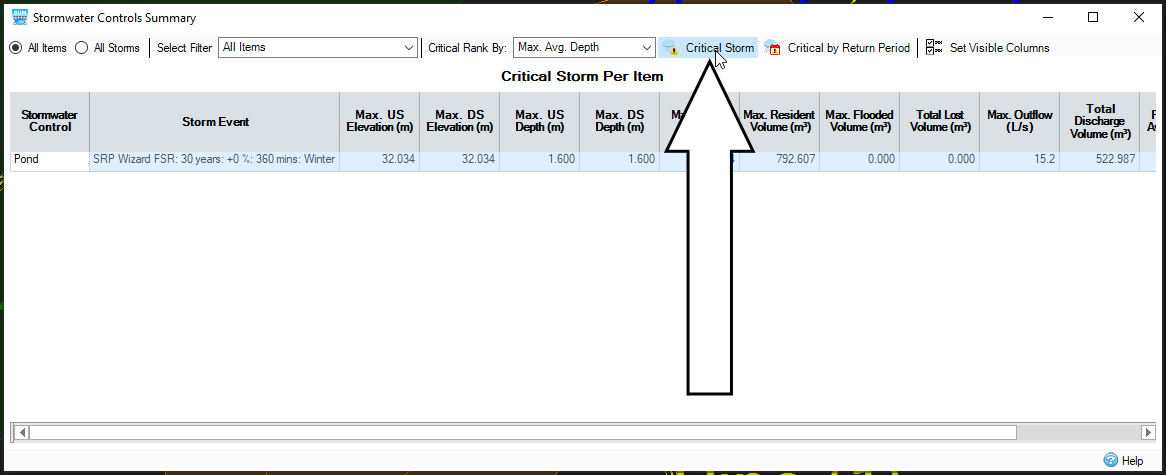
Once it is finished,
01:40
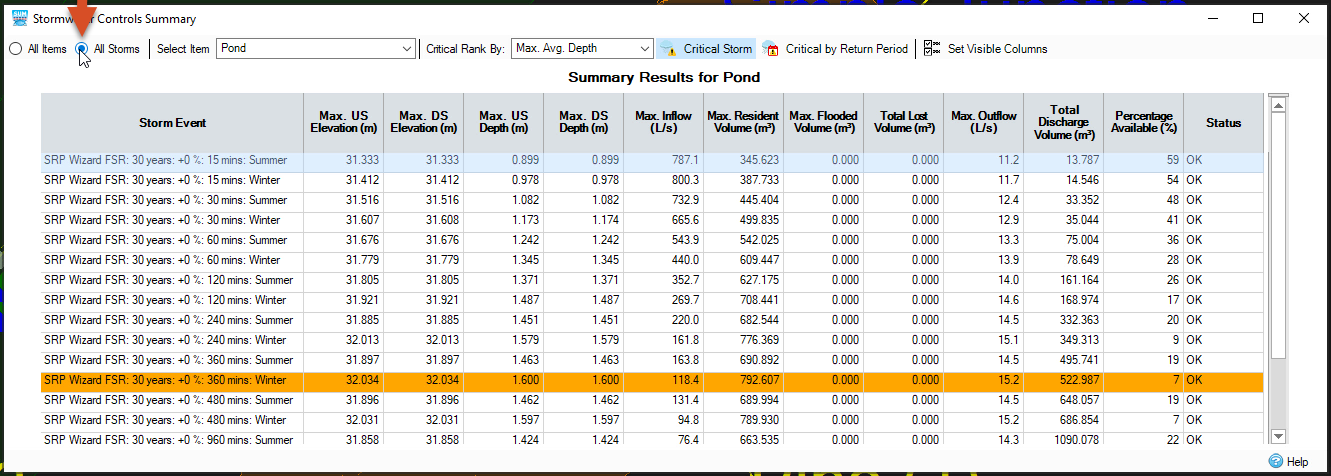
the storm water controls summary displays the results
01:43
for 1 30 year summer storm event.
01:47
It includes details like the ponds total discharge volume and the percentage
01:51
of the pond that was still available to fill during the storm
01:55
Click critical storm to see the results of the most severe weather event
01:60
in this case a 360 minute winter storm.
02:04
You can also enable all storms to see
02:07
how the model fared during different rainfall events.
02:09
With the critical storm highlighted.
02:12
The critical storm lists a percentage available of seven
02:16
which indicates the pond is slightly oversized.
02:19
But keep in mind that this pond was designed using rough estimates.
02:24
Close the summary and save your progress
02:28
to make the pond smaller
02:29
in the results. Tab summaries panel select stormwater controls
02:35
again, click critical storm and make sure all storms is toggled on.
02:41
In order to resize the pond,
02:43
you must consider its maximum resident volume during the critical storm
02:52
this measurement provides a guideline for re
02:54
sizing the pond as its maximum depth and
02:57
outflow or discharge are both less than the
02:60
values established in the original design criteria.
03:06
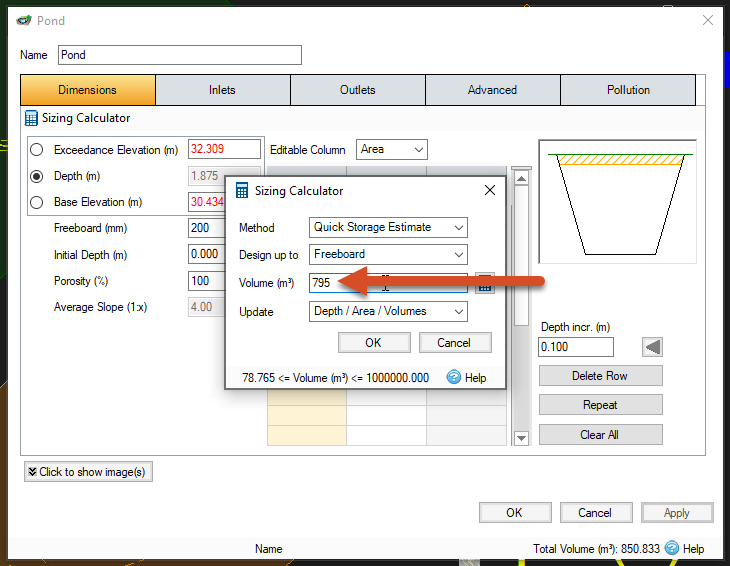
double click the pond icon to view its properties and open the sizing calculator,
03:11
Enter a new volume of 795, slightly more than the 792 from the simulation results.
03:20
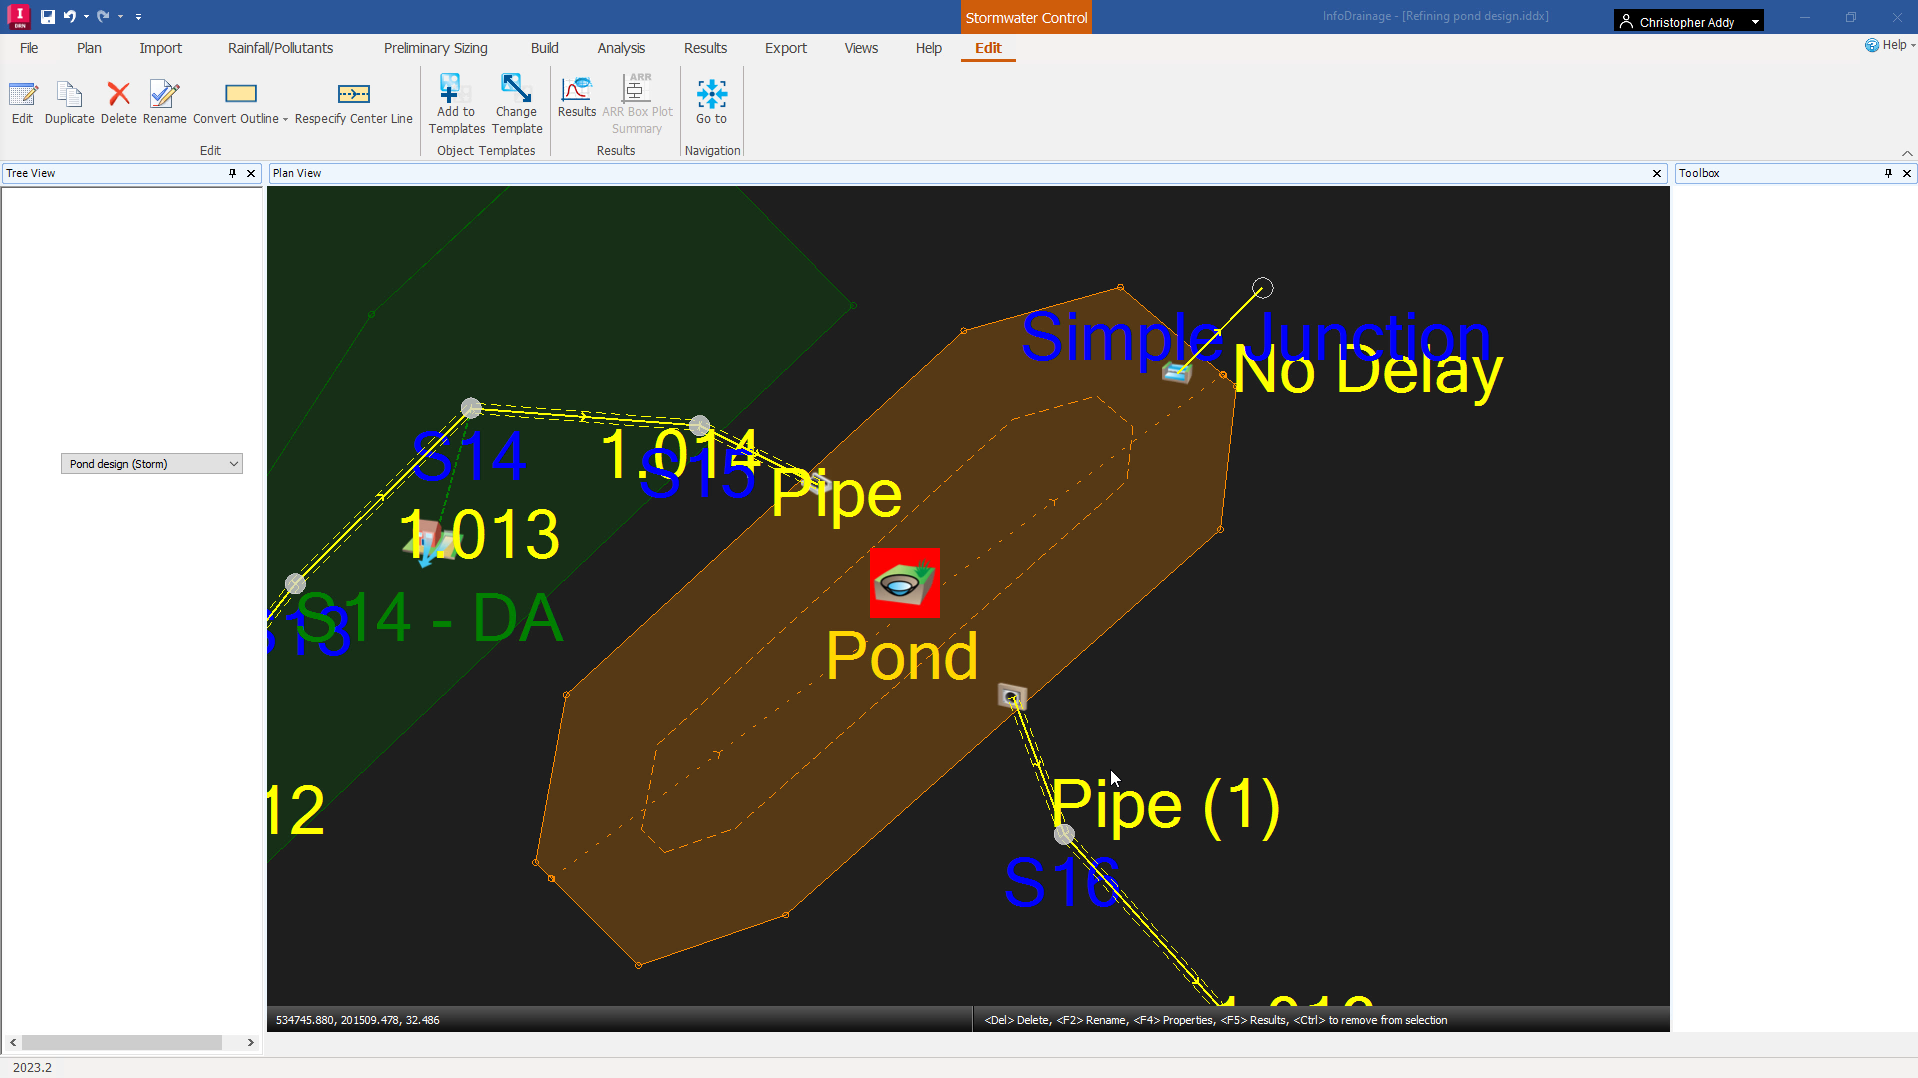
click OK again in the pond dialogue and observe how
03:23
the ponds size decreases slightly in the plan view,
03:28
check that the inlet and outlet are still within the boundary of the pond.
03:35
Return to the analysis tab and select validate again.
03:39
In this example. There are no errors.
03:44
click go again to rerun the simulation with the new volume
03:51
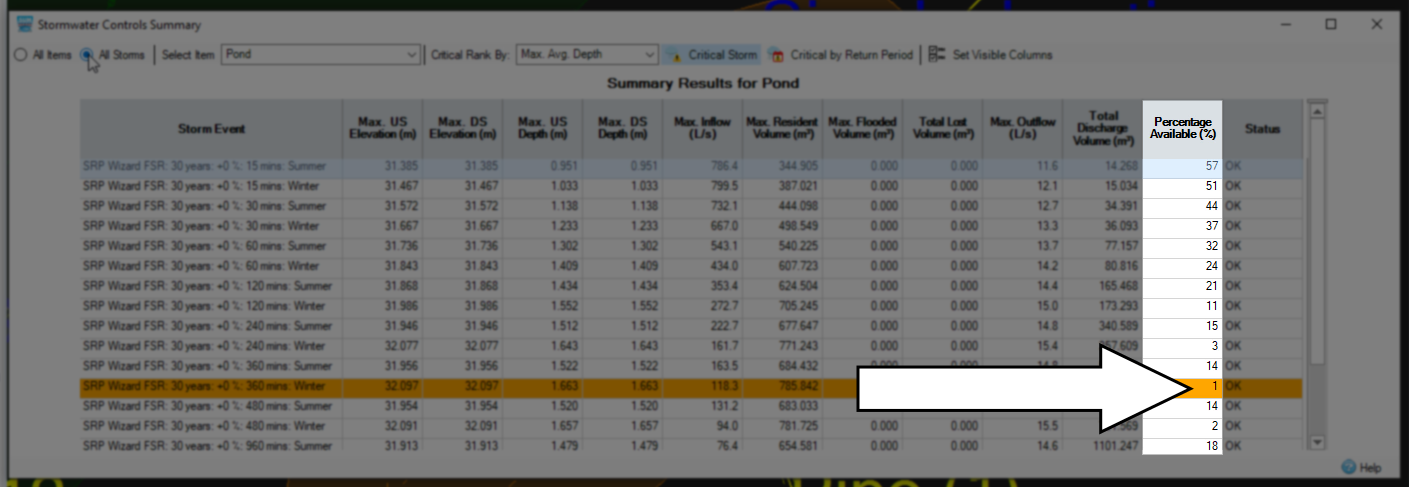
in the storm water controls summary, click critical storm,
03:54
then toggle on all storms.
03:57
This time only 1% of the pond was available during the critical storm.
04:02
The maximum depth and discharge are also closer to but do
04:06
not exceed the measurements established in the original design criteria,
04:11
is now properly optimized.