• InfoWater Pro

Using the Pressure Zone Manager

Use the Pressure Zone Manager (PZM) to set up a trace and analysis of a water distribution system model. 


Tutorial resources

These downloadable resources will be used to complete this tutorial:


00:04

Info Water Pro's pressure zone manager.

00:06

PZ M is a collection of tools to interactively define,

00:10

verify and color code each pressure zone in a water distribution system model.

00:16

The PCM accelerates hydraulic diagram designs

00:18

of existing and proposed pressure zones

00:21

and it helps ensure accuracy on

00:22

projects that feature frequent updates and revisions

00:25

to begin. Double click the desired project dot

00:28

ARX file to open Argi

00:30

Pro.

00:32

Once the project starts,

00:33

click the info Water Pro tab to open the info Water Pro ribbon

00:38

in the project panel, click initialize

00:42

using the pressure zone manager.

00:43

You can delineate pressure zones in the model and analyze them.

00:47

The pressure zone manager is available from the info Water Pro app manager.

00:52

Before you begin,

00:53

best practice is to set and run a scenario simulation to prepare for the PCM analysis

00:59

in the model explorer, set the scenario explorer to

01:02

max day

01:05

on the info Water pro ribbon in the analysis panel, click run

01:11

in the run manager, click run to run the simulation,

01:14

click OK to exit the run manager

01:17

and click. Yes. If you are prompted to switch to the most recent run output data

01:23

on the info water pro ribbon in the project panel, click apps

01:28

in the app manager, double click PCM to launch the tool

01:34

in the pressure zone manager. Click new to start the pressure zone wizard.

01:38

The pressure zone wizard guides you through the process of setting up a PCM analysis

01:43

here in the store the elements zone id in this field, enter zone

01:47

id.

01:49

This designates the database field to store the pressure zone id

01:53

for output time. Enter zero hours.

01:57

If this were a dynamic simulation,

01:59

you would enter the time at which you would like the analysis to take place.

02:03

Click next

02:05

for step one, define trace area.

02:07

You define the area for the PCM tool to perform a trace

02:11

for this exercise.

02:12

In the definition of trace area group, select no user defined boundary pipes.

02:18

This will tell the PCM to analyze the entire model.

02:21

Click next

02:24

in step two intra zone elements,

02:26

you can define intra zone elements for the PCM to ignore

02:31

this prevents delineation from occurring at elements that are specified

02:35

to be clear.

02:36

This tool will default to using all pumps, valves, tanks, reservoirs,

02:41

and closed pipes as boundary elements.

02:44

So if you knew one of these elements was

02:47

not actually a boundary element for a pressure zone,

02:49

you would identify it here to be ignored during the trace.

02:53

For this exercise, you do not need to add intra zone elements. So click next

03:00

in step three boundary elements,

03:02

you can add boundary elements such as pipes that separate pressure zones.

03:07

Once again for this exercise, there is nothing to add for this step. So click next

03:13

step four,

03:14

customize zone information allows you to change

03:17

the information associated with the pressure zones,

03:20

including their color

03:21

description

03:22

and start node

03:24

or you can add new pressure zones for analysis.

03:27

The PCM automatically creates zones if they are not specified in this step

03:32

again, for this exercise, there is nothing for you to change or add. So click next

03:39

on the pressure zone identification and analysis page,

03:42

click run to perform the trace and analysis.

03:46

The PCM performs a trace analysis to identify and list the pressure

03:50

zones it found in the model and it includes the analysis status

03:55

for this exercise.

03:56

You can see that six pressure zones are defined PZ one through PM six and complete

04:03

click finish to close the wizard and return to the pressure zone manager.

04:08

Now that the

04:09

PSM trace and analysis are complete, you can review details for each pressure zone

04:15

in the pressure zone manager, click the ID field for each pressure zone

04:19

and then click show zone.

04:22

You can move the pressure zone manager window to the

04:24

side to see the zones appear in the map.

04:29

Notice that pressure zone six is very small.

04:33

This is because PCM six has only one junction,

04:36

one reservoir and two pumps,

04:39

it can probably be merged with another pressure zone

04:42

zoom into the PZ M six area.

04:45

PCM six should be merged with

04:48

PSM three

04:49

pumps. P 100

04:51

P 120 are creating boundaries between the two

04:53

zones defined by the pressure zone manager.

04:56

And the pumps and tank from P Z M six are connected to the piping of P Z M three

05:02

click close to exit the pressure zone manager.

Video transcript

00:04

Info Water Pro's pressure zone manager.

00:06

PZ M is a collection of tools to interactively define,

00:10

verify and color code each pressure zone in a water distribution system model.

00:16

The PCM accelerates hydraulic diagram designs

00:18

of existing and proposed pressure zones

00:21

and it helps ensure accuracy on

00:22

projects that feature frequent updates and revisions

00:25

to begin. Double click the desired project dot

00:28

ARX file to open Argi

00:30

Pro.

00:32

Once the project starts,

00:33

click the info Water Pro tab to open the info Water Pro ribbon

00:38

in the project panel, click initialize

00:42

using the pressure zone manager.

00:43

You can delineate pressure zones in the model and analyze them.

00:47

The pressure zone manager is available from the info Water Pro app manager.

00:52

Before you begin,

00:53

best practice is to set and run a scenario simulation to prepare for the PCM analysis

00:59

in the model explorer, set the scenario explorer to

01:02

max day

01:05

on the info Water pro ribbon in the analysis panel, click run

01:11

in the run manager, click run to run the simulation,

01:14

click OK to exit the run manager

01:17

and click. Yes. If you are prompted to switch to the most recent run output data

01:23

on the info water pro ribbon in the project panel, click apps

01:28

in the app manager, double click PCM to launch the tool

01:34

in the pressure zone manager. Click new to start the pressure zone wizard.

01:38

The pressure zone wizard guides you through the process of setting up a PCM analysis

01:43

here in the store the elements zone id in this field, enter zone

01:47

id.

01:49

This designates the database field to store the pressure zone id

01:53

for output time. Enter zero hours.

01:57

If this were a dynamic simulation,

01:59

you would enter the time at which you would like the analysis to take place.

02:03

Click next

02:05

for step one, define trace area.

02:07

You define the area for the PCM tool to perform a trace

02:11

for this exercise.

02:12

In the definition of trace area group, select no user defined boundary pipes.

02:18

This will tell the PCM to analyze the entire model.

02:21

Click next

02:24

in step two intra zone elements,

02:26

you can define intra zone elements for the PCM to ignore

02:31

this prevents delineation from occurring at elements that are specified

02:35

to be clear.

02:36

This tool will default to using all pumps, valves, tanks, reservoirs,

02:41

and closed pipes as boundary elements.

02:44

So if you knew one of these elements was

02:47

not actually a boundary element for a pressure zone,

02:49

you would identify it here to be ignored during the trace.

02:53

For this exercise, you do not need to add intra zone elements. So click next

03:00

in step three boundary elements,

03:02

you can add boundary elements such as pipes that separate pressure zones.

03:07

Once again for this exercise, there is nothing to add for this step. So click next

03:13

step four,

03:14

customize zone information allows you to change

03:17

the information associated with the pressure zones,

03:20

including their color

03:21

description

03:22

and start node

03:24

or you can add new pressure zones for analysis.

03:27

The PCM automatically creates zones if they are not specified in this step

03:32

again, for this exercise, there is nothing for you to change or add. So click next

03:39

on the pressure zone identification and analysis page,

03:42

click run to perform the trace and analysis.

03:46

The PCM performs a trace analysis to identify and list the pressure

03:50

zones it found in the model and it includes the analysis status

03:55

for this exercise.

03:56

You can see that six pressure zones are defined PZ one through PM six and complete

04:03

click finish to close the wizard and return to the pressure zone manager.

04:08

Now that the

04:09

PSM trace and analysis are complete, you can review details for each pressure zone

04:15

in the pressure zone manager, click the ID field for each pressure zone

04:19

and then click show zone.

04:22

You can move the pressure zone manager window to the

04:24

side to see the zones appear in the map.

04:29

Notice that pressure zone six is very small.

04:33

This is because PCM six has only one junction,

04:36

one reservoir and two pumps,

04:39

it can probably be merged with another pressure zone

04:42

zoom into the PZ M six area.

04:45

PCM six should be merged with

04:48

PSM three

04:49

pumps. P 100

04:51

P 120 are creating boundaries between the two

04:53

zones defined by the pressure zone manager.

04:56

And the pumps and tank from P Z M six are connected to the piping of P Z M three

05:02

click close to exit the pressure zone manager.

Step-by-step:

InfoWater Pro's Pressure Zone Manager (PZM) allows users to interactively define, verify, and color-code each pressure zone in a water distribution system model. The PZM accelerates hydraulic diagram designs of existing and proposed pressure zones, and it helps ensure accuracy on projects that feature frequent updates and revisions.

  1. Open the appropriate .aprx file in ArcGIS Pro.
  2. From the ribbon, InfoWater Pro tab, Project panel, click Initialize.

Using the Pressure Zone Manager, you can delineate pressure zones in the model and analyze them. Before you begin, best practice is to set and run a scenario simulation to prepare for the PZM analysis:

  1. In the Model Explorer, set the Scenario Explorer to EX_MAXDAY.
  2. On the ribbon, InfoWater Pro tab, Analysis panel, click Run.
  3. In the Run Manager, click Run to run the simulation.
  4. Click OK to exit the Run Manager.
  5. If you are prompted to switch to the most recent run output data, click Yes.
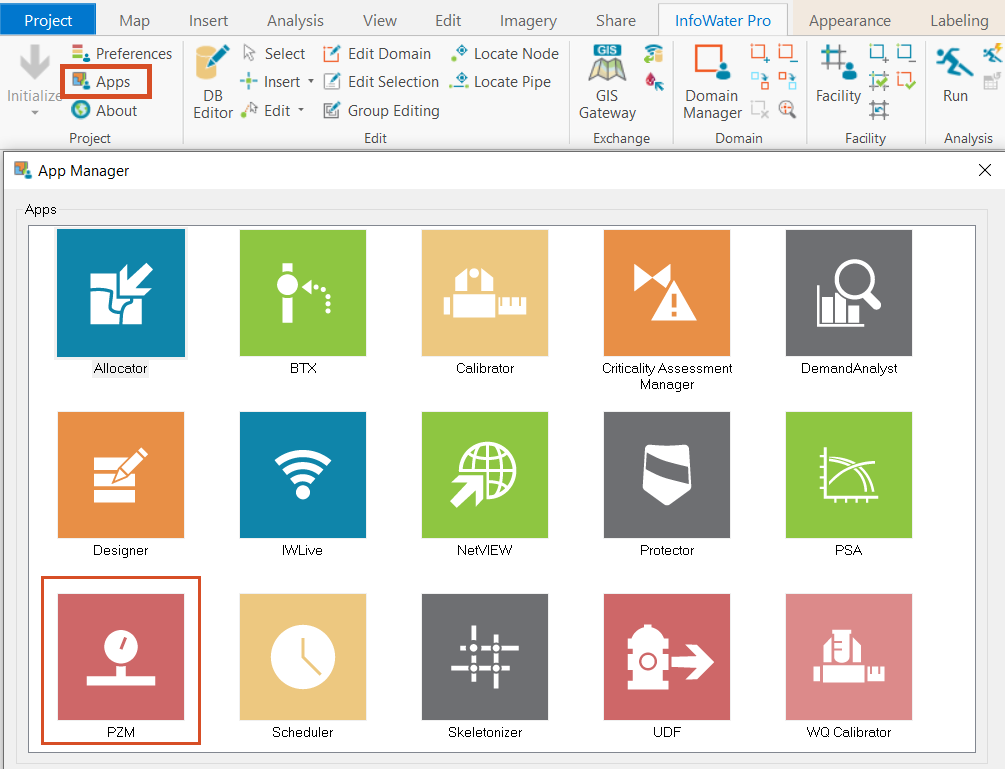
  6. On the ribbon, InfoWater Pro tab, Project panel, click Apps.
  7. In the App Manager, double-click PZM to launch the tool.
    The InfoWater Pro Project panel with Apps highlighted and the App Manager with PZM highlighted
  8. In the Pressure Zone Manager, click New to start the Pressure Zone Wizard, which guides users through the process of setting up a PZM analysis.
  9. In the Store the element's Zone ID field, enter “ZoneID” – designates the database field to store the pressure zone ID.
  10. For Output Time, enter 00:00 hrs. (For a dynamic simulation, enter the time the analysis is to take place.)
  11. Click Next.
  12. Step 1 – Define Trace Area, in the Definition of Trace Area group, select No User Defined Boundary Pipes to analyze the entire model.
  13. Click Next.
  14. Step 2 – Intra-Zone Elements, define intra-zone elements for the PZM to ignore to prevent delineation from occurring at elements that are specified. For this tutorial, do not add intra-zone elements.

Note: this tool will default to using all pumps, valves, tanks, reservoirs, and closed pipes as boundary elements. So, if you knew one of these elements was not actually a boundary element for a pressure zone, you would identify it here to be ignored during the trace.

  1. Click Next.
  2. Step 3 – Boundary Elements, add boundary elements, such as pipes, that separate pressure zones. For this tutorial, do not add boundary elements.
  3. Click Next.
  4. Step 4 – Customize Zone Information, change the information associated with the pressure zones, including their color, description, and start node. Or, add new pressure zones for analysis. The PZM automatically creates zones if they are not specified in this step. For this tutorial, make no changes.
  5. Click Next.
  6. On the Pressure Zone Identification and Analysis page, click Run to perform the trace and analysis.

The PZM performs a trace analysis to identify and list the pressure zones it found in the model, and it includes the analysis status. For this exercise, six pressure zones are defined—PZM1 - PZM6—and complete.

The Pressure Zone Identification And Analysis window, displaying the six resulting pressure zones.

  1. Click Finish to close the wizard and return to the Pressure Zone Manager.

Once the PZM trace and analysis are complete, to review the details for each pressure zone:

  1. In the Pressure Zone Manager, click an ID field for each pressure zone
  2. Then click Show Zone.
  3. Move the Pressure Zone Manager window to the side to see the zones appear in the map.
    The Pressure Zone Manager window, with Show Zone highlighted.

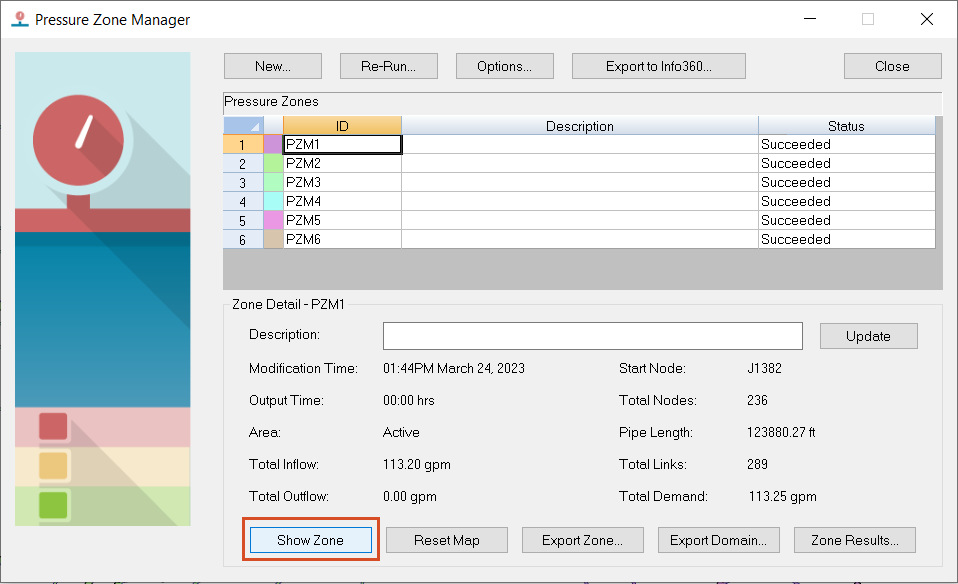
Note: Pressure Zone 6 is very small because PZM6 has only one junction, one reservoir, and two pumps. Therefore, it can be merged with another pressure zone.

  1. Zoom into the PZM6 area. 

PZM6 should be merged with PZM3. Pumps P-100 and P-120 are creating boundaries between the two zones defined by the Pressure Zone Manager, and the pumps and tank from PZM6 are connected to the piping of PZM3.

  1. Click Close to exit the Pressure Zone Manager.
Was this information helpful?