& Construction

Integrated BIM tools, including Revit, AutoCAD, and Civil 3D
& Manufacturing

Professional CAD/CAM tools built on Inventor and AutoCAD
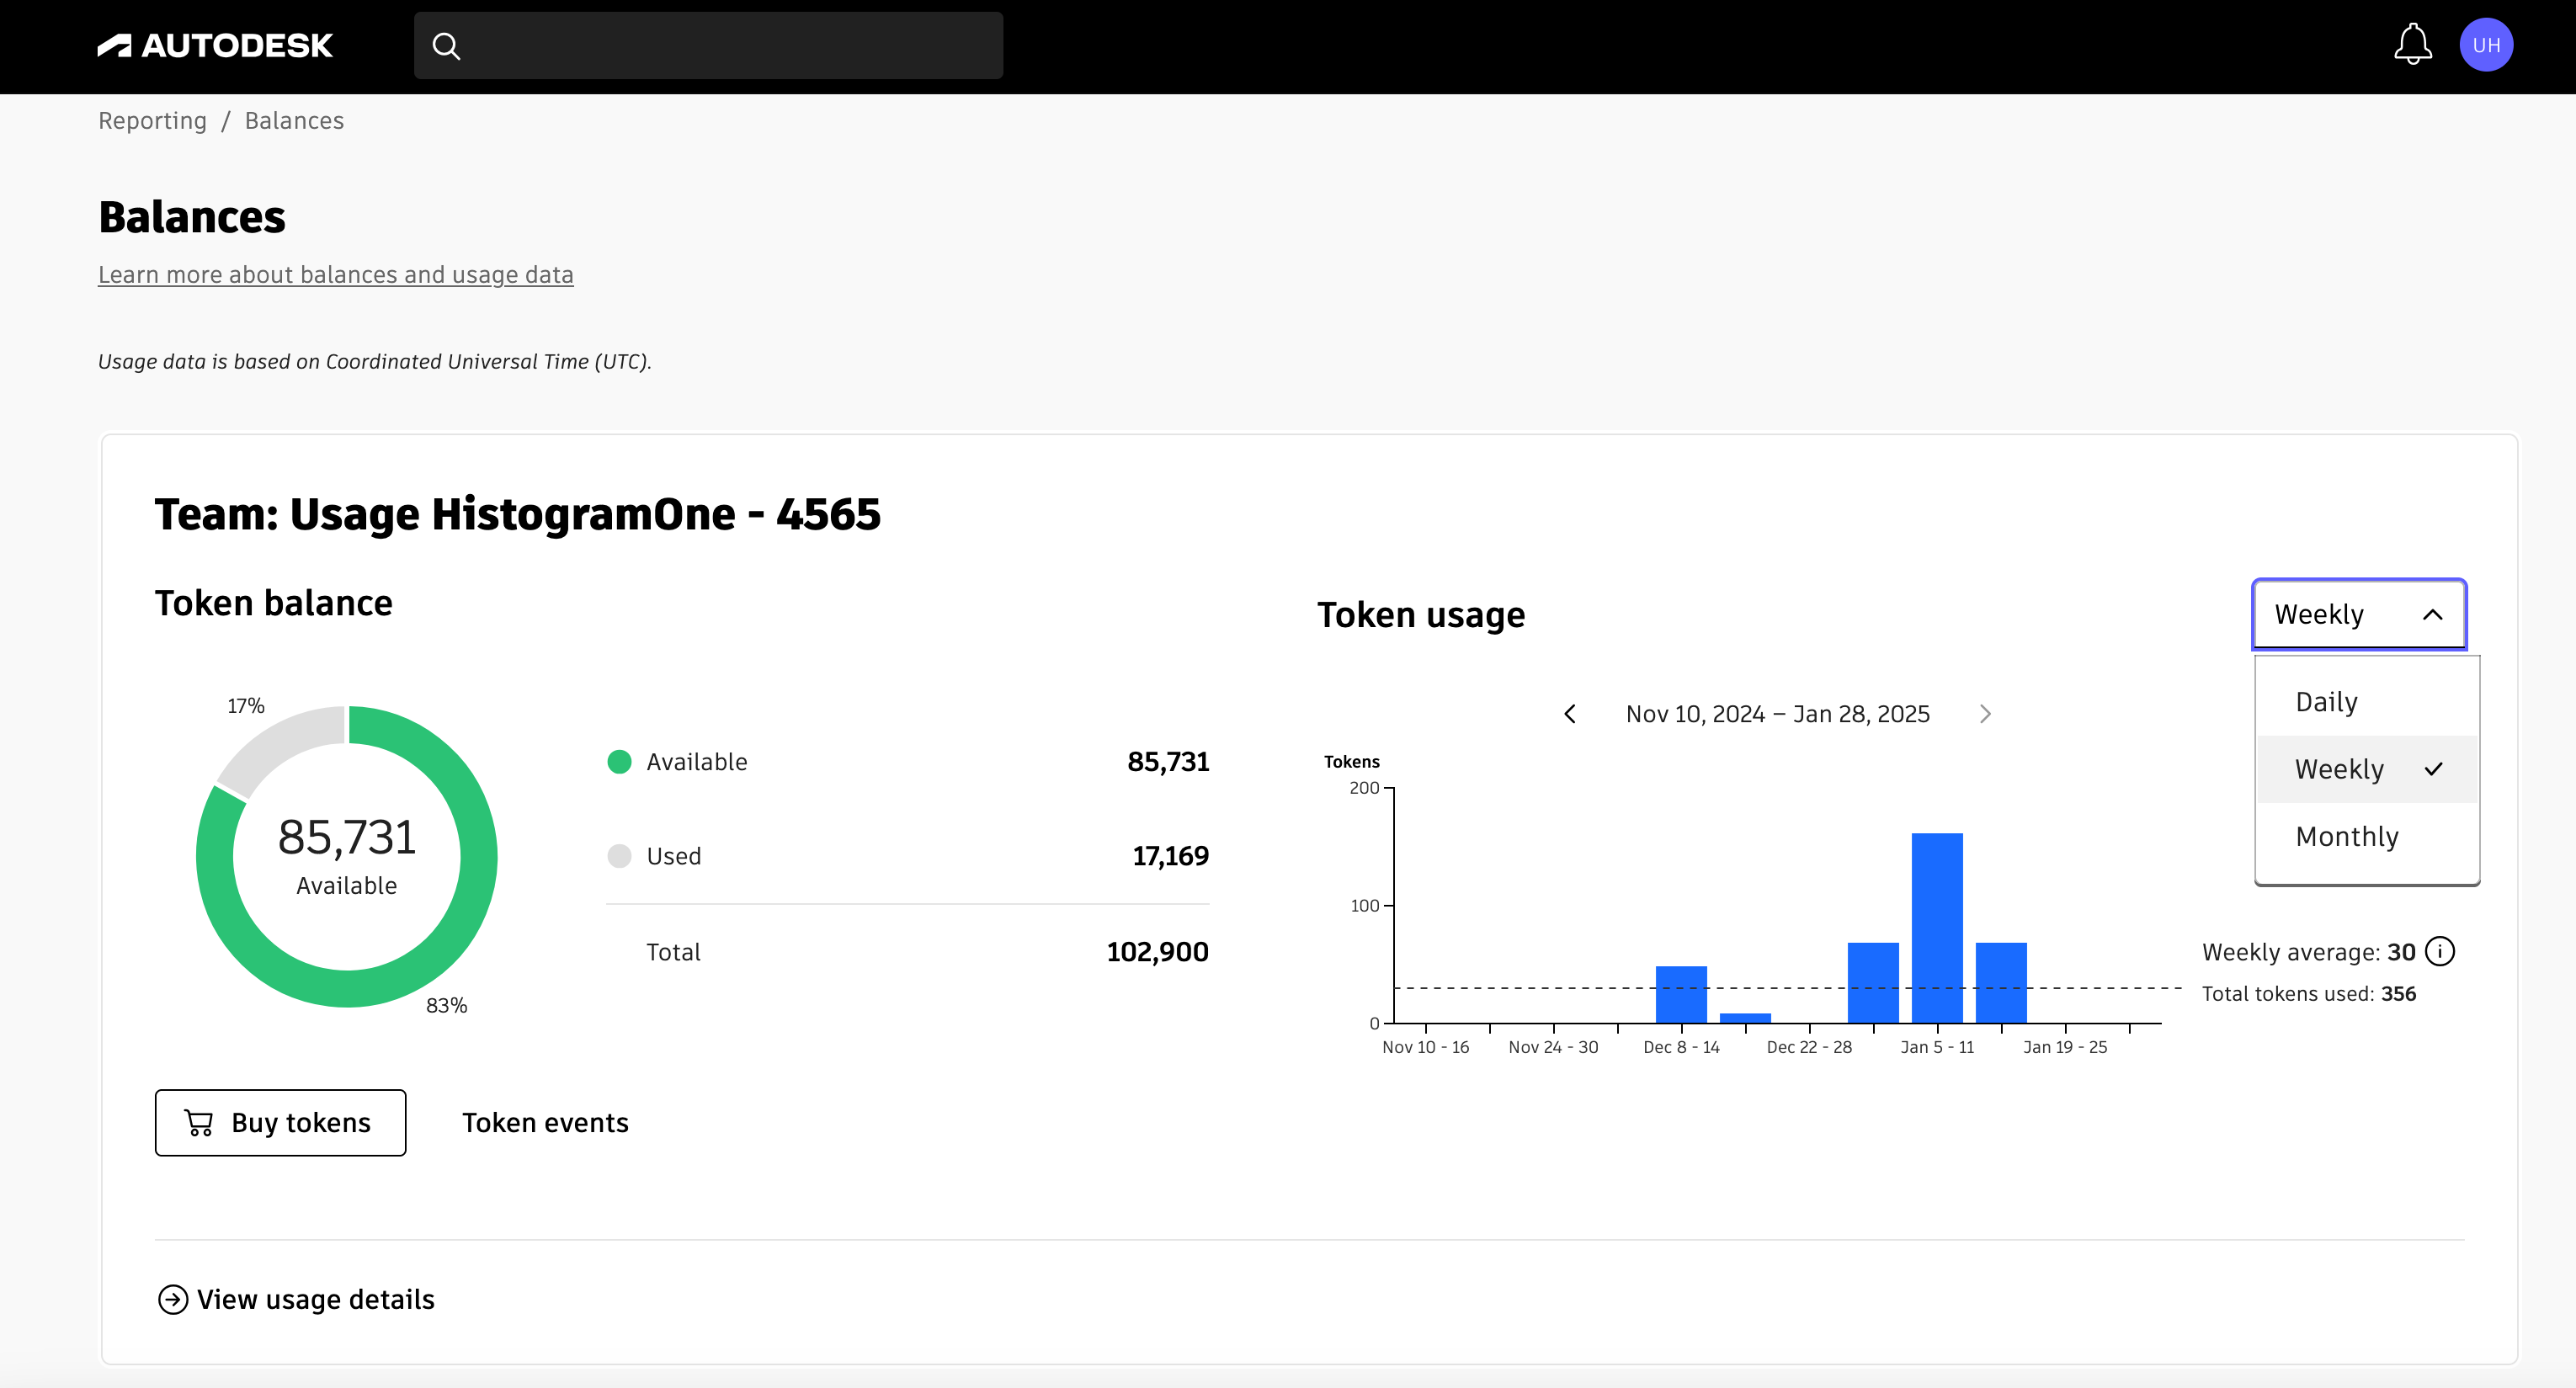
The Balances page in Autodesk account shows real-time balances and usage data for Flex tokens and shared cloud credits.
The Balances page provides a visualisation for each of your teams that shows:
Green and red bands in the donut chart indicate that available tokens exceed 20% of the total purchased or are fewer than that.
The Balances page also provides access to token usage information for each of your teams.
To learn more, view the video that follows.
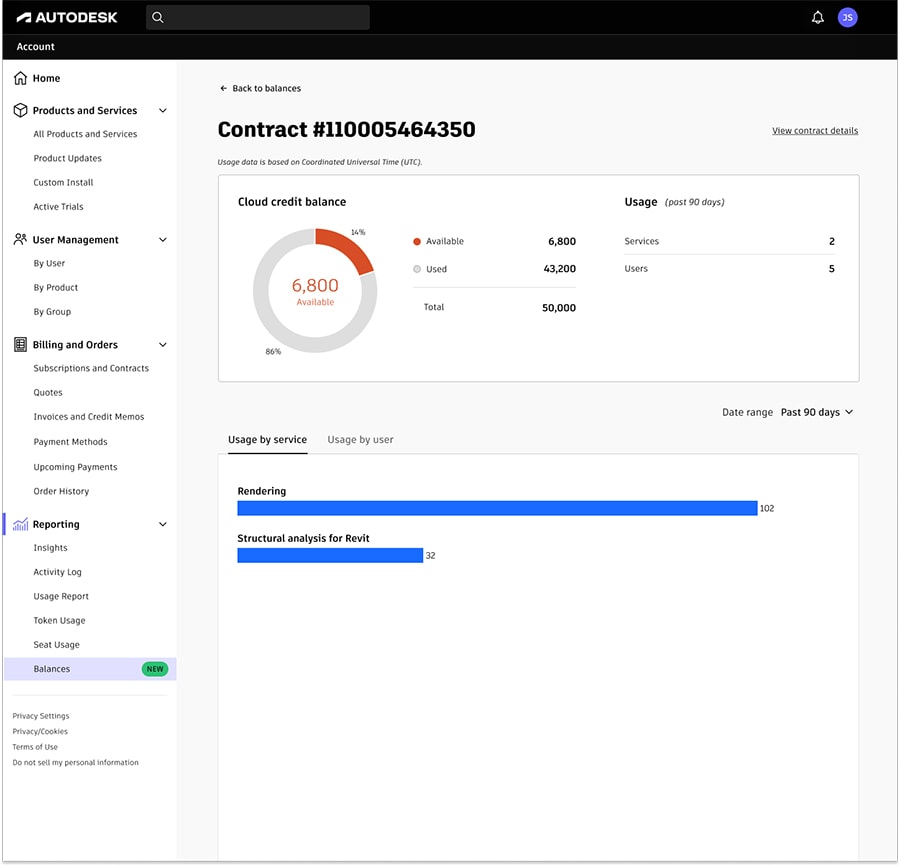
If you’re in a region in which Flex is not yet supported, the Balances page provides real-time shared cloud credit balances. A chart for your contract shows you the current number of:
Green and red bands in the donut chart indicate that available shared cloud credits exceed 20% of the total purchased or are fewer than that.
In addition to shared cloud credit balance, the Balances page provides access to usage information for your contract.

The Assistant can help you find answers or contact an agent.
What level of support do you have?
Different subscription plans provide distinct categories of support. Find out the level of support for your plan.
