00:03
In InfoWorks ICM, themes allow you to display a particular field or result value graphically.
00:10
This can be useful for displaying the flood extents from your simulation results.
00:15
In this tutorial, you set up and display flood extents in 2D to show the depth, direction,
00:22
and speed of the water as it approaches and bursts a structure.
00:26
To start, select Open>Open transportable database.
00:31
Open the folder where you downloaded the files for this exercise and select the .icmt file.
00:40
If a popup displays about opening the database as read-only, click Yes.
00:44
Right-click the top-level folder and select Copy.
00:48
When the pop-up displays, click Continue.
00:51
In the Explorer window, right-click the Database and select Paste (with children).
00:57
In the Copying pop-up, enable Copy simulation results.
01:04
Open 2D Dam Breach on the GeoPlan to ensure the model opens with the simulation results applied.
01:11
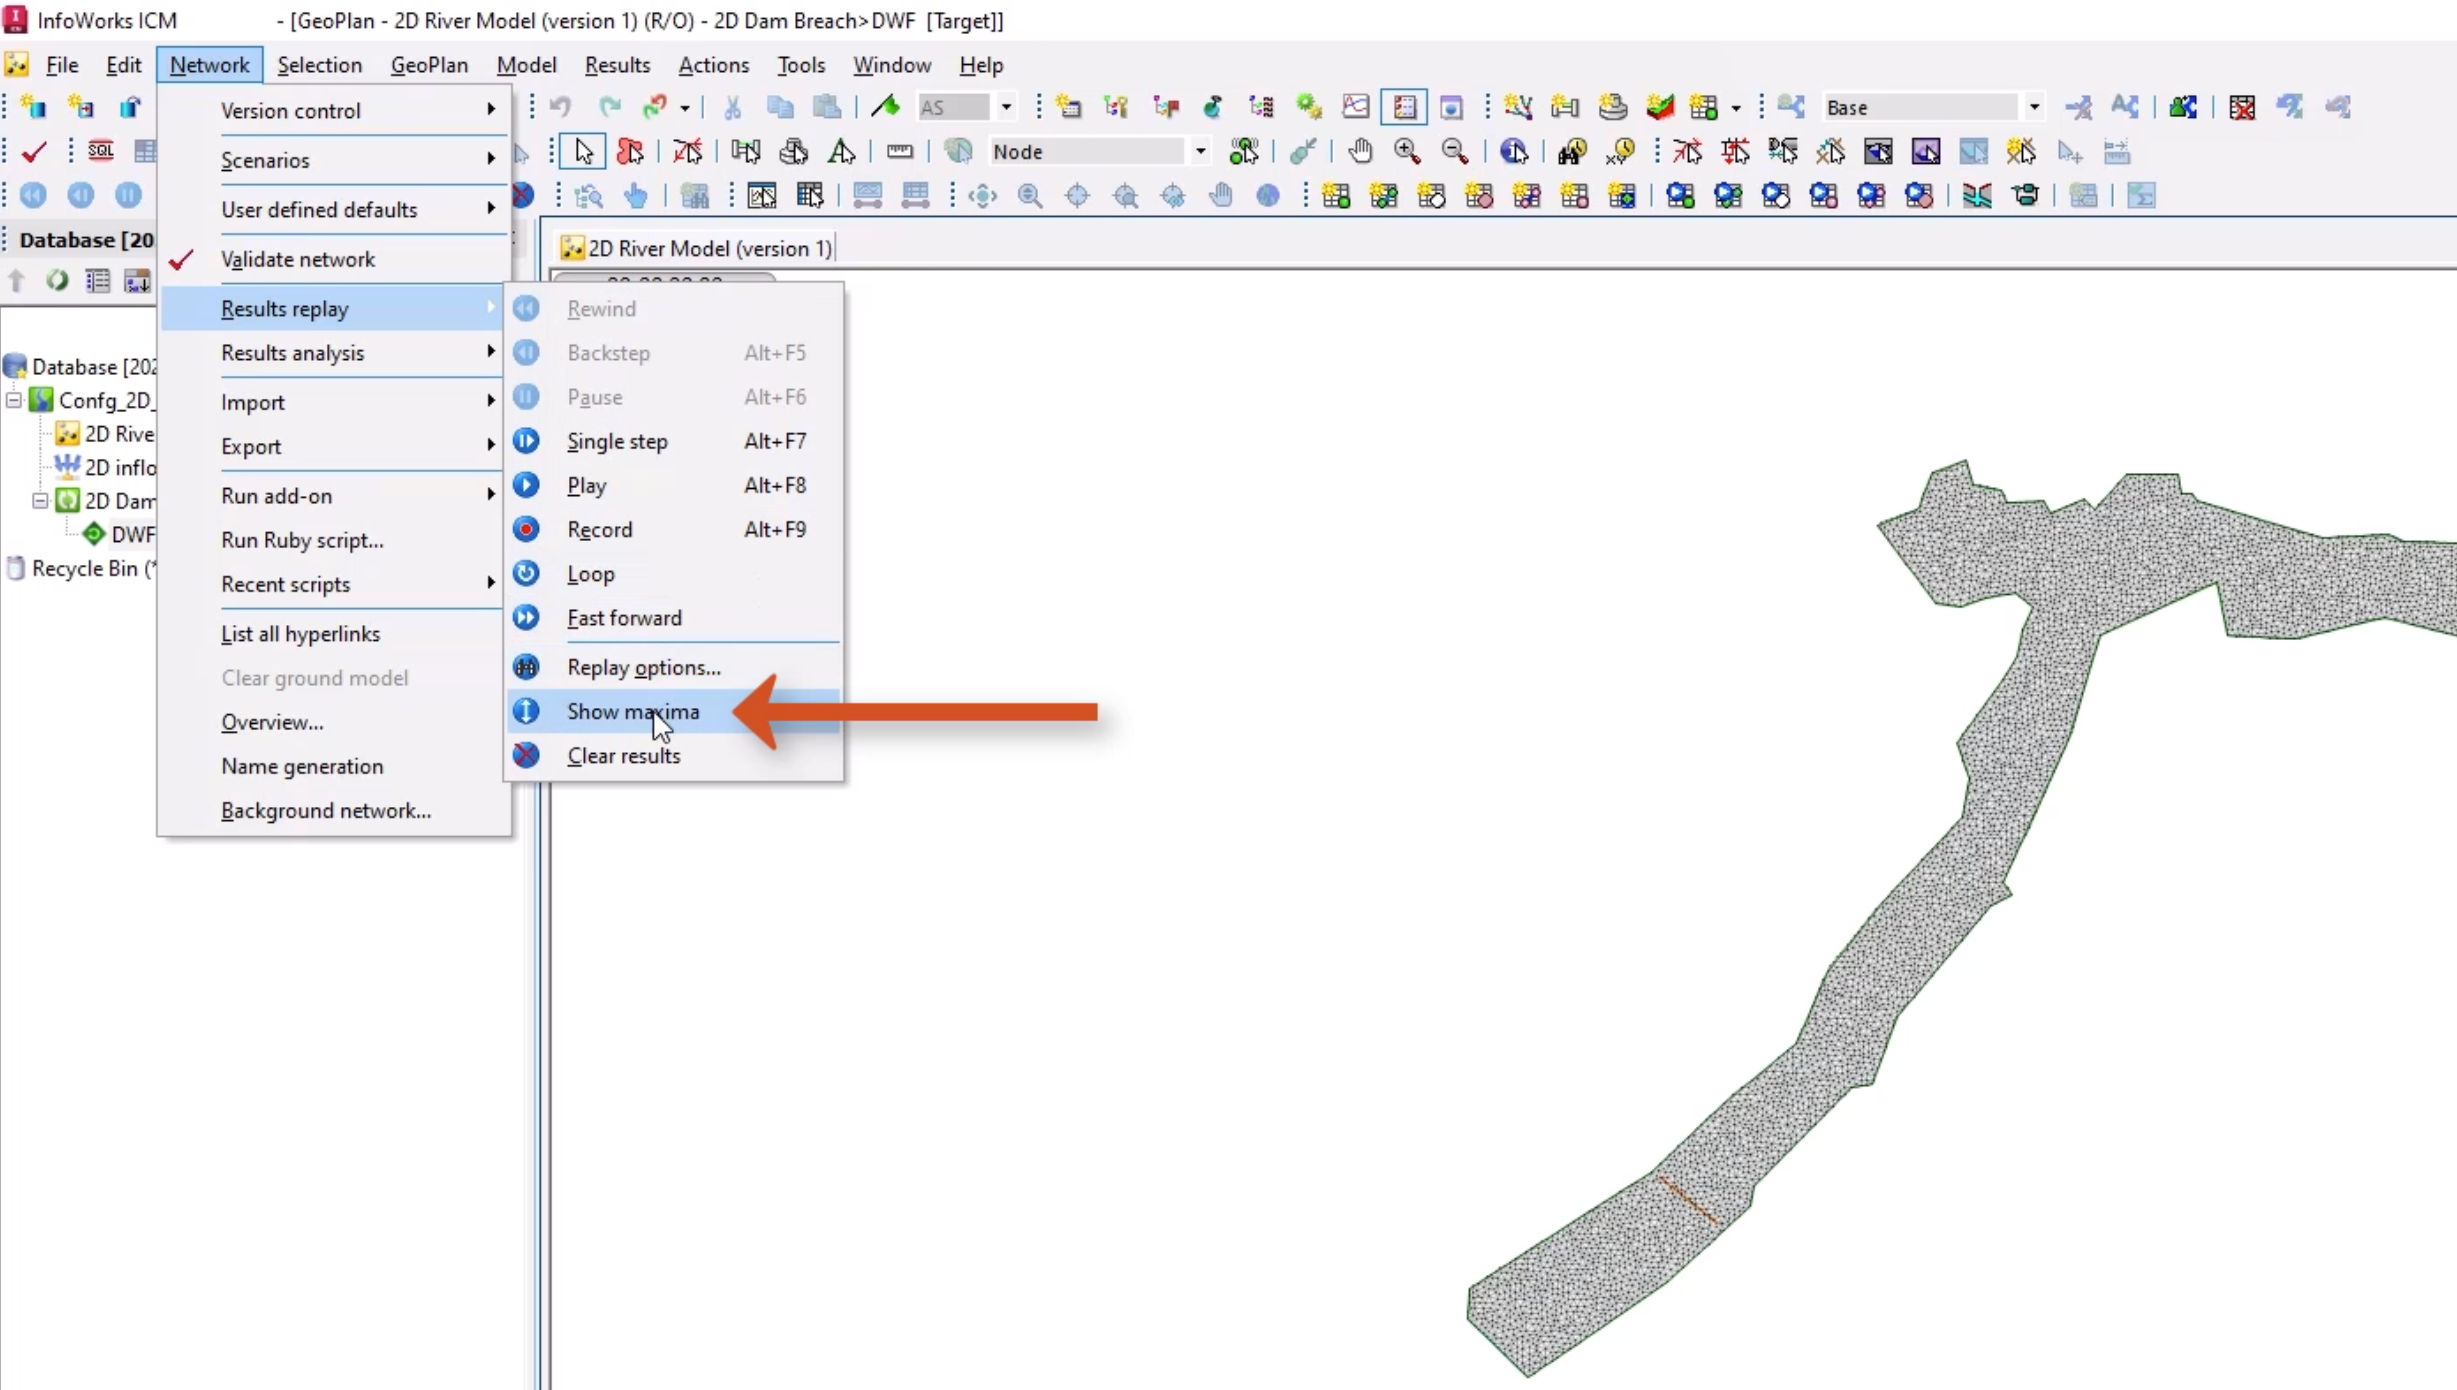
Before setting up your 2D themes, to view your changes as you work,
01:15
expand the Network menu and select Results Replay > Show maxima.
01:21
A factory default theme should already be displayed, which will be customized.
01:26
First, create a sub theme that displays water depth for the 2D zone object layer.
01:32
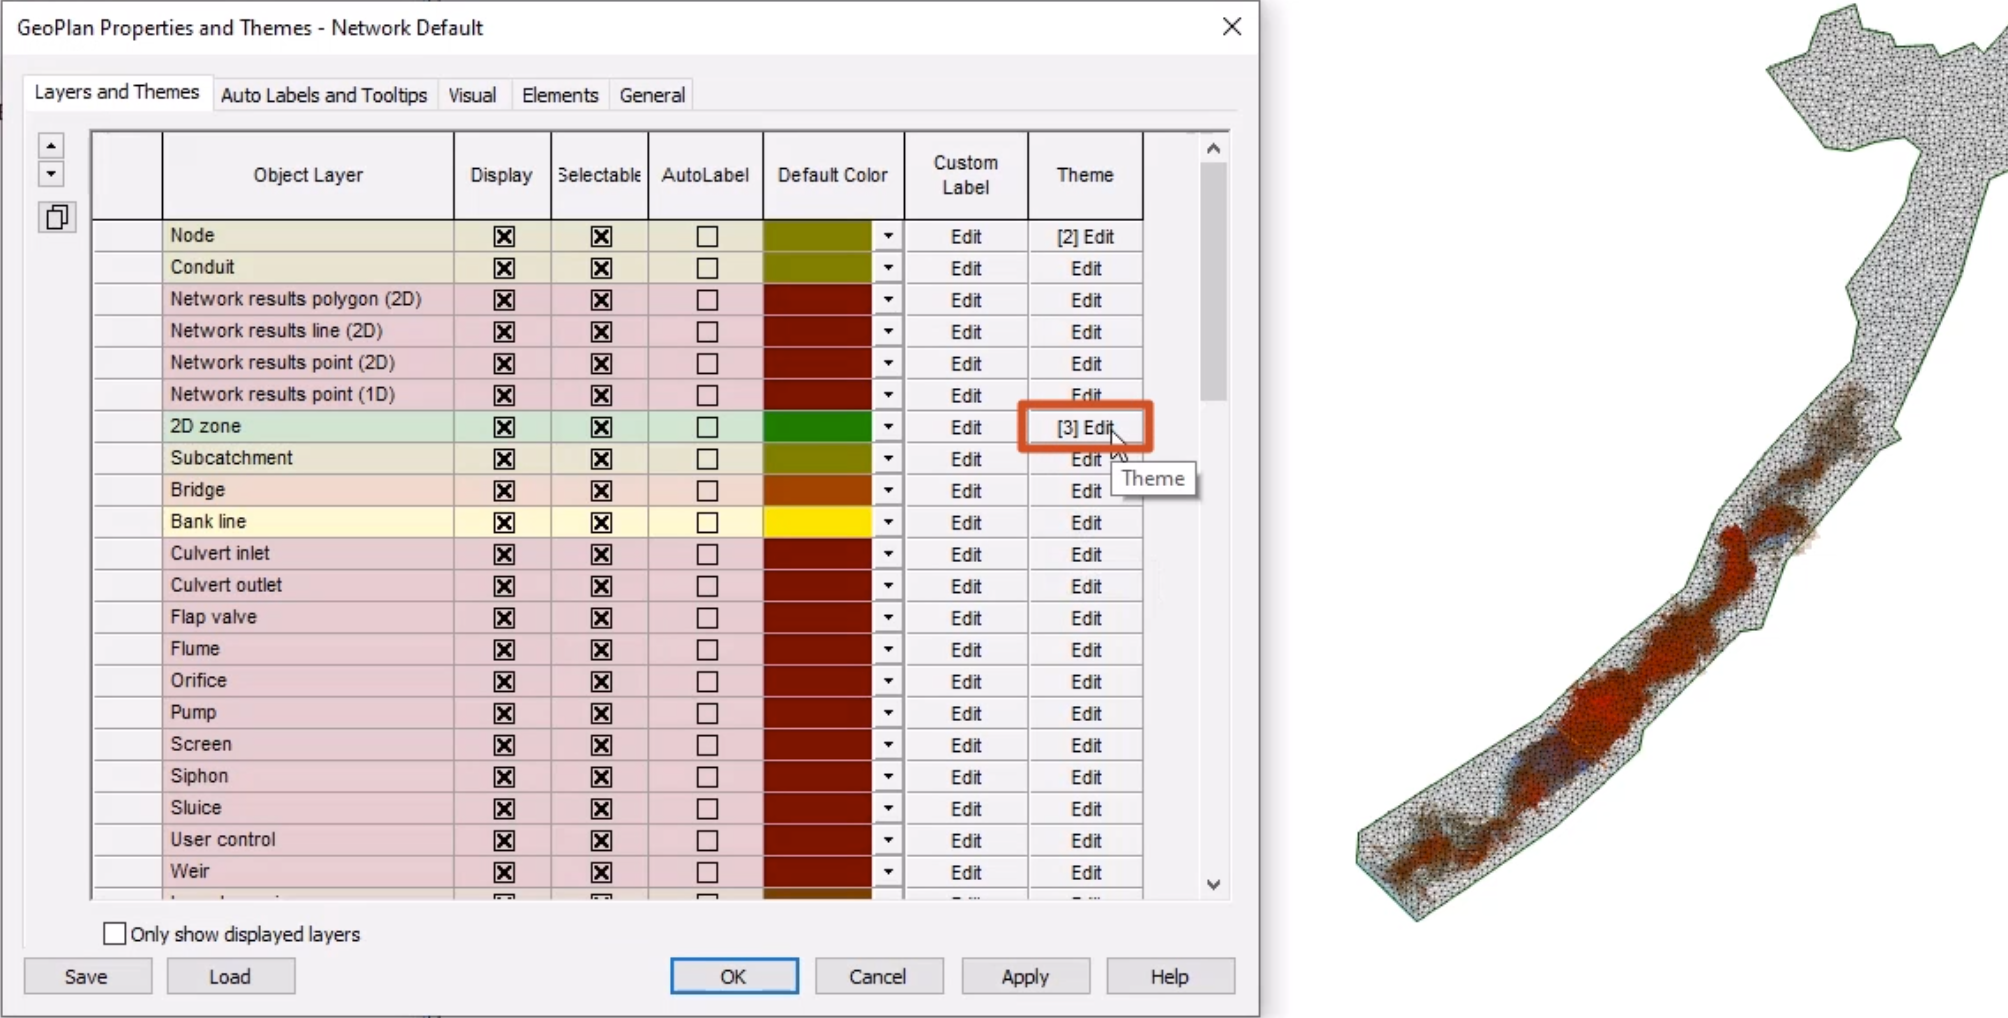
Right-click the GeoPlan and select Properties & themes.
01:36
On the Layers and Themes tab, Object Layer column, find the 2D zone row.
01:42
In the Theme column, select Edit.
01:45
The Layer Theme Editor opens with the Base Theme, Flow Arrows and depth2d sub themes.
01:52
To add a new theme, in the Sub Theme Manager Pane, on the toolbar, select Add.
01:58
In this instance, the default themes can be edited to enhance the display.
02:02
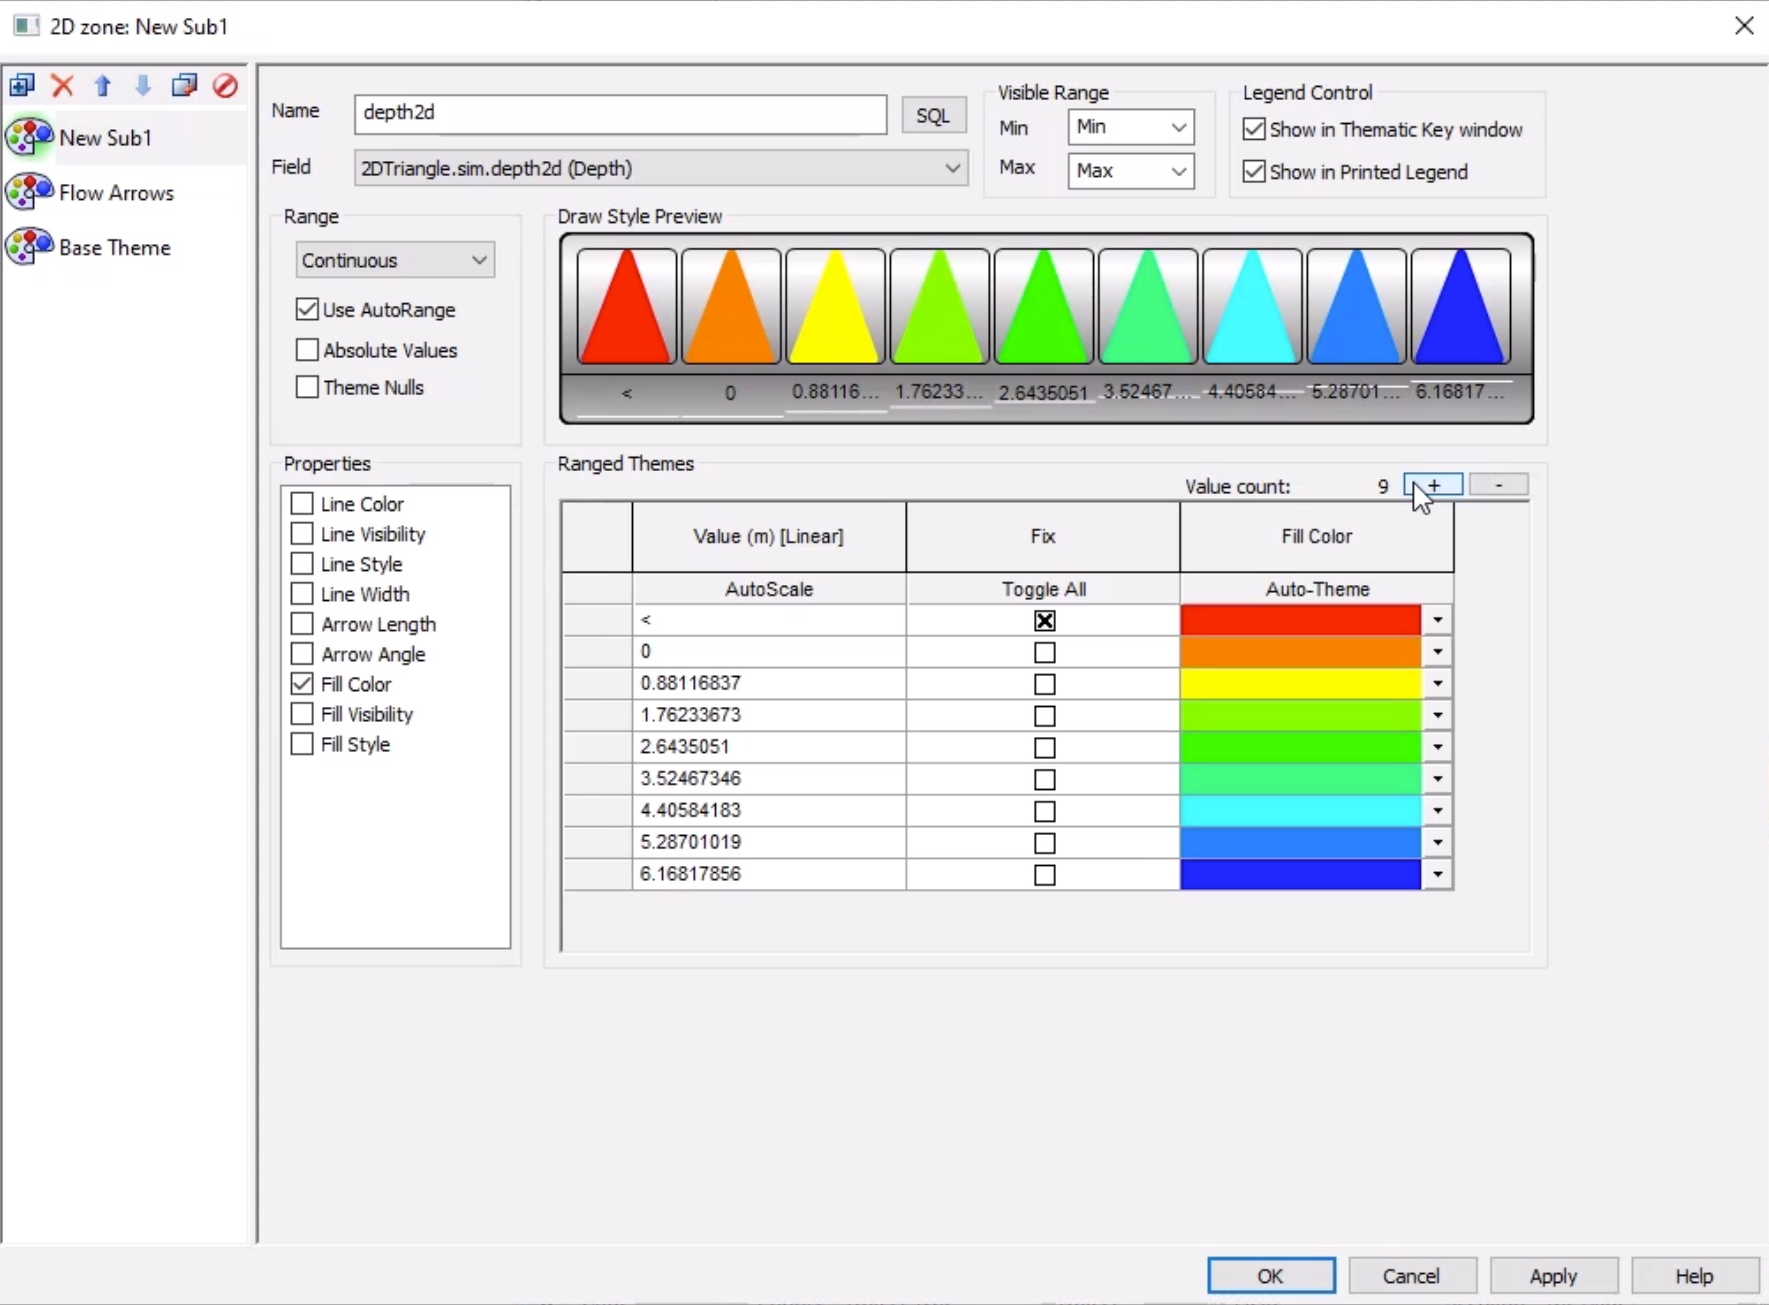
Select the depth2d sub theme.
02:05
Note that the Field drop-down has the 2DTriangle.sim.depth2d (Depth) result field selected.
02:13
The Name of the theme will automatically populate and can be changed as needed.
02:18
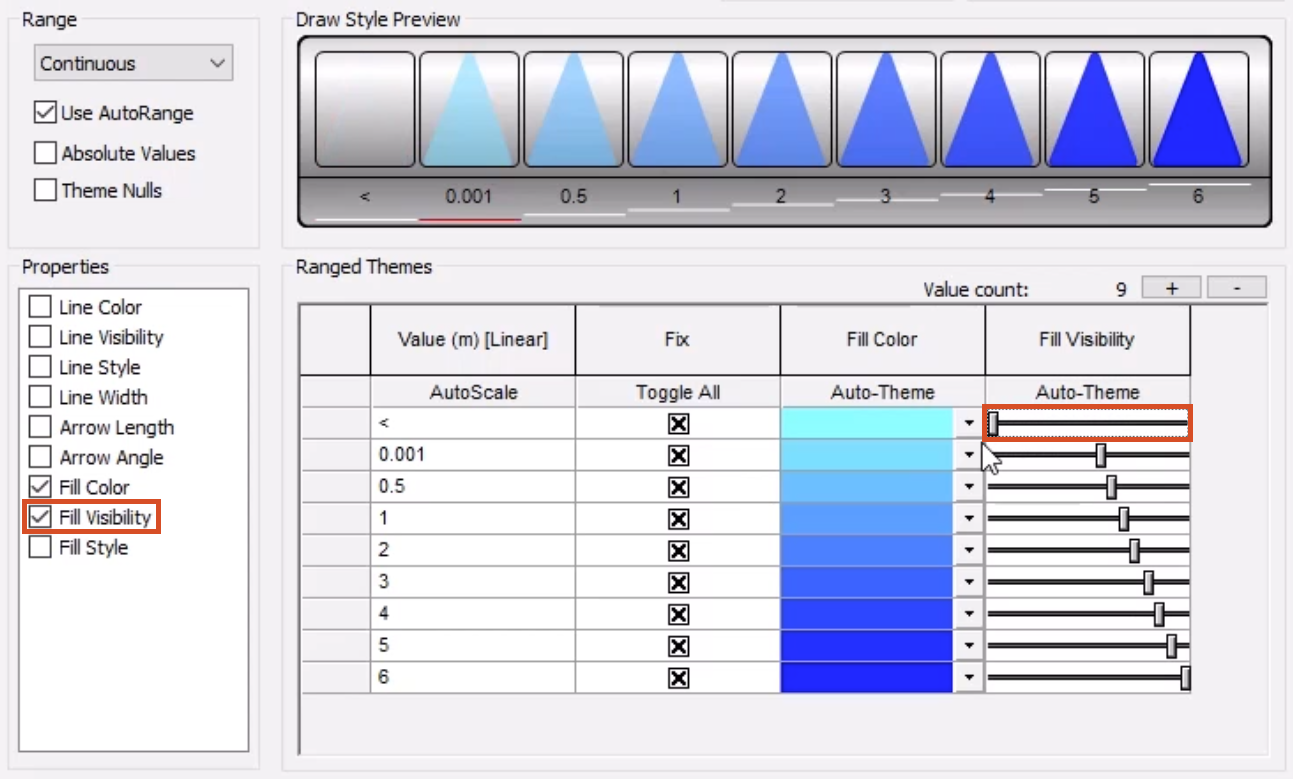
In the Ranged Themes section, a range of values is set for each color in the theme.
02:23
To add additional values, next to Value count, click the plus (+) button to increase the value to 9.
02:30
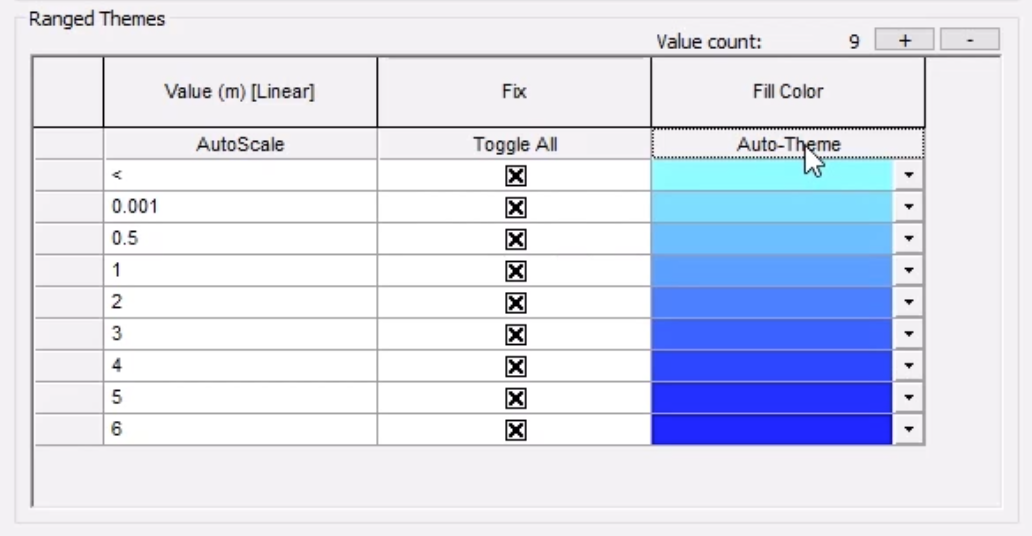
In the Fix column, select Toggle All.
02:34
In the Value column, ensure the minimum depth is set above zero to prevent all triangles from being colored.
02:40
Starting with the second row, enter the values 0.001, 0.5, 1, 2, 3, 4, 5 and 6.
02:56
In the Fill Colour column, you can set the colors of each depth to make it easier to distinguish the depth of water.
03:02
In the first row, expand the color drop-down and choose a light color.
03:07
The Draw Style Preview panel updates with the new color scheme.
03:12
You can also click Auto-Theme to cycle through different color palette options.
03:17
During a presentation, most audiences expect gradient shades of blue.
03:22
For results analysis different color bands may be preferred.
03:26
You can also adjust the opacity of each color.
03:30
In the Fill Visibility column move the first row to roughly the center position.
03:35
Now click the Auto-Theme button which will interpolate between the top and bottom rows to create a smooth transition.
03:42
In the first row, adjust the Fill Visibility slider to 0 so that it won’t be displayed.
03:48
The Draw Style Preview updates accordingly.
03:51
Click Apply to save this sub theme for water depth.
03:54
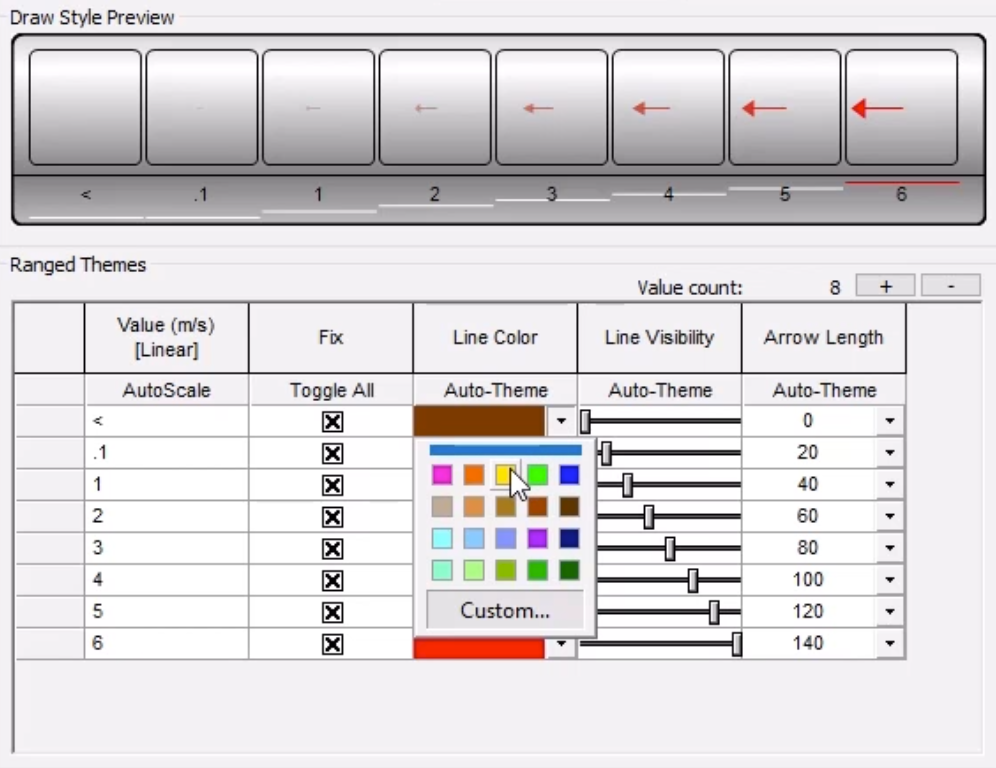
Now, select the Flow Arrows sub theme which will display water speed and direction.
03:60
Note the Field drop-down has 2DTriangles.sim.speed2d (Speed) selected.
04:07
Click the plus (+) to set the Value count to 8.
04:11
In the Fix column, select Toggle All.
04:14
In the Arrow Length column, first row, expand the drop-down and select 0.
04:19
In the final row, select 140.
04:22
Click the Auto-Theme button, and the rows update to gradually increase the arrow length.
04:28
In the Value column, update rows 2 through 7 with the values 0.1, 1, 2, 3, 4, 5 and 6.
04:40
In the Line Color column, expand the first drop-down and for this exercise, select yellow.
04:47
In the final row, expand the drop-down and click Custom.
04:52
Here, you can choose a custom color or select a Base Colours option.
04:56
Select red, and then click OK.
04:60
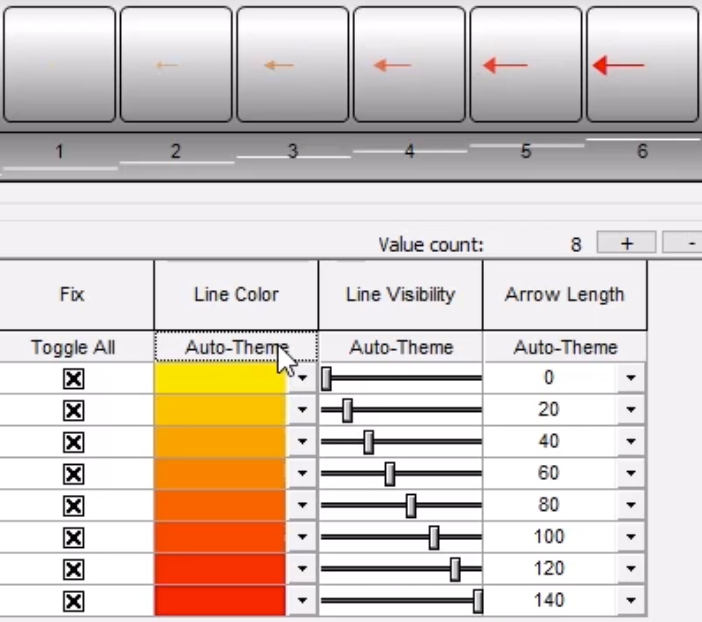
In the Line Color column, click Auto-Theme several times to create a gradient from yellow to red.
05:08
For a better view of the 2D River Model with the new themes applied, drag the GeoPlan Properties and Themes dialog out of the way.
05:17
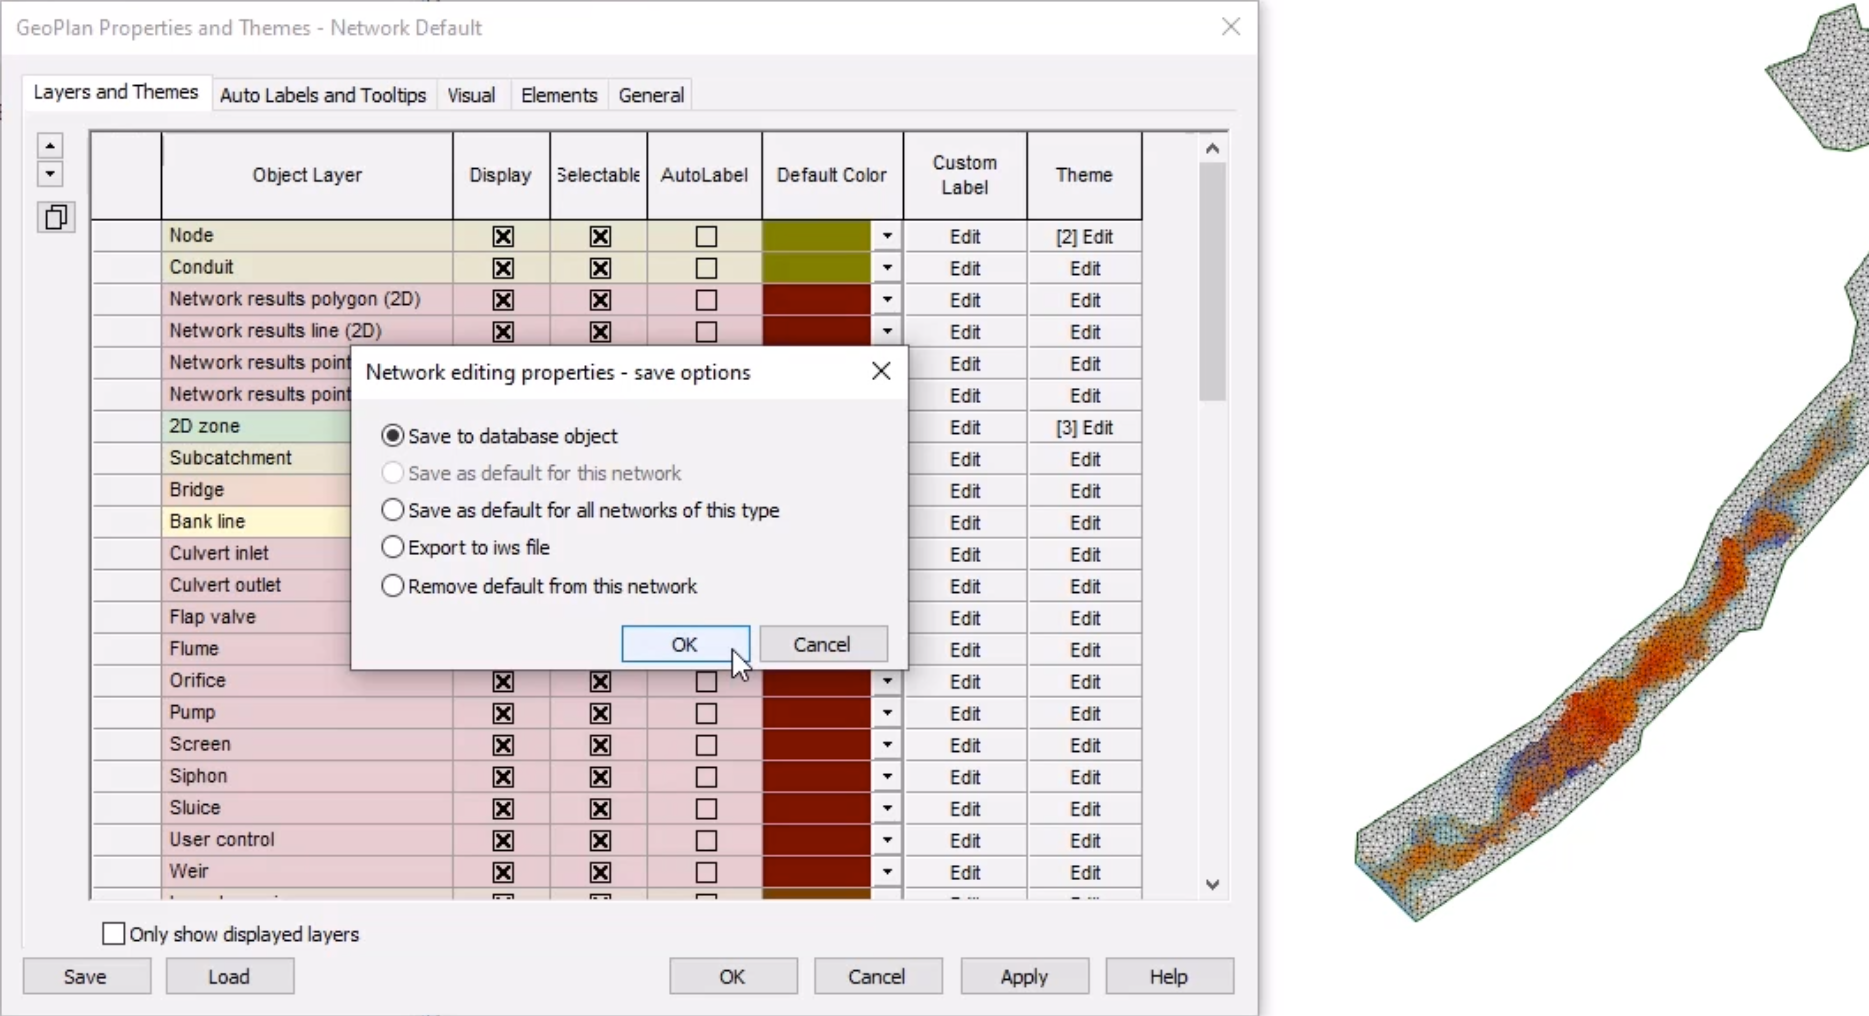
Once you confirm that the properties you selected are logical and visually differentiated,
05:22
in the GeoPlan Properties and Themes dialog, select Save.
05:26
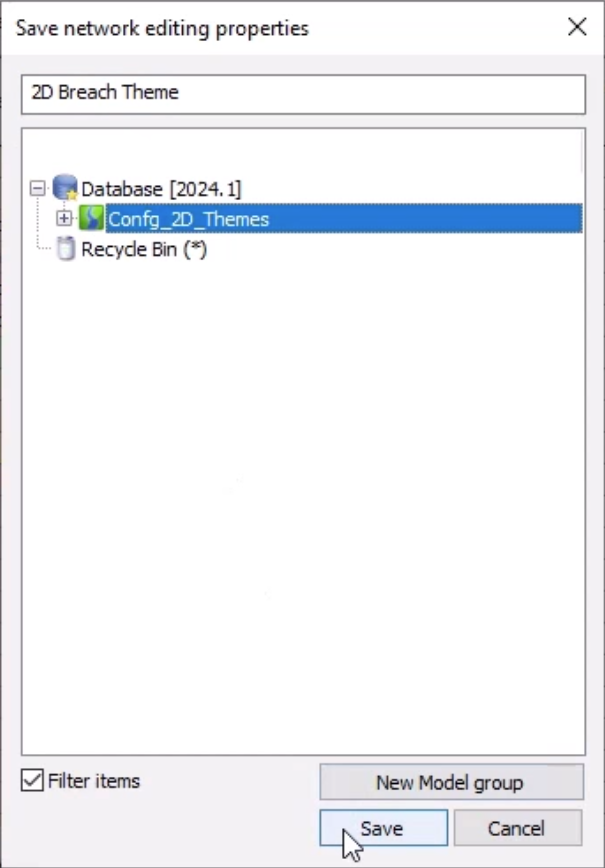
In the Network editing properties – save options dialog, Save to database object is the default selection.
05:35
In the Save network editing properties dialog, select the Database, and then enter the name “2D Breach Theme”.
05:42
Click Save, and then OK to close the Select Properties to Save dialog.
05:47
Click OK again to close the GeoPlan Properties and Themes dialog.
05:52
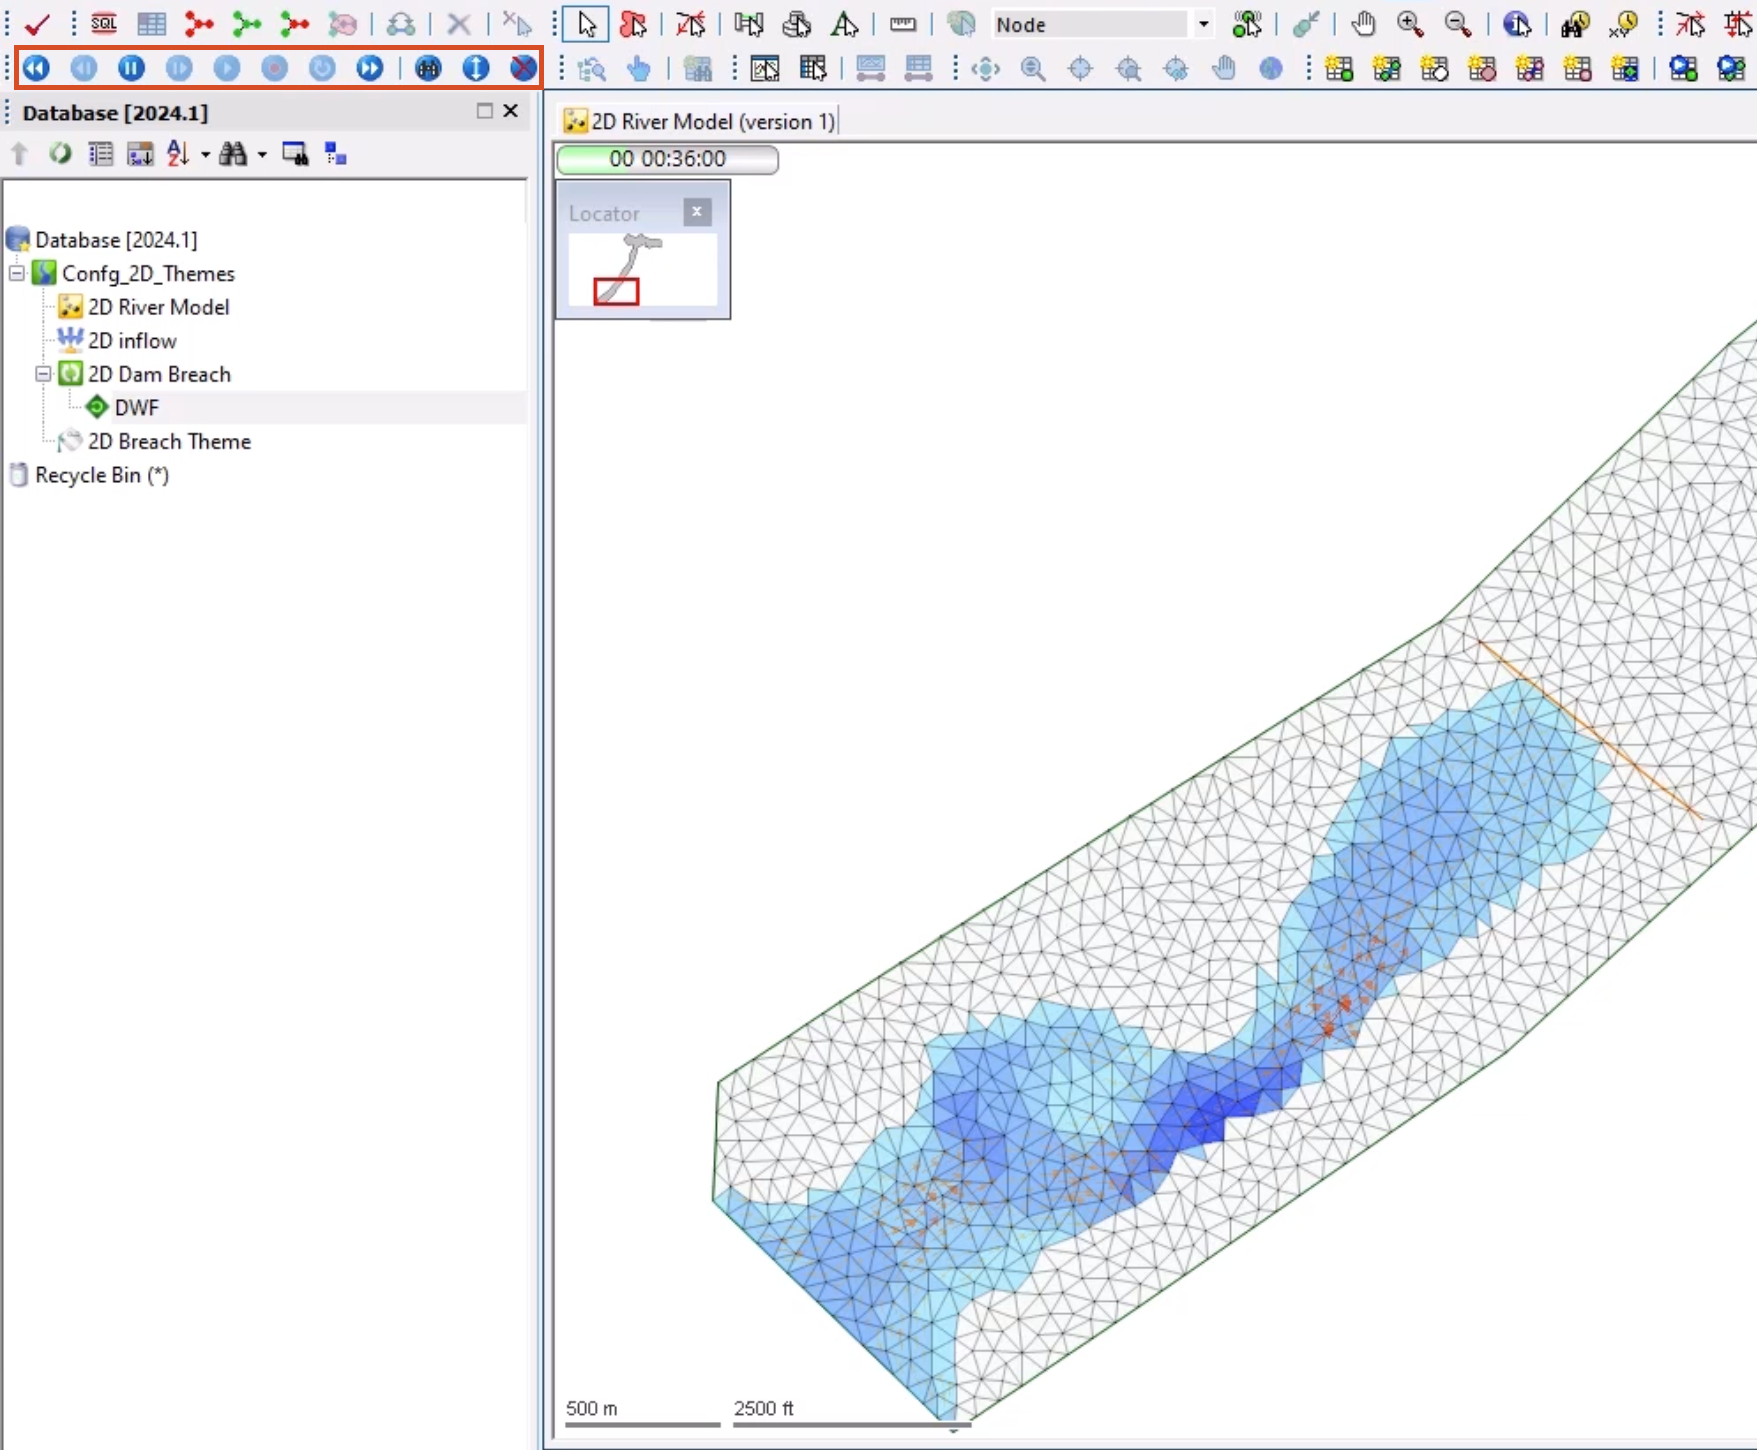
In the Explorer window, under the Database, the 2D Breach Theme is added.
05:57
To view the 2D Breach Theme applied to the simulation, on the Replay Control toolbar, select Rewind, and then Play.
06:04
As the simulation plays, water enters the model with arrows showing the direction of flow.
06:10
Darker shades of blue indicate more depth as water starts to pool and build at the structure.
06:17
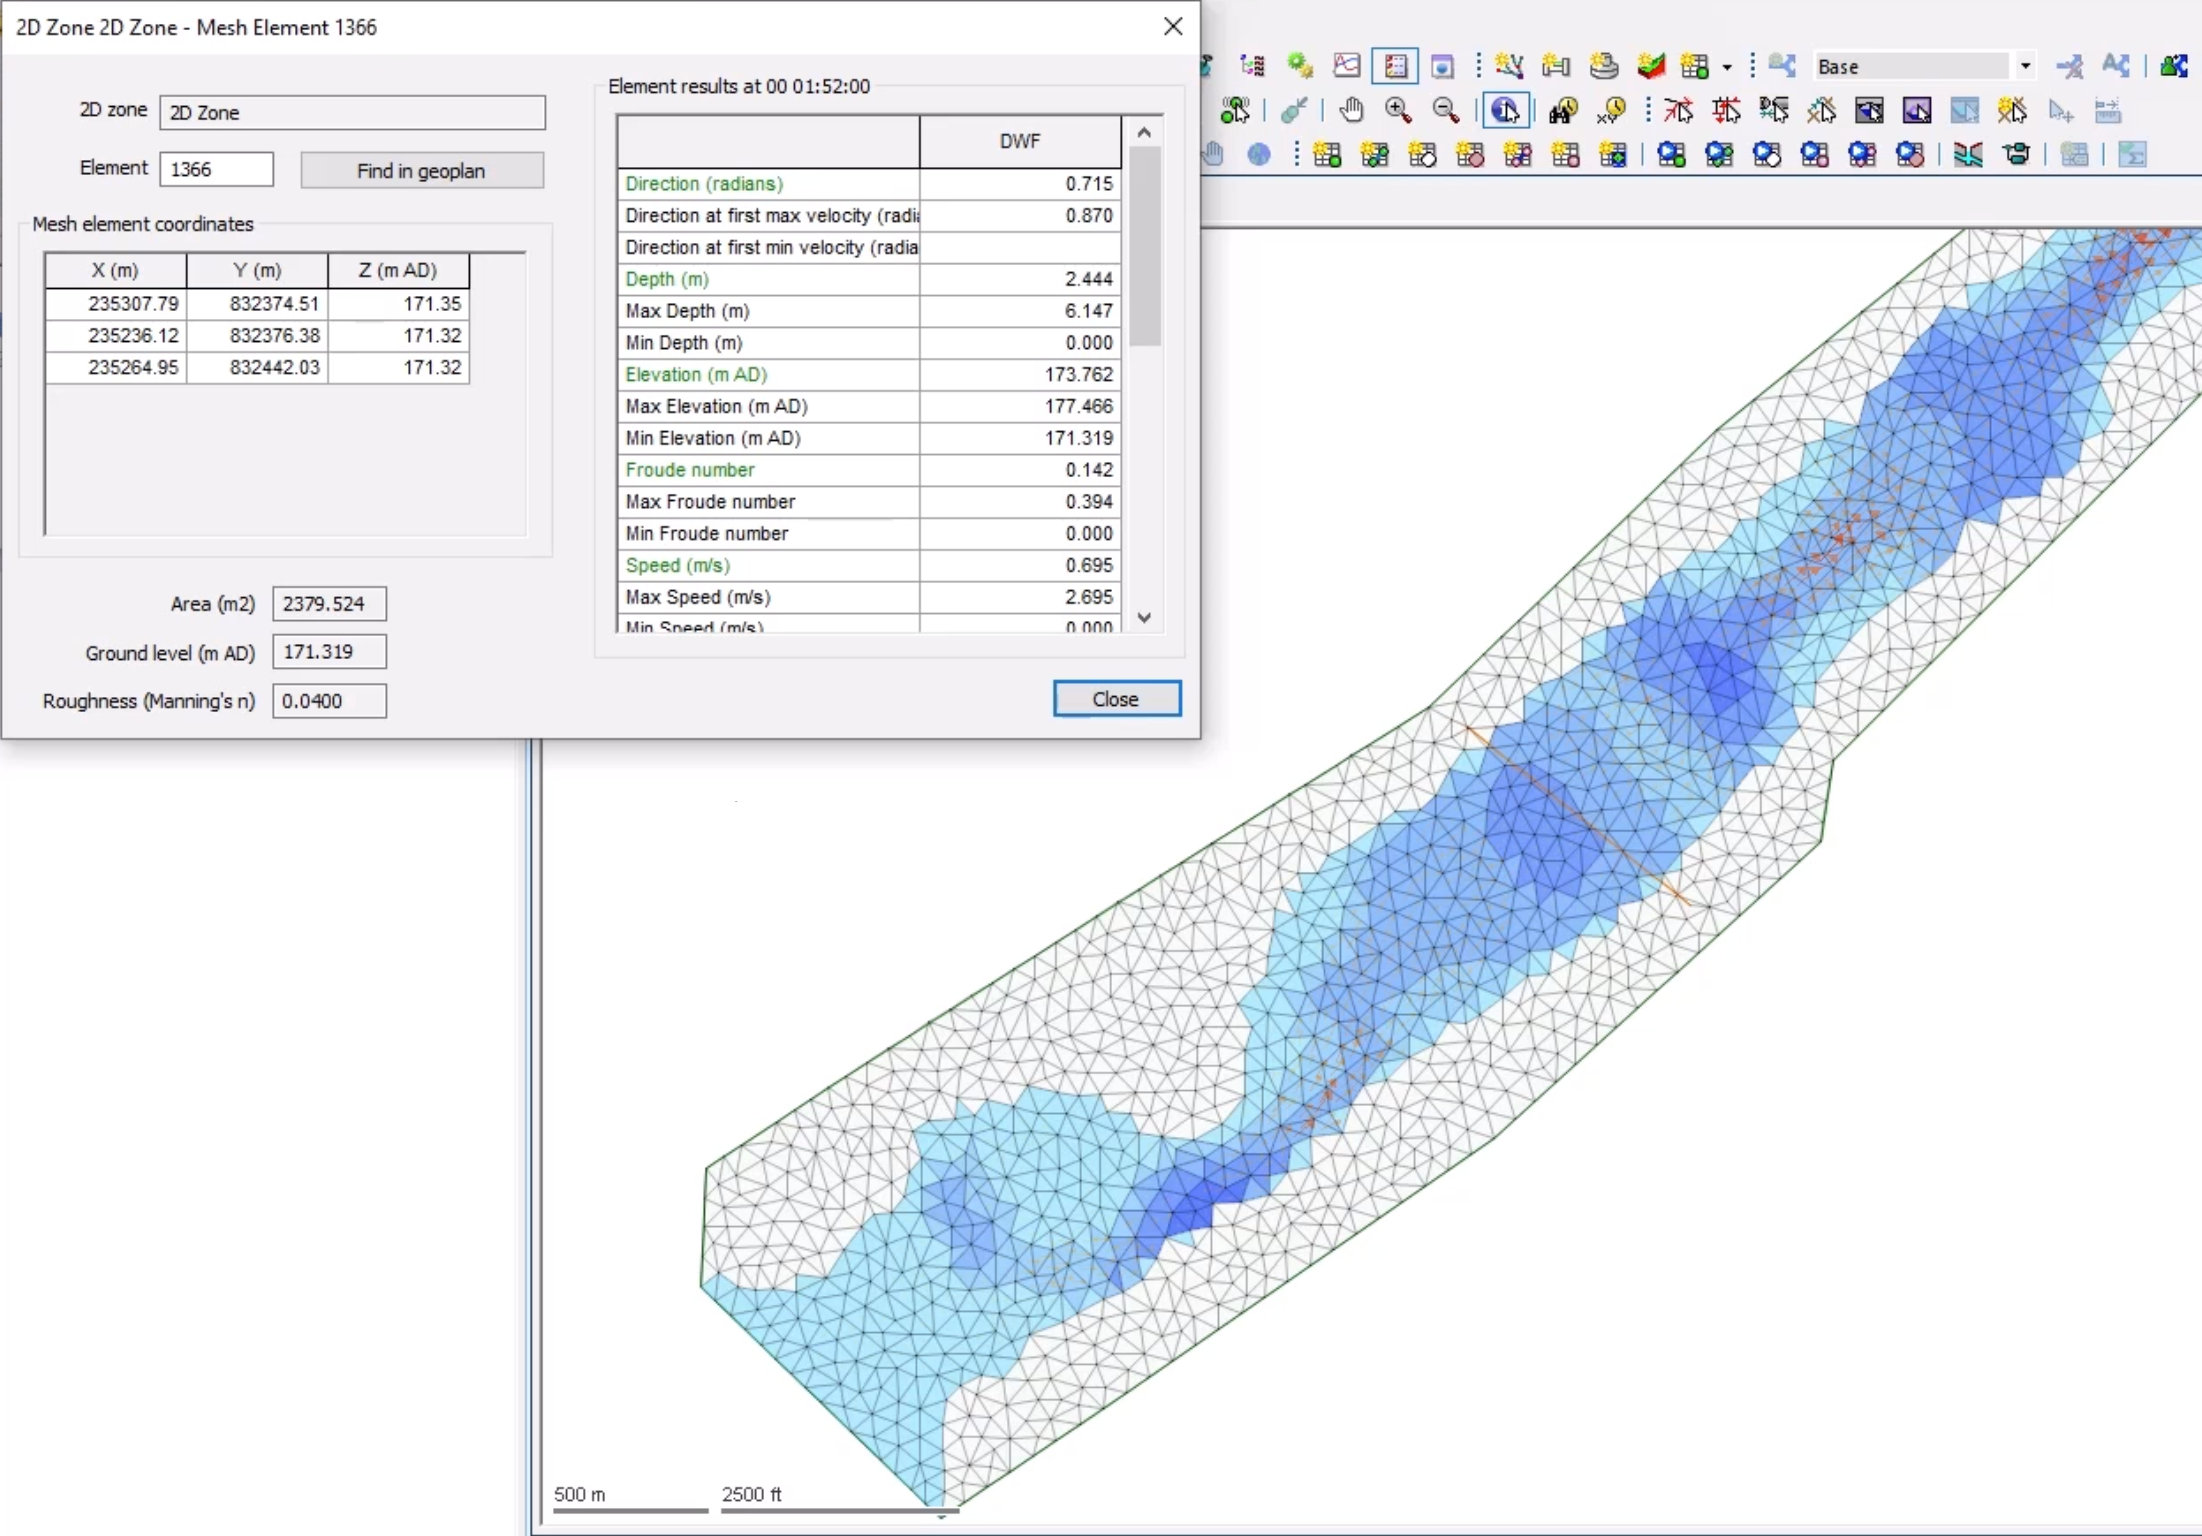
To view results for an individual element, in the GeoPlan Tools toolbar, select the Properties tool.
06:24
Click on an element.
06:26
The element properties dialogue will be shown containing the results.
06:30
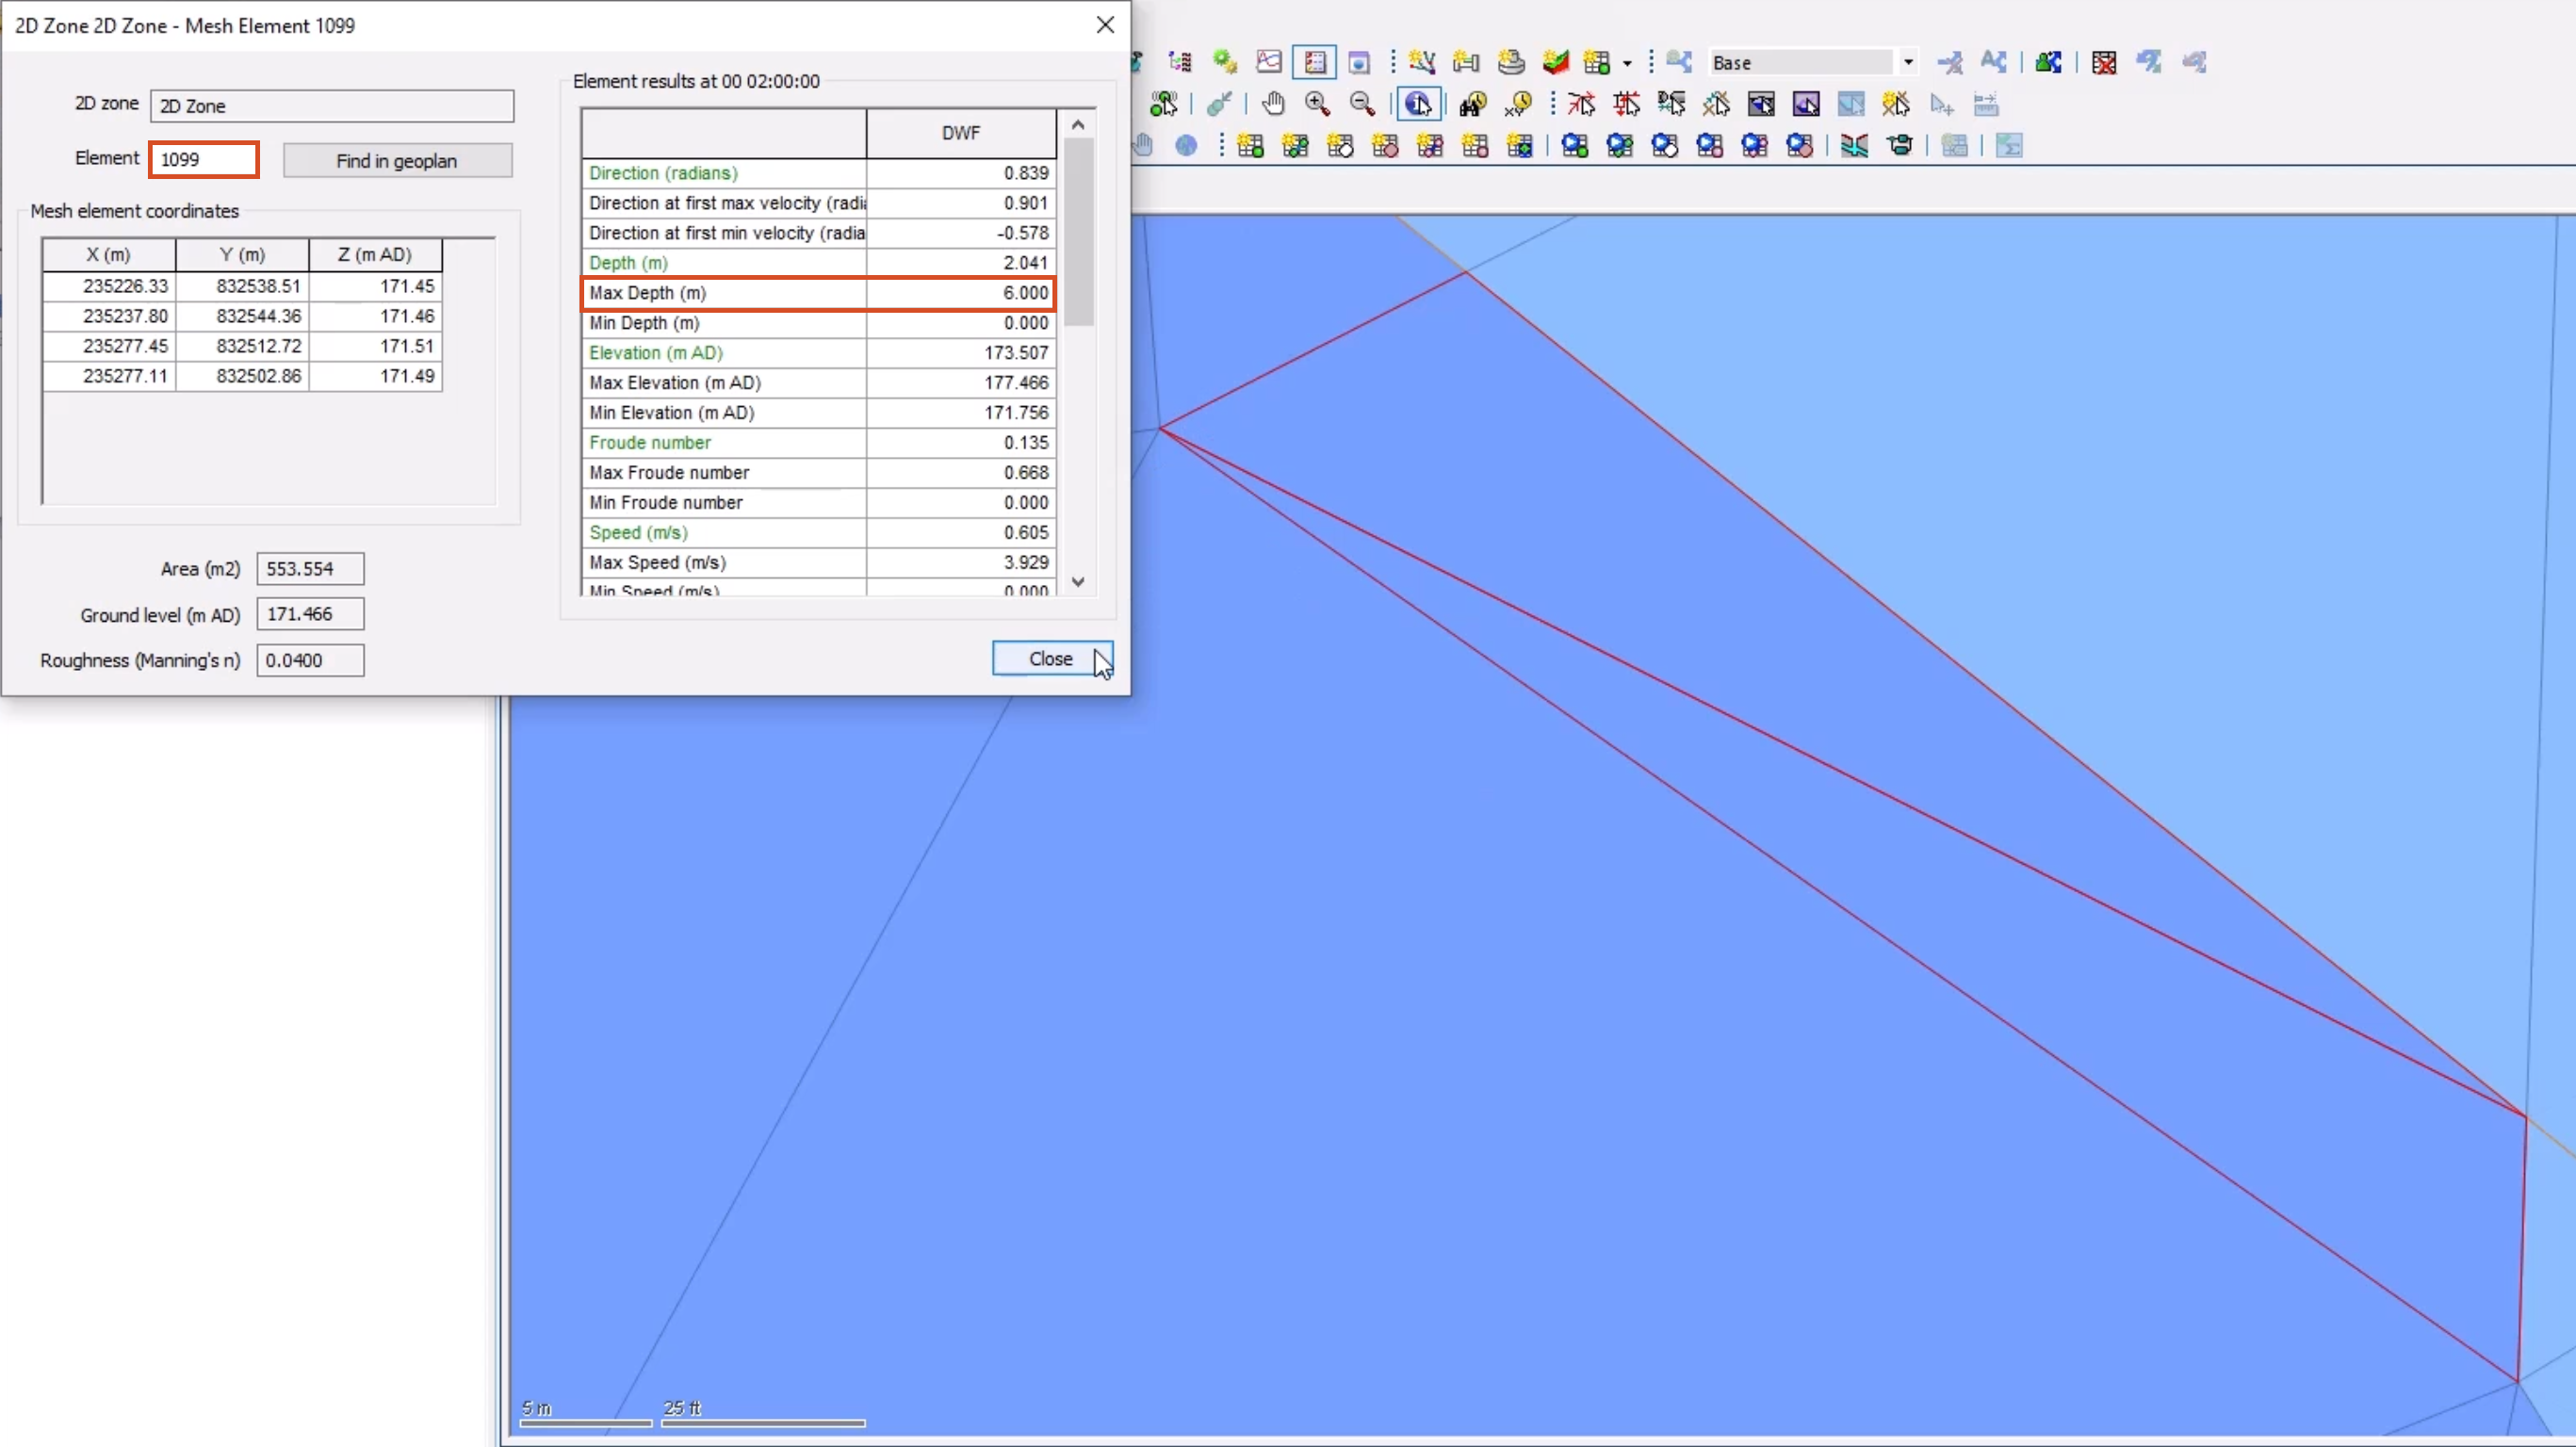
You can also navigate to a specific element.
06:34
Enter 1099 into the element field and select Find in GeoPlan.
06:39
The Max Depth (m) is recorded as 6 which is the height the base linear structure 2d is set to be fully removed.
06:48
In the Results toolbar, click Graph Pick.
06:51
Then pick an element located upstream of the base linear structure 2d.
06:56
In the Graph dialog, in the Attributes list, select Depth (m) [depth2d], and then click OK.
07:04
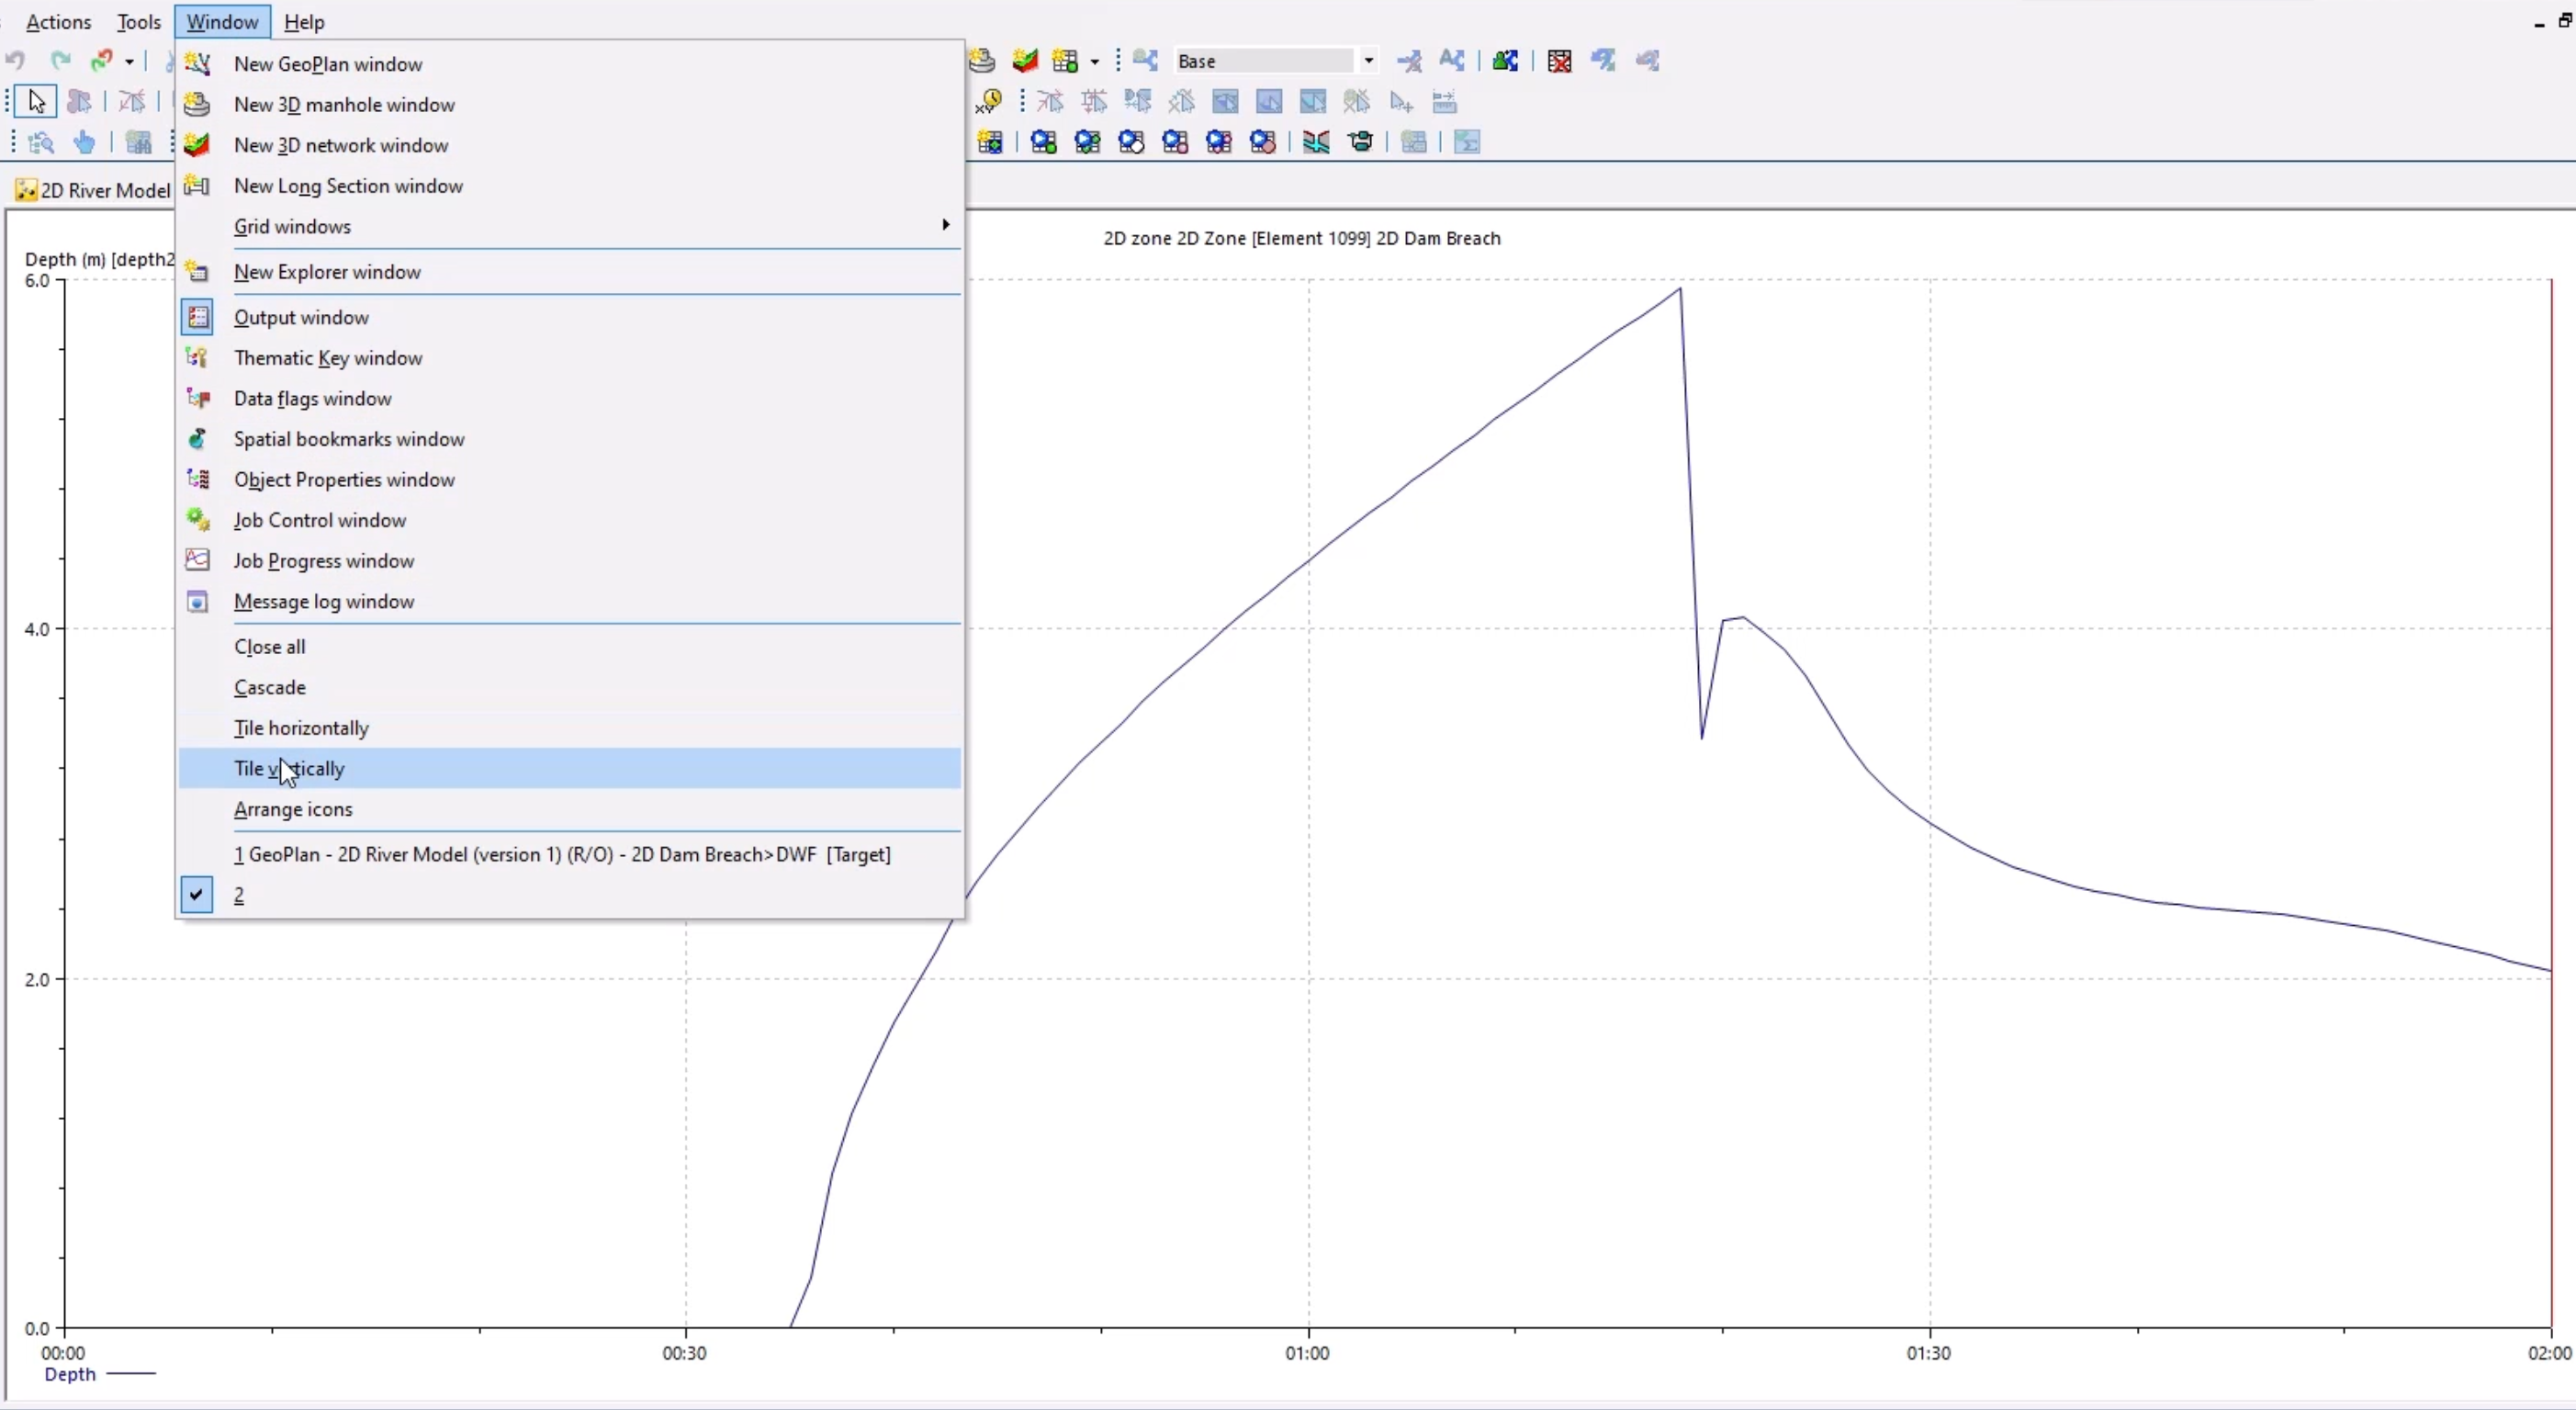
A graph displays the depth of water building at the structure, and then rapidly decreasing after it is removed.
07:11
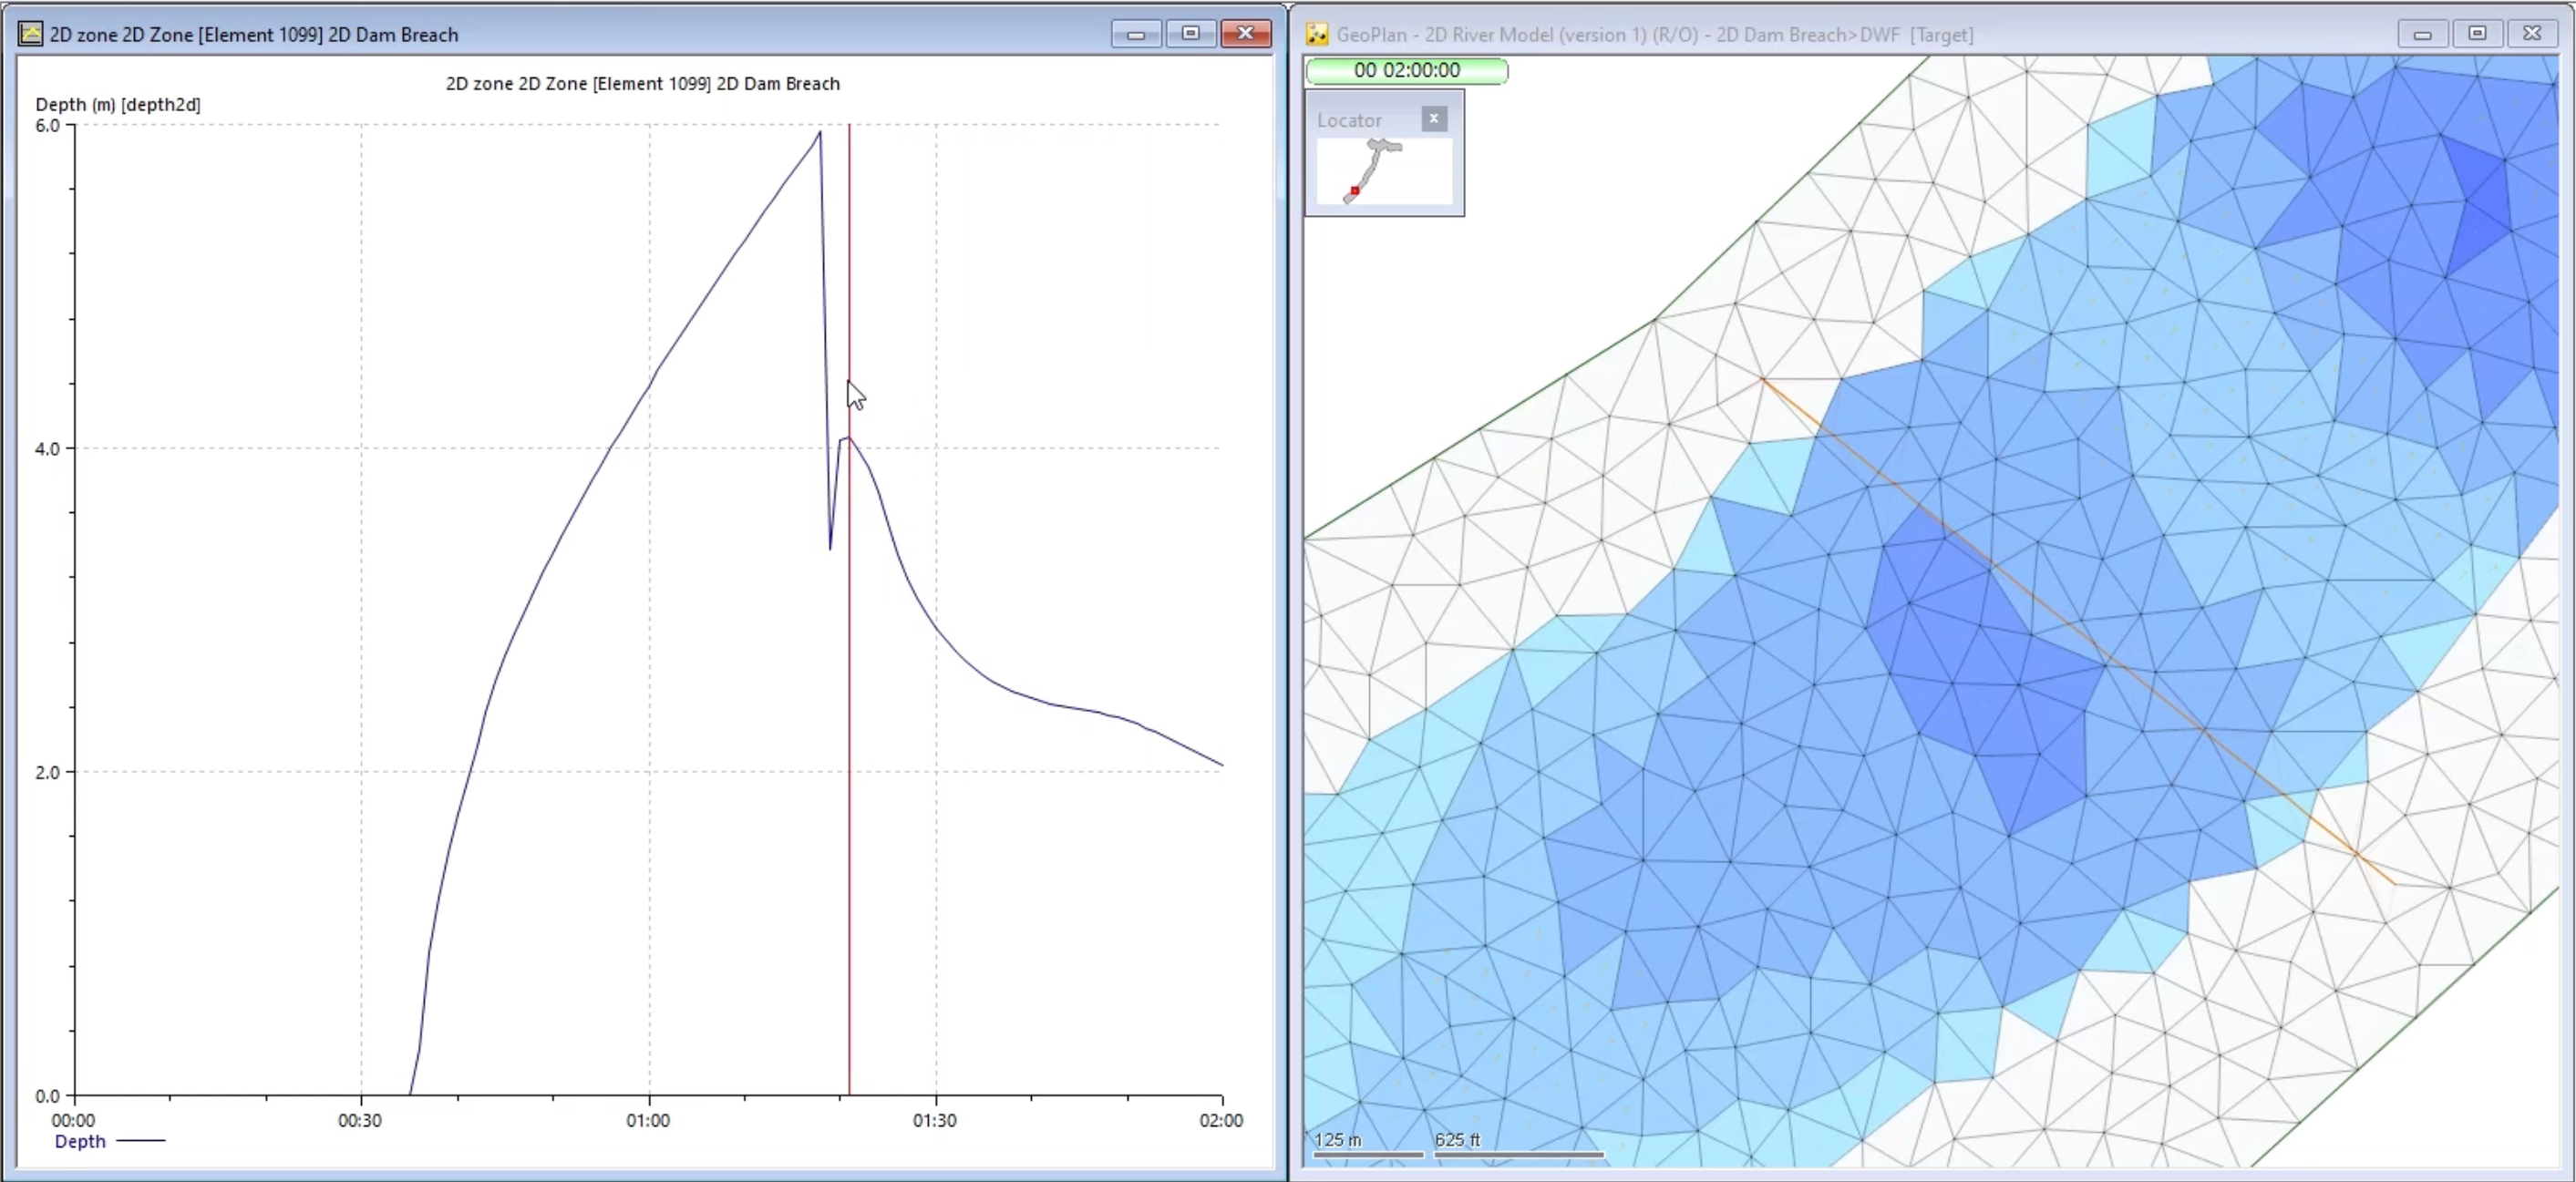
Tab this window and then select Window > Tile Vertically from the top menu.
07:16
This will now display the graph and GeoPlan side by side.
07:20
Zoom out of the GeoPlan window to get a better view.
07:23
You can drag the red line on the graph to move to that point in the simulation.
07:27
In the Replay Control toolbar, Click Rewind and then Play.
07:32
As the simulation plays, the GeoPlan will update, and the red line will progress through the graph.
07:38
The graph will not reach 6 meters as this point occurs between results timesteps.