• InfoDrainage

Sizing pipes for no surcharge criteria

Size pipes to meet no-surcharge criteria by analyzing the pipes created through the Network Design Wizard and verifying the results in the updated profile view.


00:03

once you have defined the network design criteria as has been done in this example

00:08

you then simply need to run the network design wizard to apply that criteria.

00:13

However, first you need to check that the design rainfall is ready

00:17

on the ribbon rainfall pollutants tab rainfall panel,

00:21

click rainfall manager to open it.

00:25

The rain one fs our rainfall should already be loaded but if not

00:29

use the open tool and find the file design rainfall in the data directory,

00:35

select it

00:36

and then click OK to exit the rainfall manager.

00:40

First

00:41

open the existing profile view to see the current layout of the pipes along the slope

00:47

In the tree view, ensure flow paths is expanded

00:50

and right click flow one

00:53

Select show profile and the profile Flow one window appears

00:59

zoom into the profile view.

01:02

You can see that the pipes are currently laid along

01:04

the top of the catchment surface because at this point

01:07

only the basic model build has been done.

01:11

Neither the pipe sizes nor the gradients have been calculated at this point

01:16

on the ribbon preliminary sizing tab network design panel,

01:21

click network design wizard to open it.

01:25

The first step is to specify the flow path you want to create the pipe sizes for

01:30

in this example

01:32

there is only one flow path, flow one,

01:35

so ensure it appears in the select flow path. Drop down

01:39

Notice that the pipe table is here as well

01:42

and it lists the seven pipes in the flow one. Network

01:46

for more complicated designs you would specify which

01:49

area of the design you want to size,

01:51

click next.

01:54

The next step is to enter the flow criteria.

01:58

Check that the peak flow calculation is set to U. K. Modified rational method.

02:03

Then, if necessary,

02:04

select from library and click the drop down to select the reign one event,

02:10

click next

02:12

now review the design options.

02:15

In this case you should not need to change anything here. So click next.

02:20

The calculations are complete

02:22

and you can review the summary of changes.

02:25

If you are satisfied with them,

02:27

click finish.

02:29

The network drainage report appears

02:32

here. The program reports the pipe hydraulic performance of the network.

02:36

After having resized the pipes,

02:39

review the capacity and flow values when you compare them.

02:43

You can see that for the first catchment area the capacity of 24.8

02:48

liters per second far exceeds the flow of 9.88 liters per second.

02:55

So you know that this pipe has sized plenty big enough.

02:59

If additional structures are to be built within that first area,

03:02

it is likely that the pipe will be able to accommodate the increased flow.

03:07

Now look at the pipe two values here.

03:10

The flow is closer to the capacity,

03:12

in which case for those same additional structures in the first catchment area.

03:17

This pipe may not be big enough to accommodate the greater flow

03:22

after that there is a big jump in the capacity of the next couple of pipes

03:27

likely from a greater pipe size

03:30

to see the new pipe sizes.

03:31

Open the profile view again,

03:34

right click flow one

03:35

and select show profile.

03:38

Now you can see that the pipes have been placed under the ground

03:42

Zoom in to see the pipe Diameters.

03:45

The first two pipes are 150, and then the next ones jump up in size to 225 mm,

03:52

which is not surprising considering the slope

03:56

zoom out again and you can see that the pipes have been laid much deeper in the ground,

03:60

upslope and downslope.

04:02

This is because the design had to meet either the

04:05

slope criteria or the velocity criteria that was specified.

Video transcript

00:03

once you have defined the network design criteria as has been done in this example

00:08

you then simply need to run the network design wizard to apply that criteria.

00:13

However, first you need to check that the design rainfall is ready

00:17

on the ribbon rainfall pollutants tab rainfall panel,

00:21

click rainfall manager to open it.

00:25

The rain one fs our rainfall should already be loaded but if not

00:29

use the open tool and find the file design rainfall in the data directory,

00:35

select it

00:36

and then click OK to exit the rainfall manager.

00:40

First

00:41

open the existing profile view to see the current layout of the pipes along the slope

00:47

In the tree view, ensure flow paths is expanded

00:50

and right click flow one

00:53

Select show profile and the profile Flow one window appears

00:59

zoom into the profile view.

01:02

You can see that the pipes are currently laid along

01:04

the top of the catchment surface because at this point

01:07

only the basic model build has been done.

01:11

Neither the pipe sizes nor the gradients have been calculated at this point

01:16

on the ribbon preliminary sizing tab network design panel,

01:21

click network design wizard to open it.

01:25

The first step is to specify the flow path you want to create the pipe sizes for

01:30

in this example

01:32

there is only one flow path, flow one,

01:35

so ensure it appears in the select flow path. Drop down

01:39

Notice that the pipe table is here as well

01:42

and it lists the seven pipes in the flow one. Network

01:46

for more complicated designs you would specify which

01:49

area of the design you want to size,

01:51

click next.

01:54

The next step is to enter the flow criteria.

01:58

Check that the peak flow calculation is set to U. K. Modified rational method.

02:03

Then, if necessary,

02:04

select from library and click the drop down to select the reign one event,

02:10

click next

02:12

now review the design options.

02:15

In this case you should not need to change anything here. So click next.

02:20

The calculations are complete

02:22

and you can review the summary of changes.

02:25

If you are satisfied with them,

02:27

click finish.

02:29

The network drainage report appears

02:32

here. The program reports the pipe hydraulic performance of the network.

02:36

After having resized the pipes,

02:39

review the capacity and flow values when you compare them.

02:43

You can see that for the first catchment area the capacity of 24.8

02:48

liters per second far exceeds the flow of 9.88 liters per second.

02:55

So you know that this pipe has sized plenty big enough.

02:59

If additional structures are to be built within that first area,

03:02

it is likely that the pipe will be able to accommodate the increased flow.

03:07

Now look at the pipe two values here.

03:10

The flow is closer to the capacity,

03:12

in which case for those same additional structures in the first catchment area.

03:17

This pipe may not be big enough to accommodate the greater flow

03:22

after that there is a big jump in the capacity of the next couple of pipes

03:27

likely from a greater pipe size

03:30

to see the new pipe sizes.

03:31

Open the profile view again,

03:34

right click flow one

03:35

and select show profile.

03:38

Now you can see that the pipes have been placed under the ground

03:42

Zoom in to see the pipe Diameters.

03:45

The first two pipes are 150, and then the next ones jump up in size to 225 mm,

03:52

which is not surprising considering the slope

03:56

zoom out again and you can see that the pipes have been laid much deeper in the ground,

03:60

upslope and downslope.

04:02

This is because the design had to meet either the

04:05

slope criteria or the velocity criteria that was specified.

Step-by-step:

Once you have defined the Network Design criteria, as has been done in this example, you then simply need to run the Network Design Wizard to apply that criteria.

First, load the rainfall study if it is not already:

  1. On the ribbon, Rainfall Pollutants tab, Rainfall panel, click Rainfall Manager.
  2. In the Rainfall Manager toolbar, click Open.
  3. Browse to and open the file design rainfall.idrx.
  4. Click OK to close the Rainfall Manager.
  5. In the Tree View, expand Flow Paths.
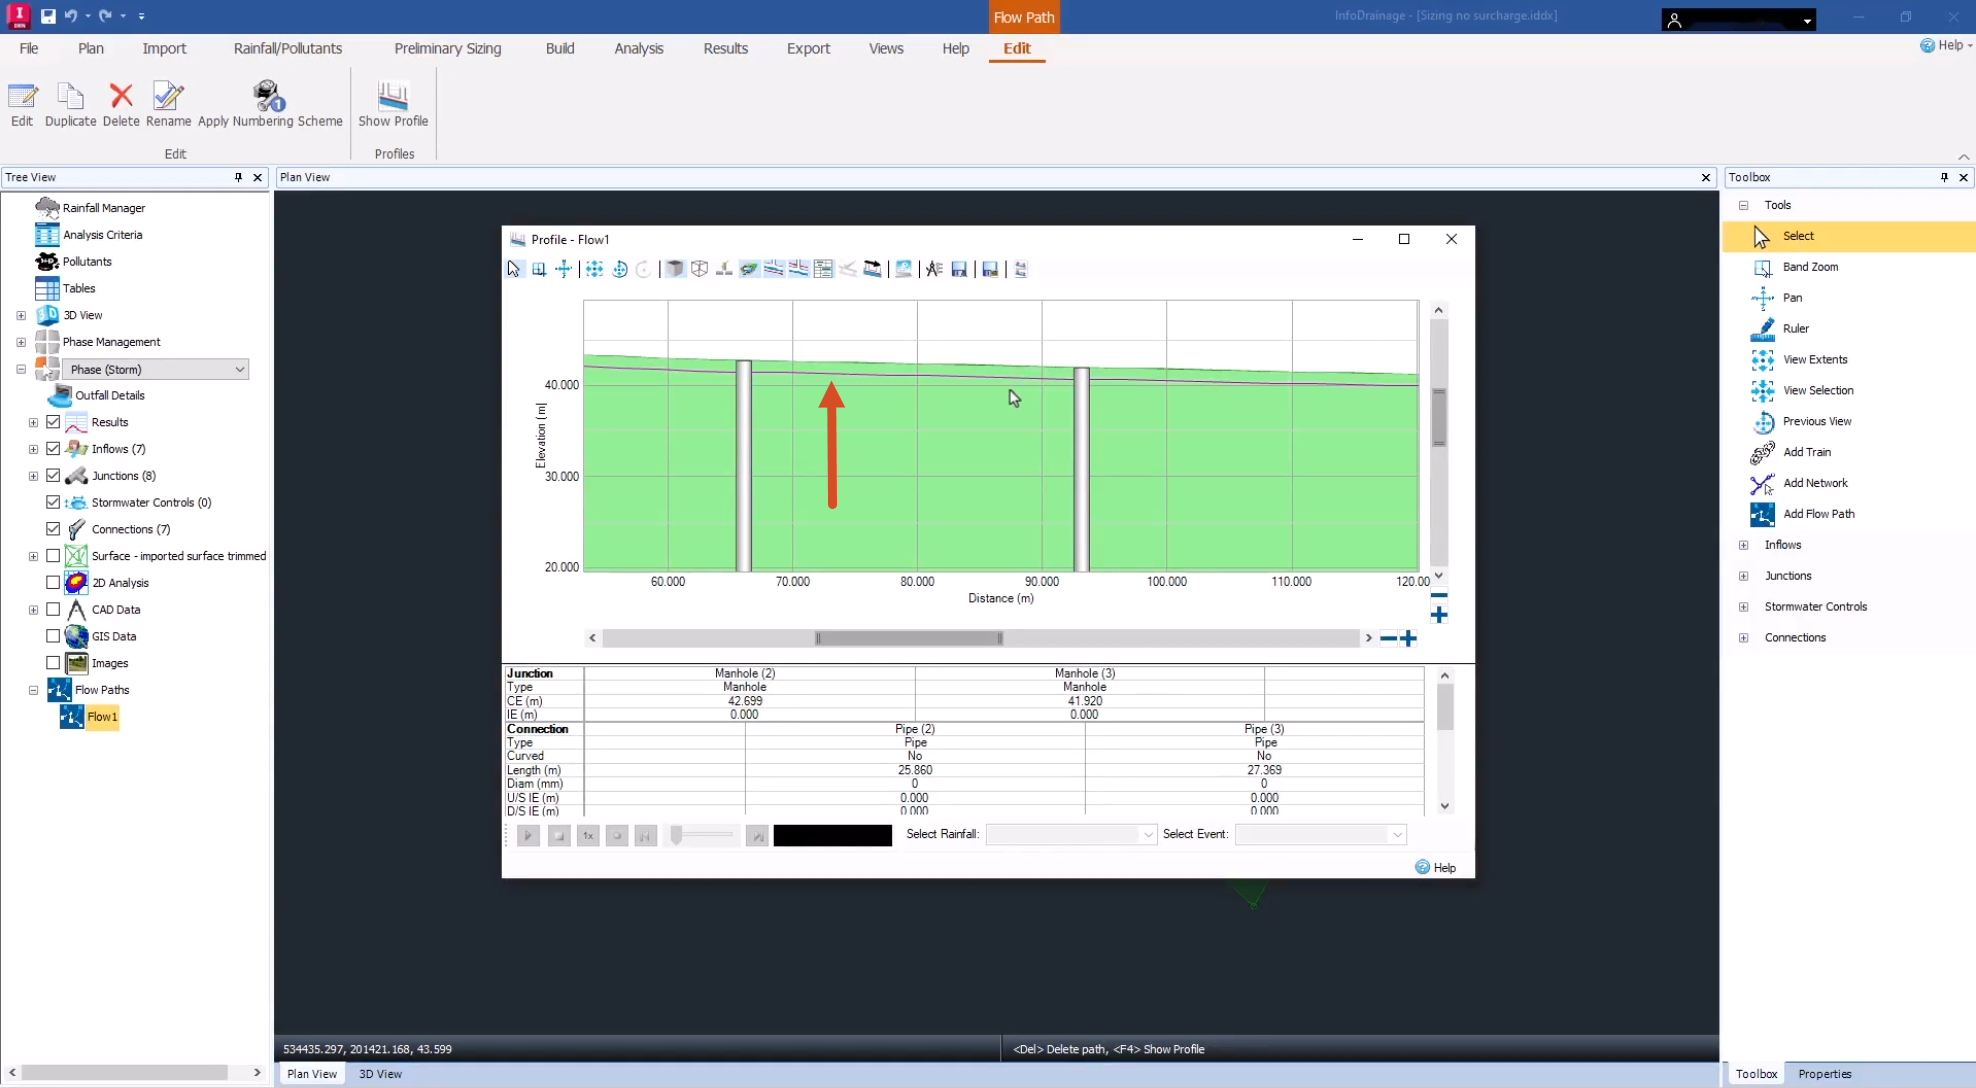
  6. Right-click Flow1 and select Show Profile.

In the Profile – Flow1 dialog box, notice that the pipes are currently laid along the top of the catchment surface.

  • The InfoDrainage interface, with the Profile – Flow1 dialog box open, showing the profile view of the flow path named, ‘Flow1’. The pipes show as just lines, since they have no sizes or depth assigned to them yet.

To specify the flow path and assign a depth to the pipes:

  1. On the ribbon, Preliminary Sizing tab, Network Design panel, click Network Design Wizard.
  2. In the Network Design Wizard, Select Flow Path page, expand the Select Flow Path drop-down and select Flow1.
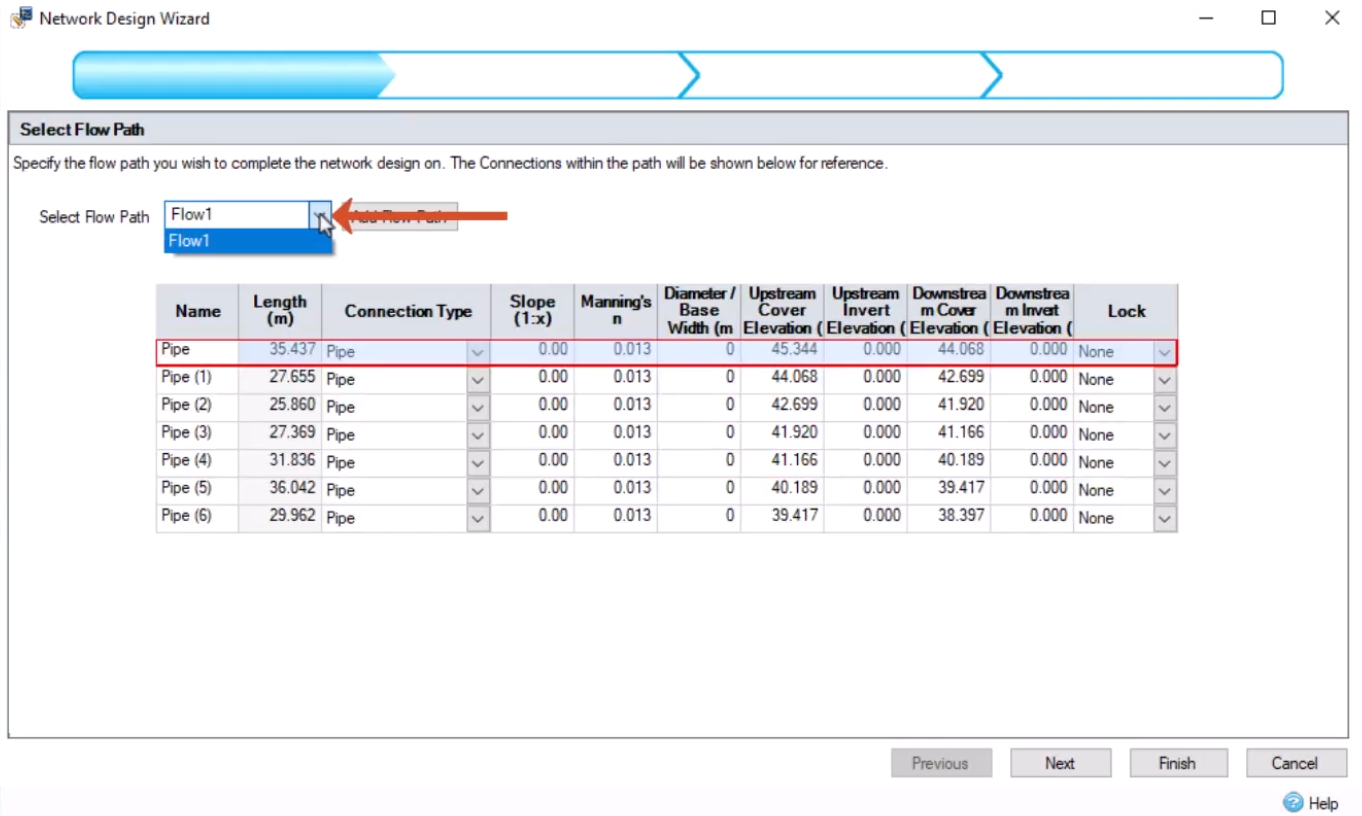
    The Network Design Wizard, Select Flow Path page. The Flow1 flow path is being selected, and the pipes are all listed below in the table.
  3. Click Next.
  4. On the Enter Flow Criteria page, check that the Peak Flow Calculation is set to (UK) Modified Rational Method.
    The Network Design Wizard, Enter Flow Criteria page. The Peak Flow Calculation is being selected and called out.
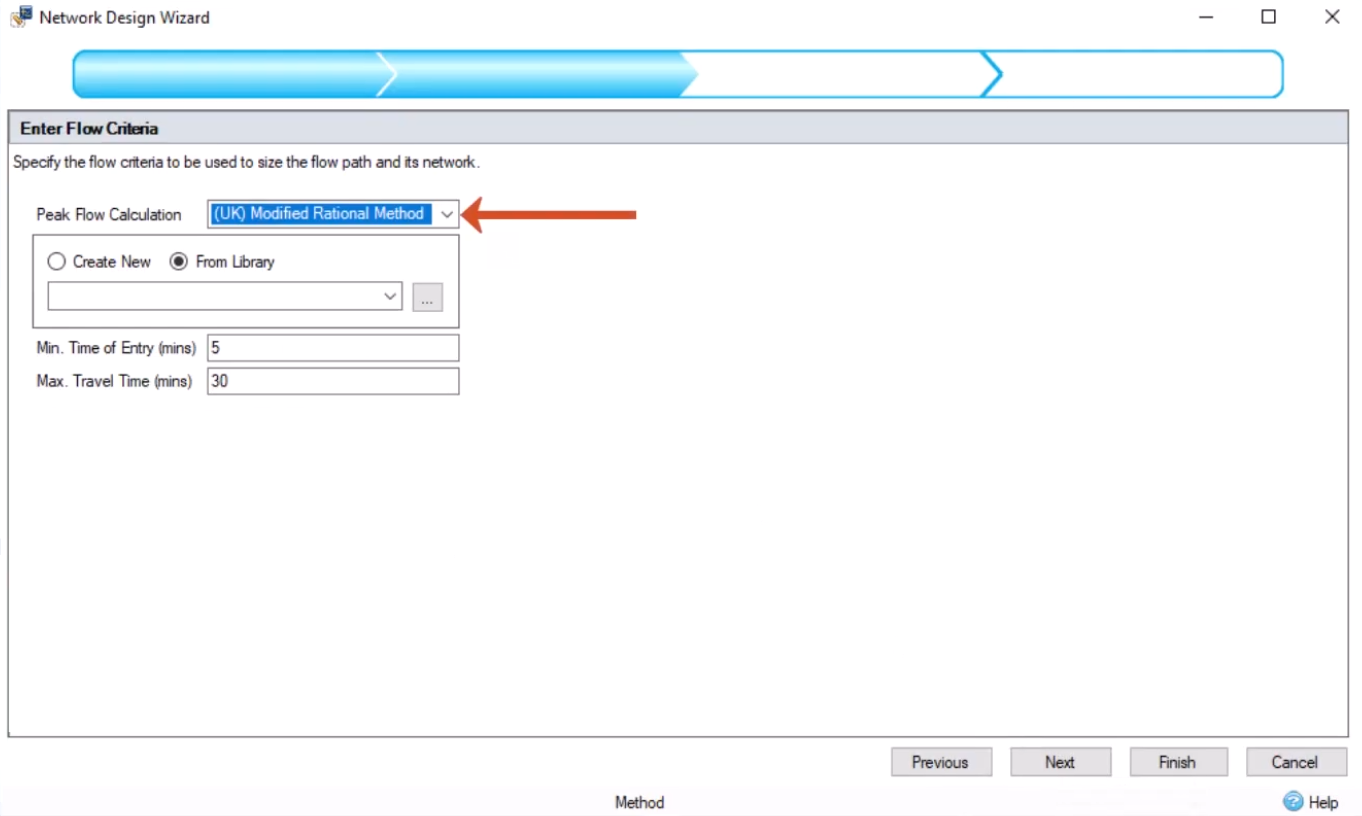
  5. Enable From Library.
  6. Expand the drop-down and select Rain 1.
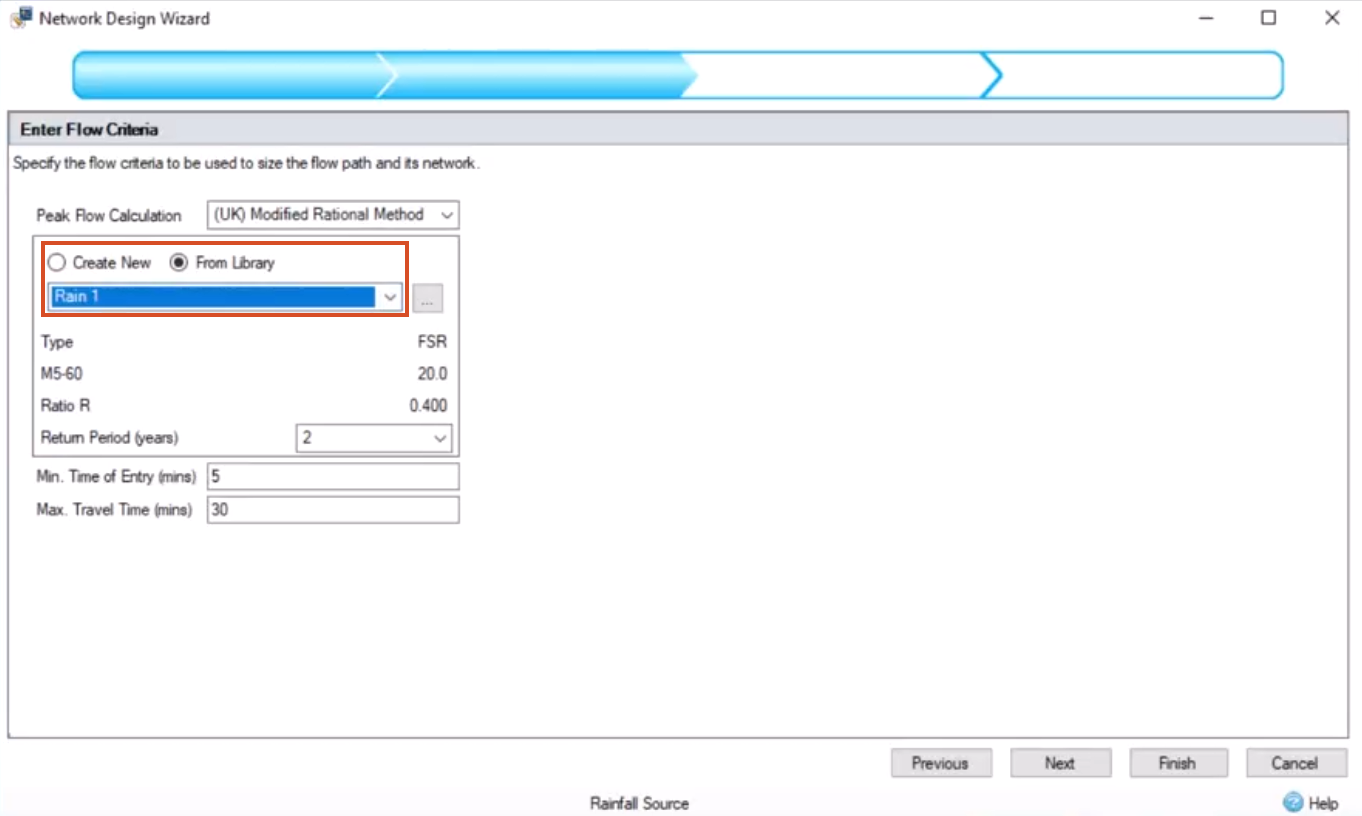
    The Network Design Wizard.
  7. Click Next.
  8. On the Enter Design Options page, review the design options. In this case, these were configured previously, so you should not need to change anything.
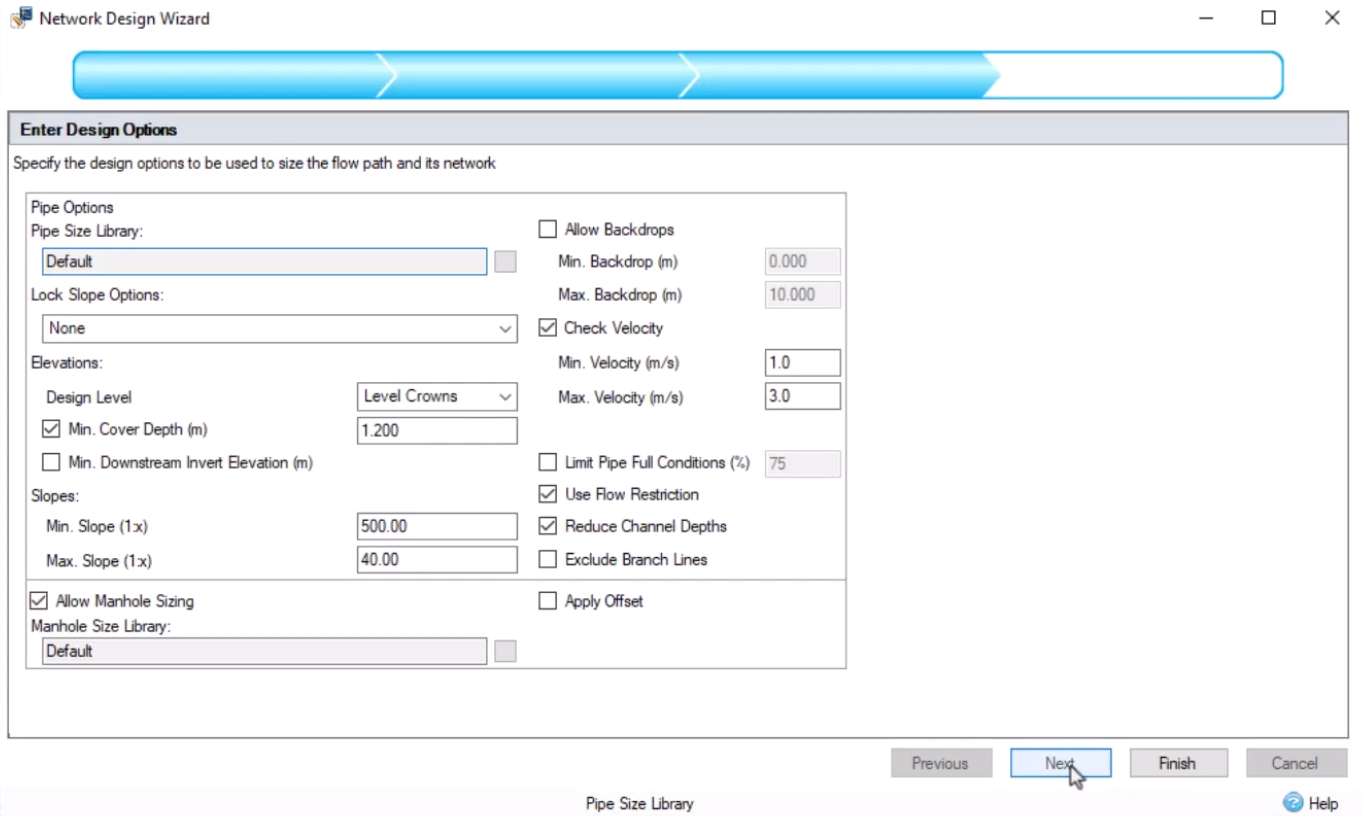
    The Network Design Wizard.
  9. Click Next.
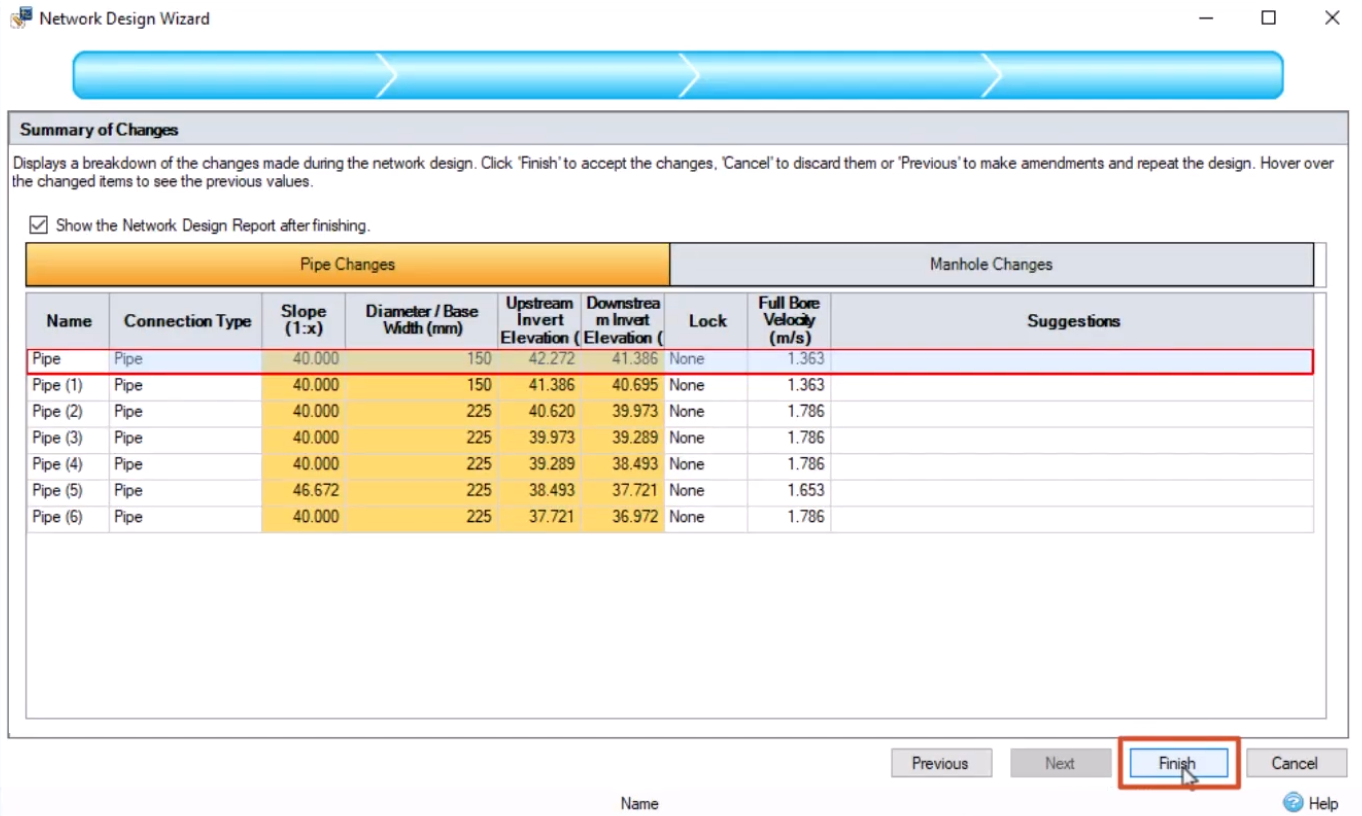
  10. Once the calculations are complete, you can review the Summary of Changes. If you are satisfied with them, click Finish.
    The Network Design Wizard,
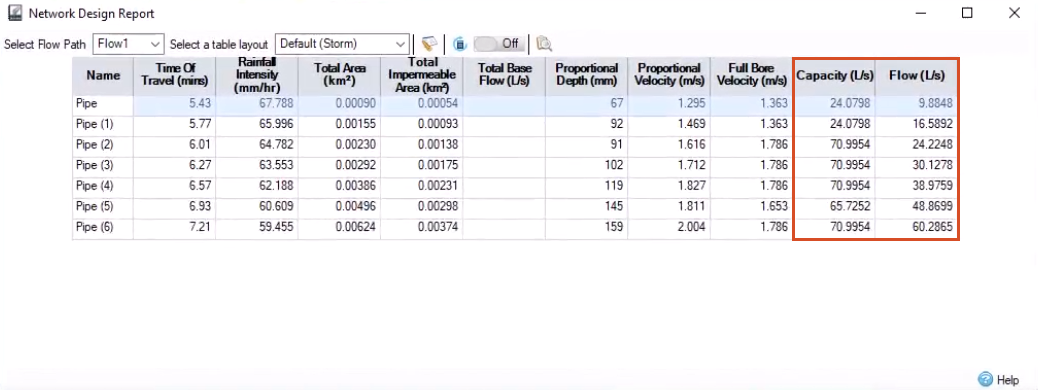
  11. In the Network Design Report dialog box, review and compare the Capacity vs. the Flow of each pipe in the network.

For the first catchment area, the capacity of 24.08 liters per second far exceeds the flow of 9.88 liters per second, so this pipe is sized plenty big enough. If additional structures are to be built within that first area, it is likely that the pipe will be able to accommodate the increased flow.

Now look at the Pipe (2) values. Here, the flow is closer to the capacity, in which case, for those same additional structures in the first catchment area, this pipe may not be big enough to accommodate the greater flow.

After that, there is a big jump in the capacity of the next couple of pipes, likely from a greater size pipe.

  • The Network Design Report,
  1. To see the new pipe sizes, right-click Flow1 and select Show Profile.
  2. Note the sizes and placement of the pipes in the profile.

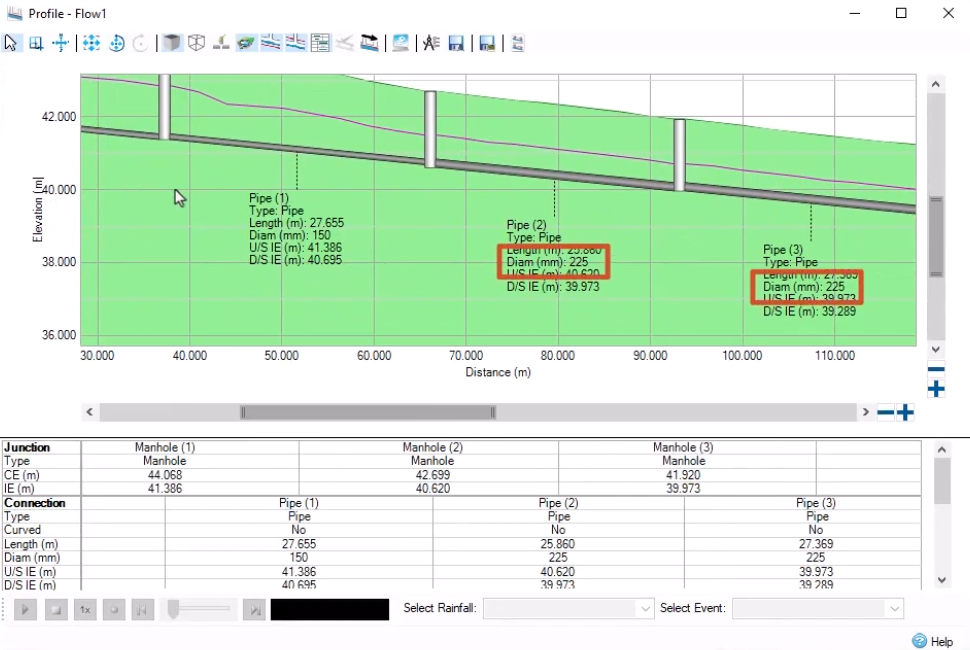
The pipes have been laid much deeper in the ground upslope than downslope. This is because the design had to meet either the slope criteria or the velocity criteria that was specified.

Was this information helpful?