00:04
When using info works. WS pro there may be times when you need to use themes.
00:09
Themes are useful when you want to see how a
00:11
group of objects is behaving by color coding them.
00:16
you will perform a rezone in your network and
00:19
then use themes to see how water pressure changes
00:23
with the session. 04 base scenario open in the GEO plan
00:27
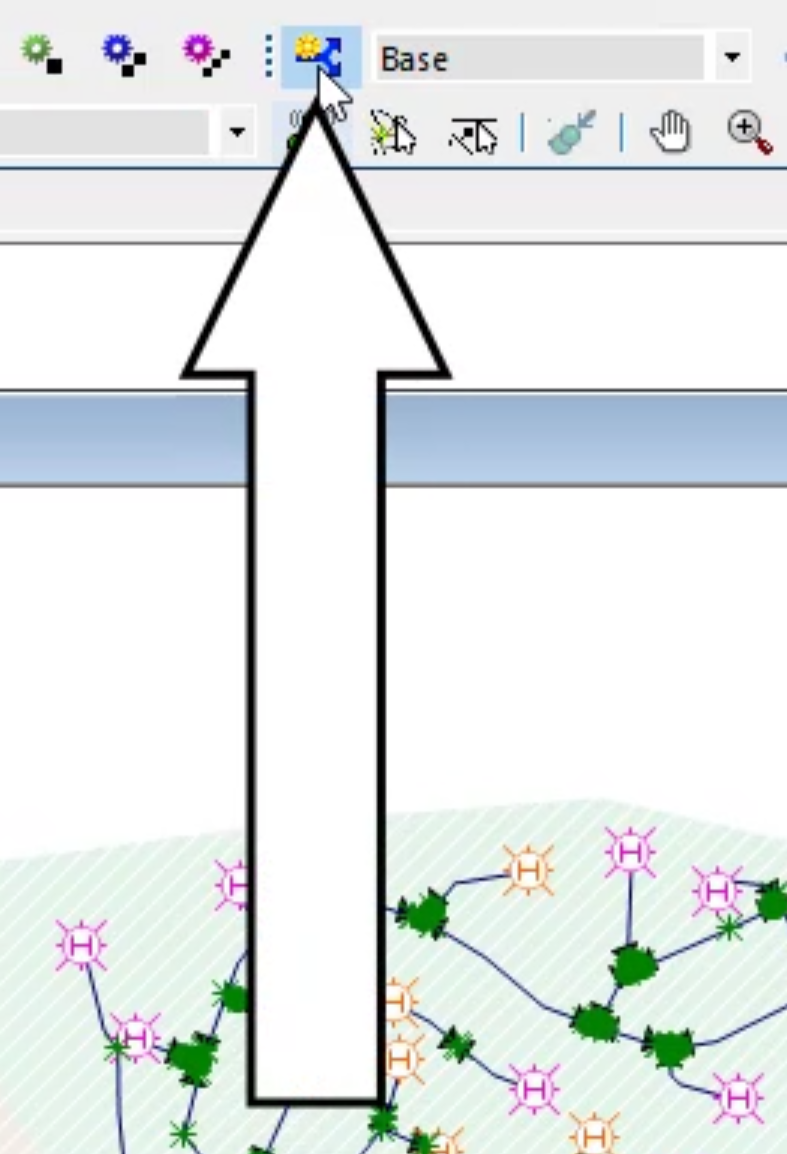
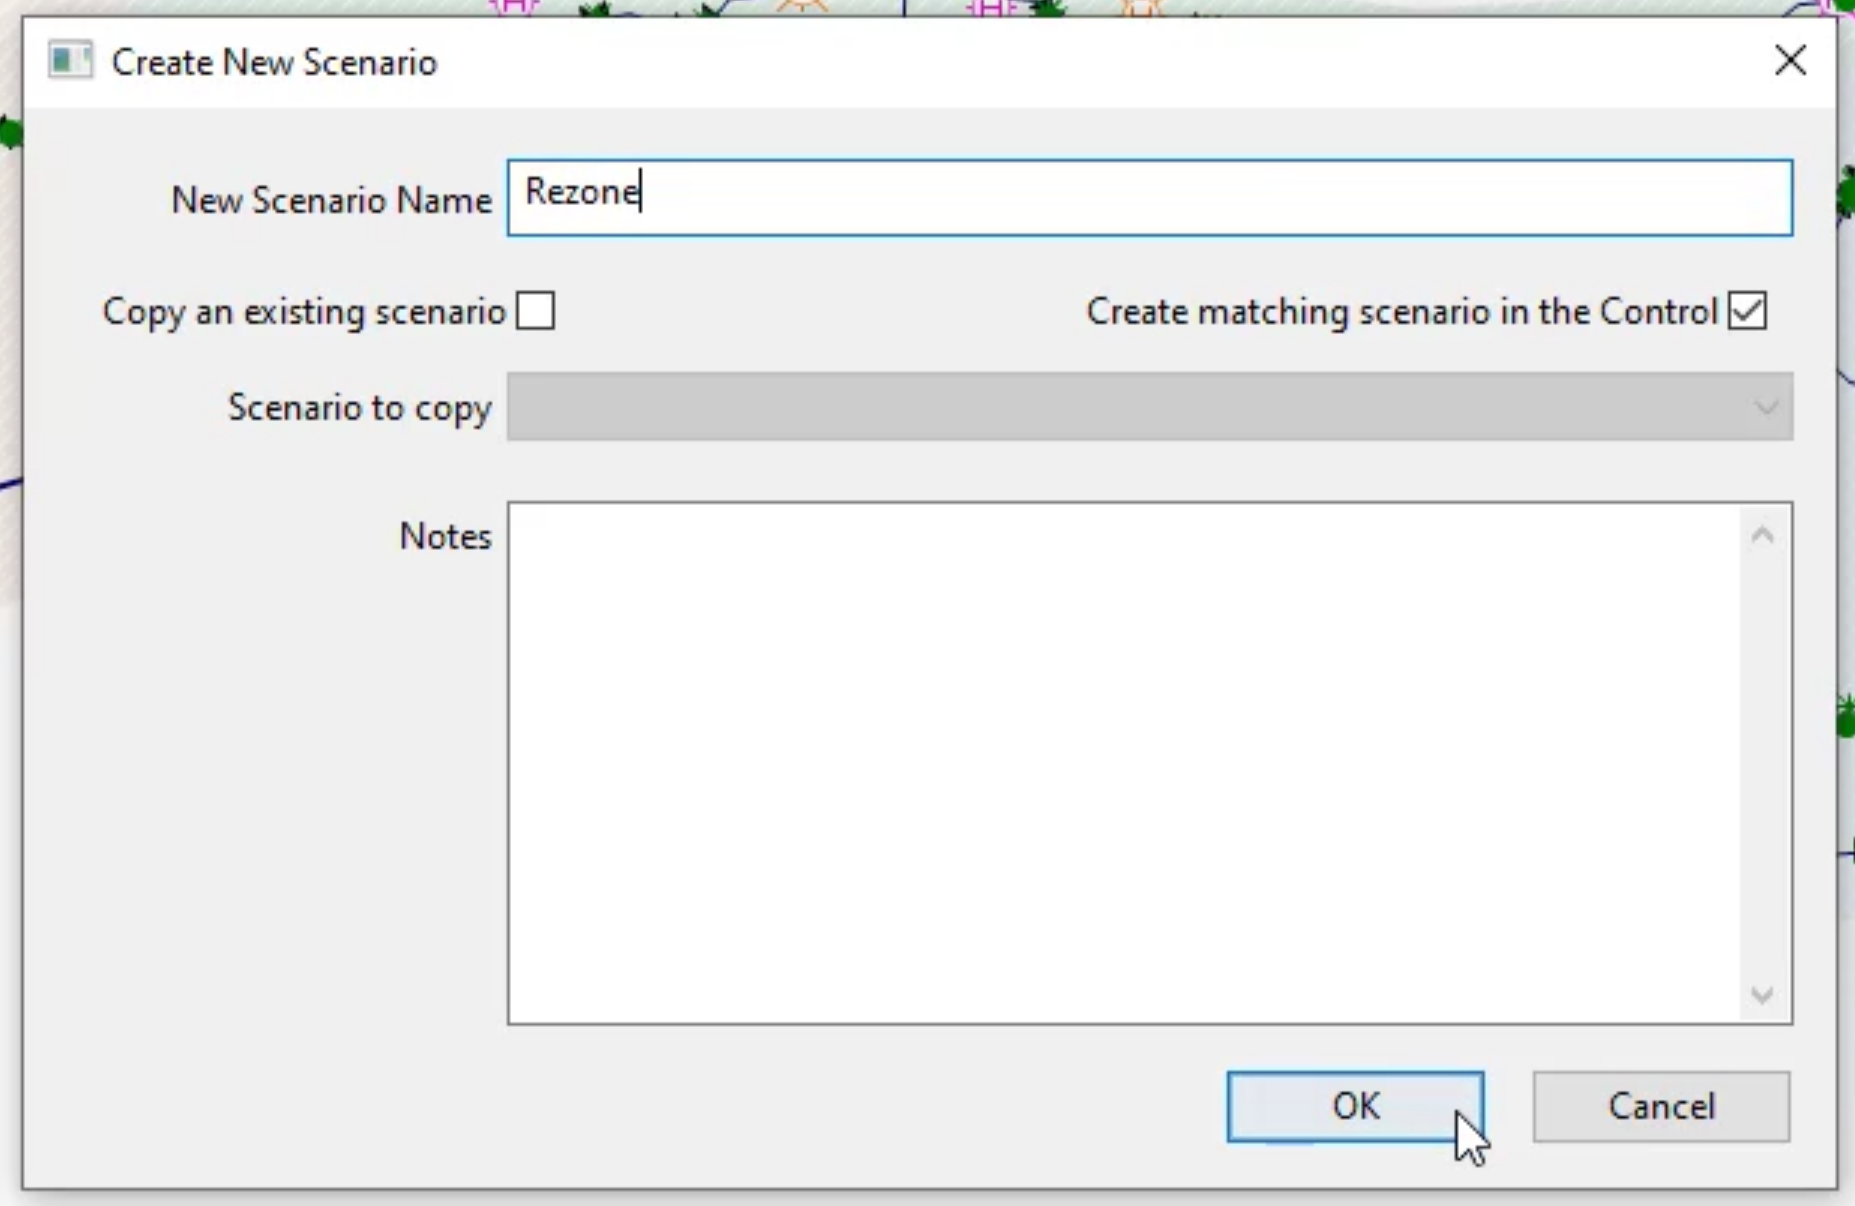
in the toolbar. Click the create new scenario button
00:33
in the create new scenario dialogue. Enter the name rezone
00:40
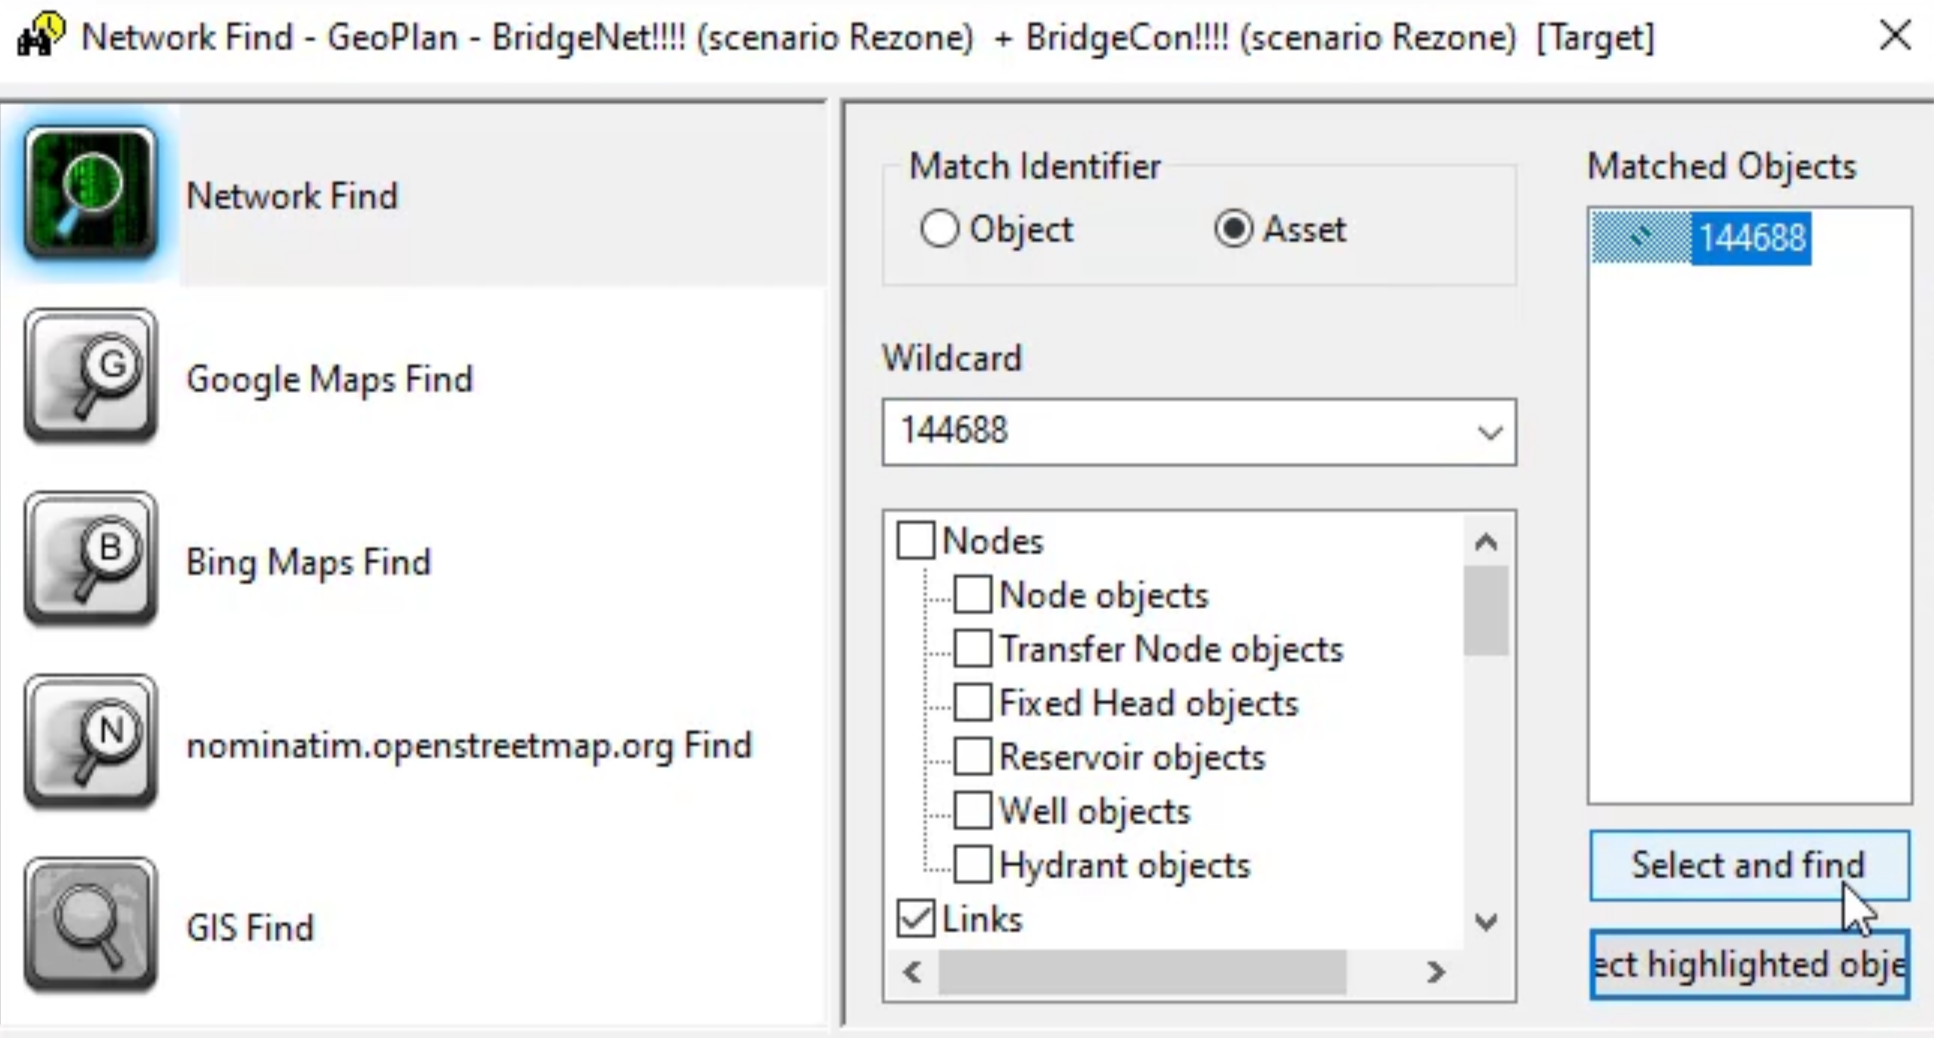
Now find the pipe with the asset ID 144 688.
00:46
You will be closing the pipe to simulate a burst or similar problem.
00:51
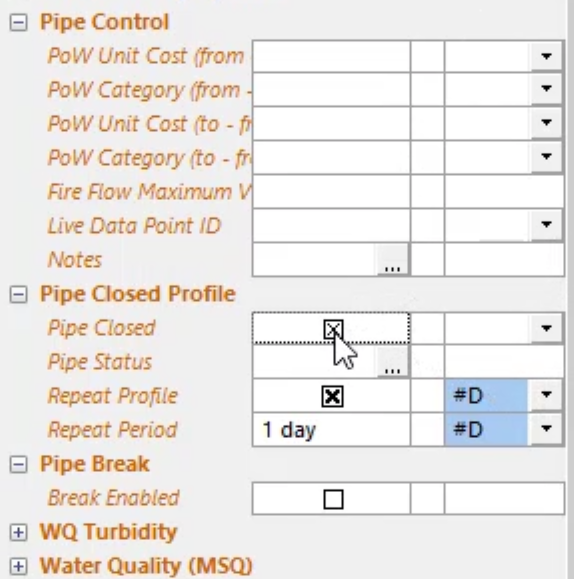
Open the pipe's properties and scroll in the window to find the pipe closed row.
00:58
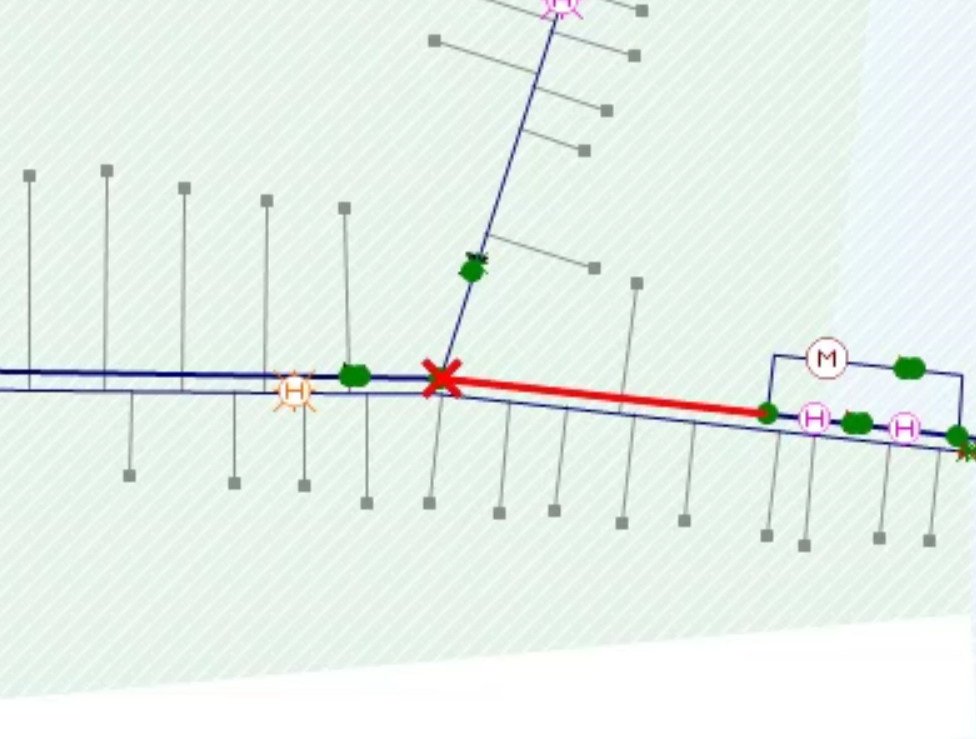
as soon as you do notice that in the GEO plan, A red X appears on the pipe.
01:05
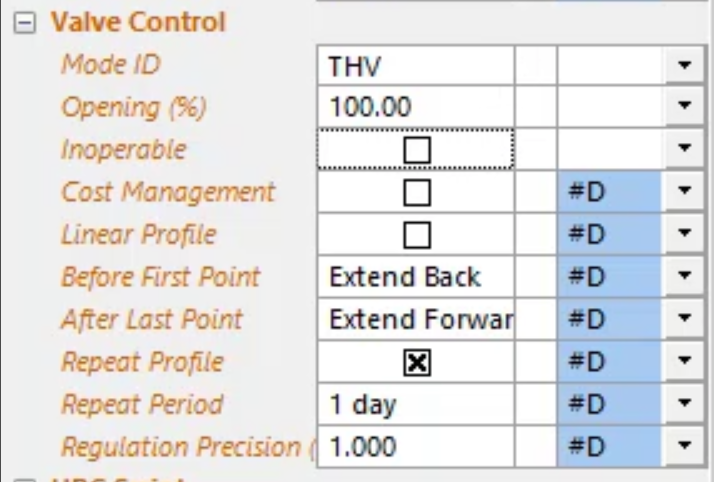
Next find the valve with the asset ID 203 4, 298 and open its properties.
01:12
Find the opening percentage row and type in a value of 100.
01:18
you might open the valve to reroute water around
01:21
the damaged pipe to avoid interruption to the supply.
01:25
Commit the changes you just made to both the network and control
01:31
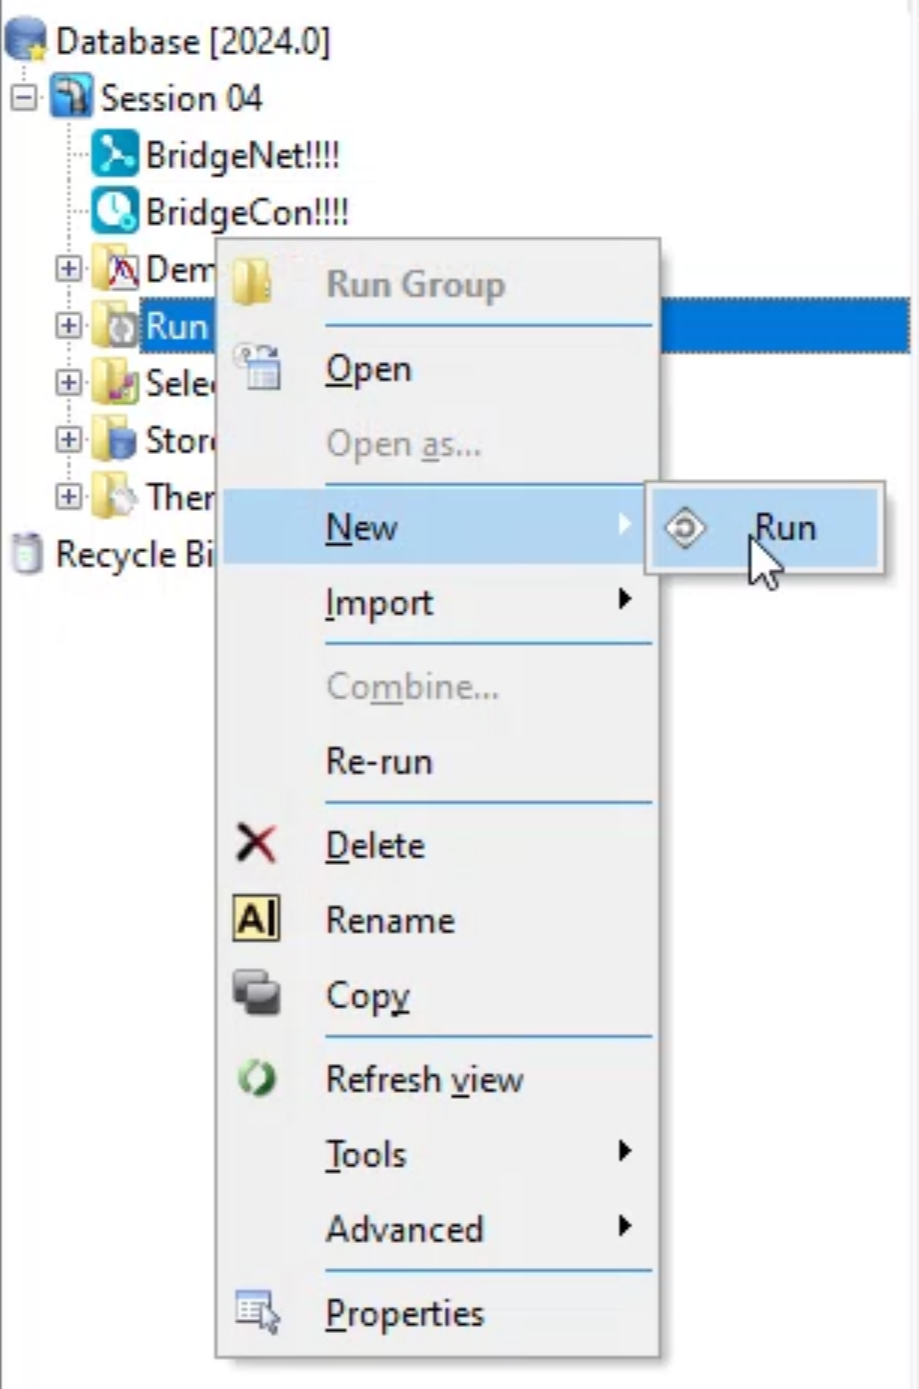
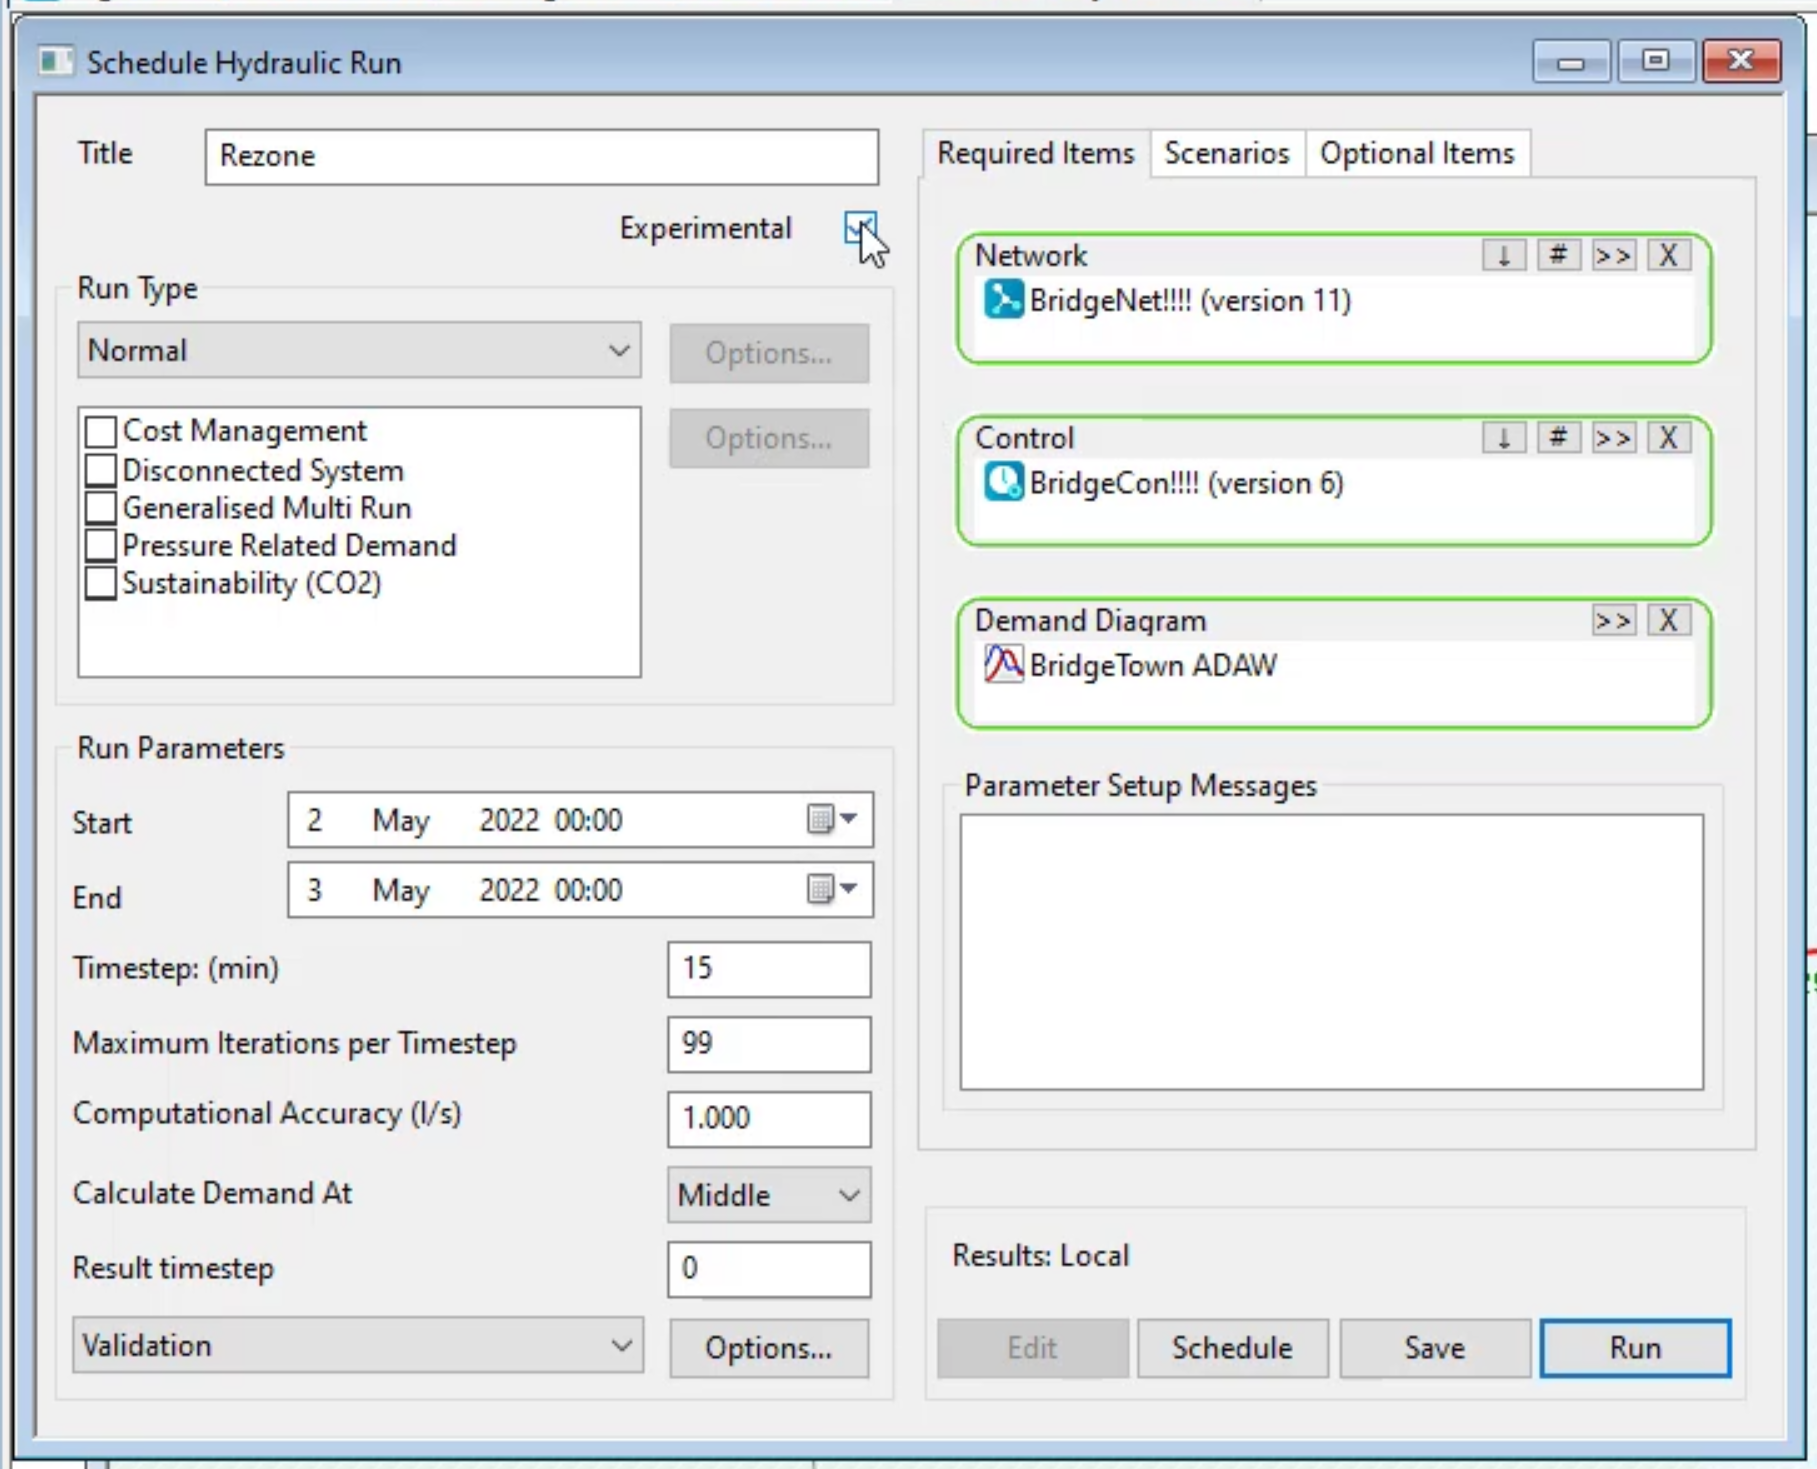
next. Create a new run and title it. Rezone
01:37
click and drag the bridge net network into the network group box.
01:41
Make sure the experimental option is enabled
01:46
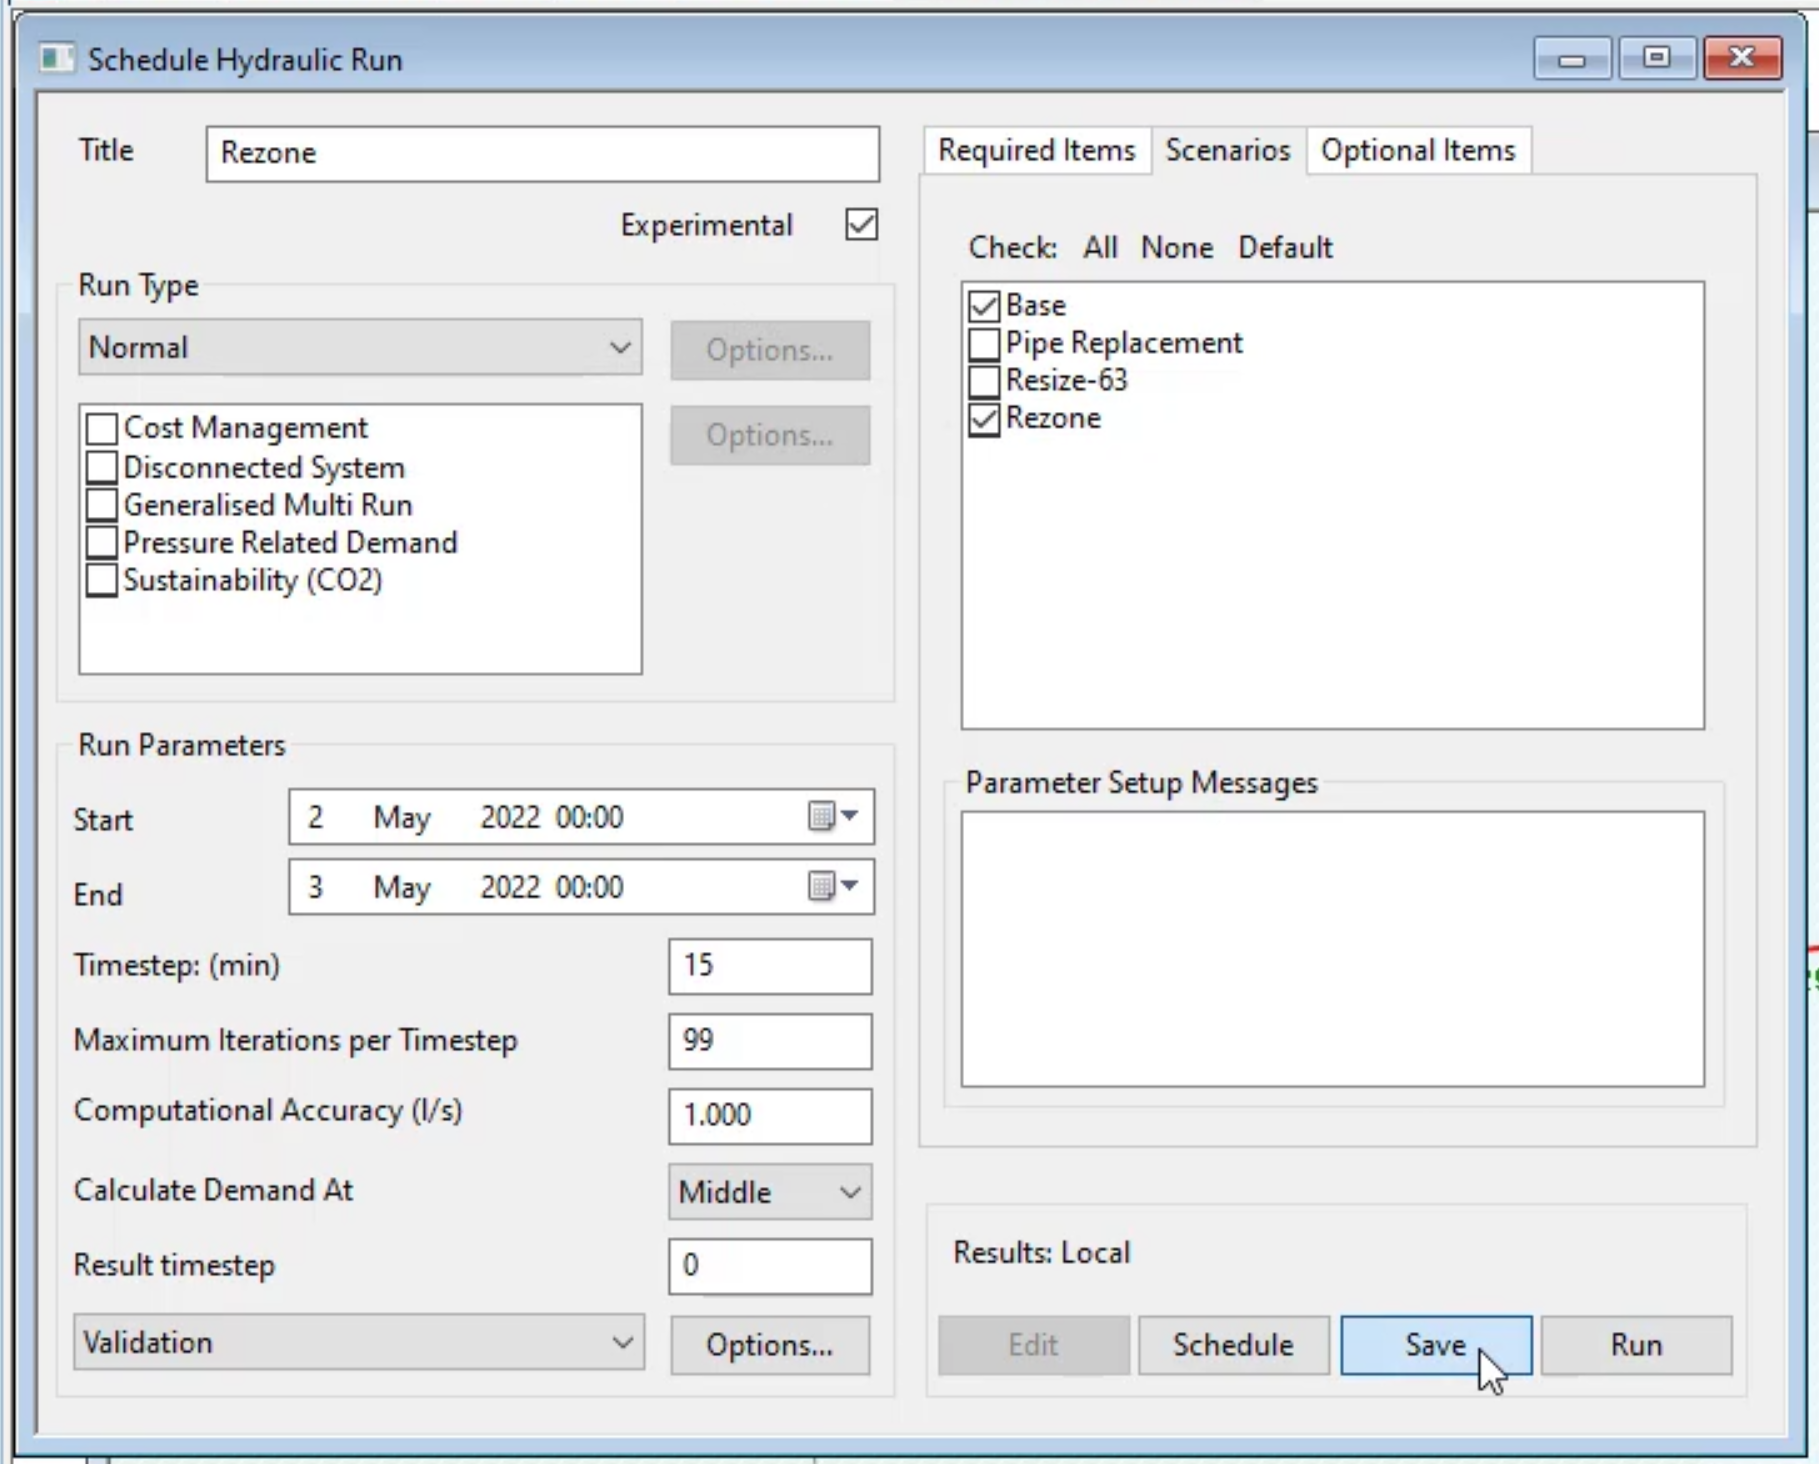
in the scenarios. Tab enable the base and rezone options as well.
01:51
Click save then run,
01:56
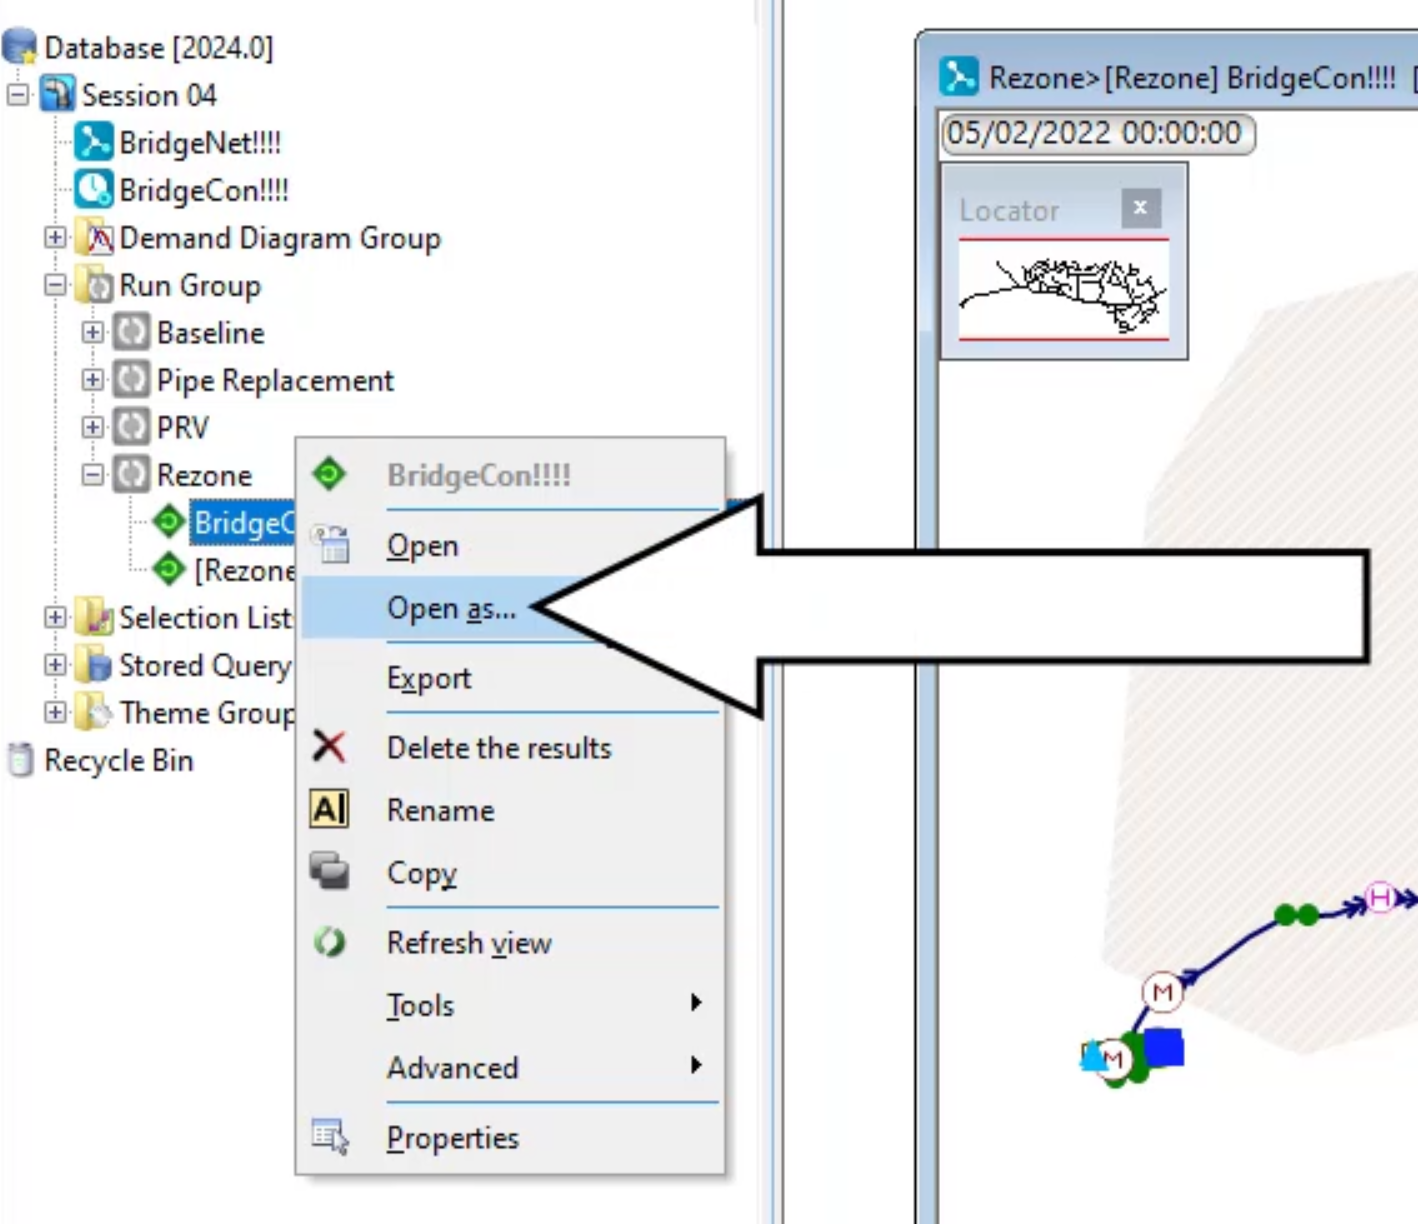
expand the rezone, run and click and drag rezone bridge con into the workspace.
02:04
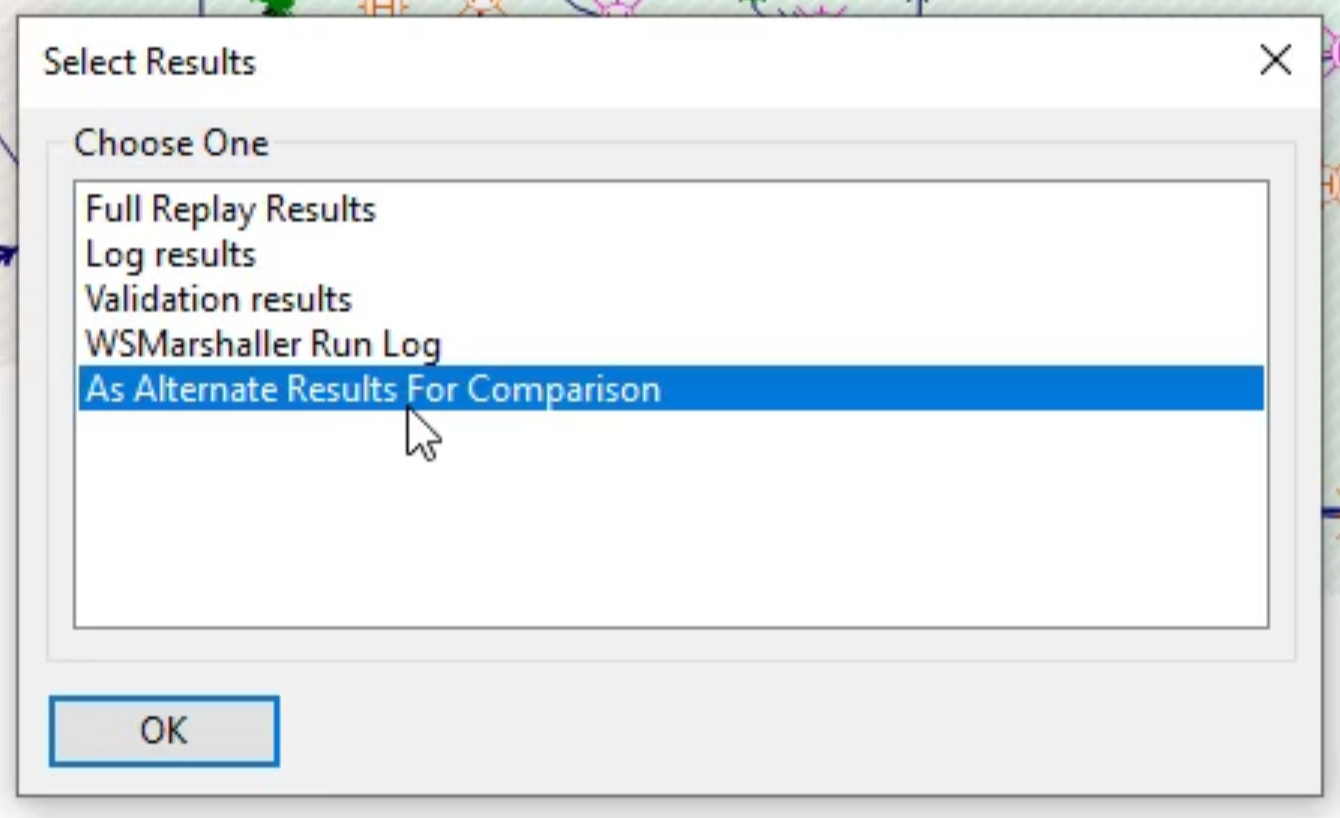
right click bridge con select open as
02:07
and in the select results, dialogue, click as alternate results for comparison,
02:15
Now you can apply a predefined theme to the model,
02:19
expand the theme group and then expand factory
02:24
click and drag the nodal pressure theme into the run and observe how the
02:28
nodes are now color coded to reflect changes in water pressure across the network.
02:34
You can click through the timeline bar at the top
02:36
of the window to see how pressure changes over time
02:40
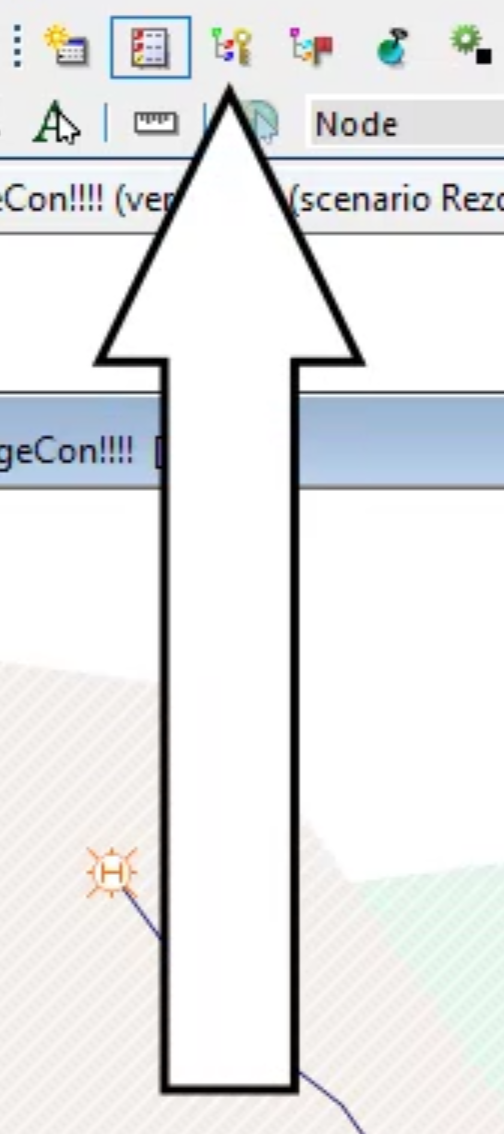
to understand what each color represents
02:43
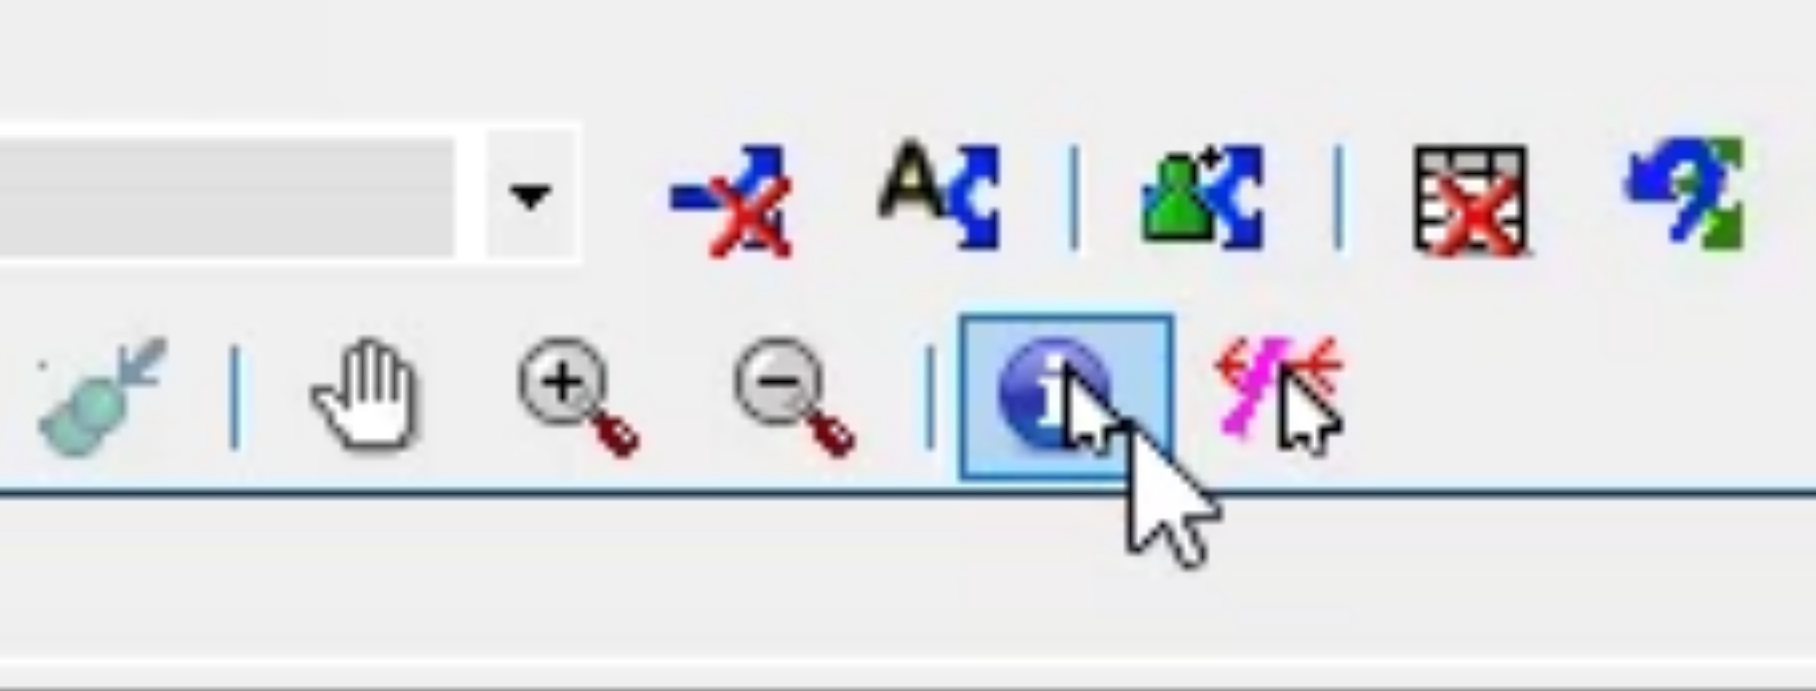
in the toolbar. Click thematic key window
02:48
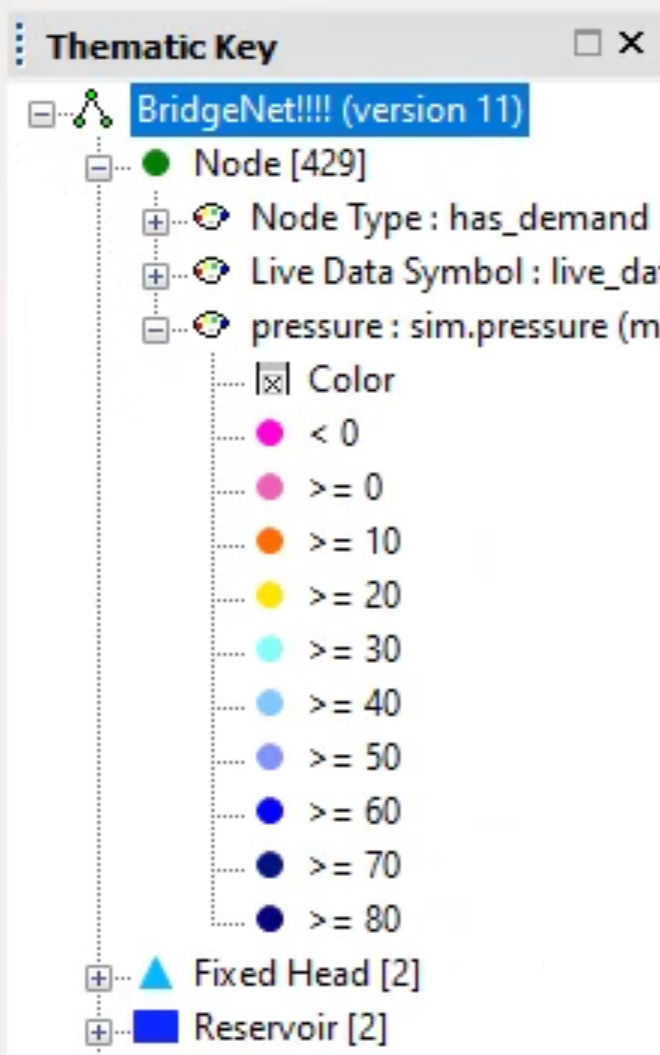
in the thematic key window,
02:49
expand node and then pressure to reveal a series
02:53
of colors each standing for a different pressure level.
02:57
Locate pipe 144, 688 again
03:03
because the pipe is closed, you can see a drop in pressure in the network downstream.
03:08
And because you open the valve pressure downstream of the closed pipe drops,
03:12
but flow is maintained
03:15
to see individual customer pressure. You can apply an SQL
03:20
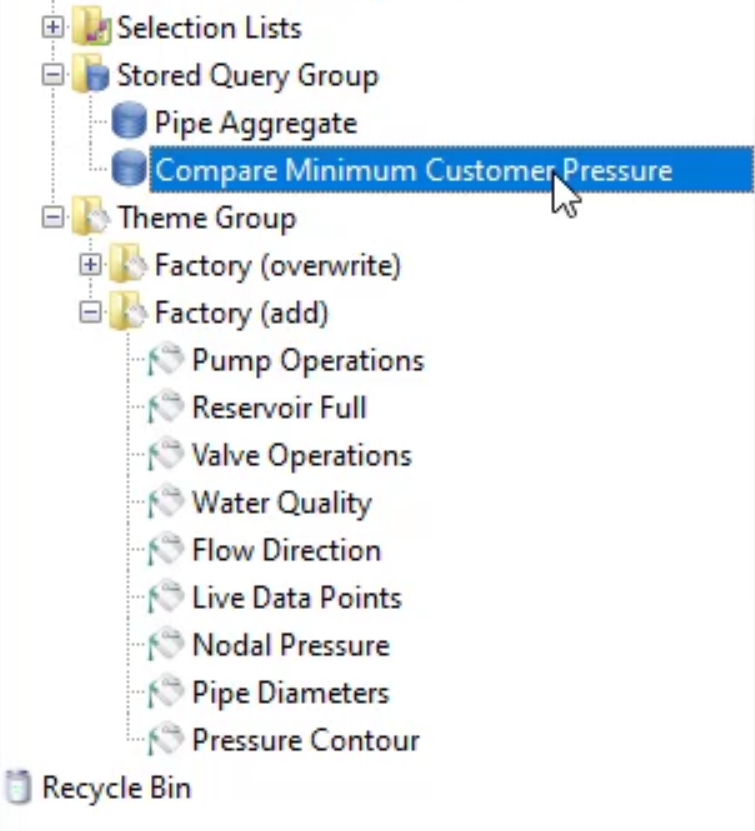
in the model group window, expand the stored query group
03:24
and double click compare minimum customer pressure
03:29
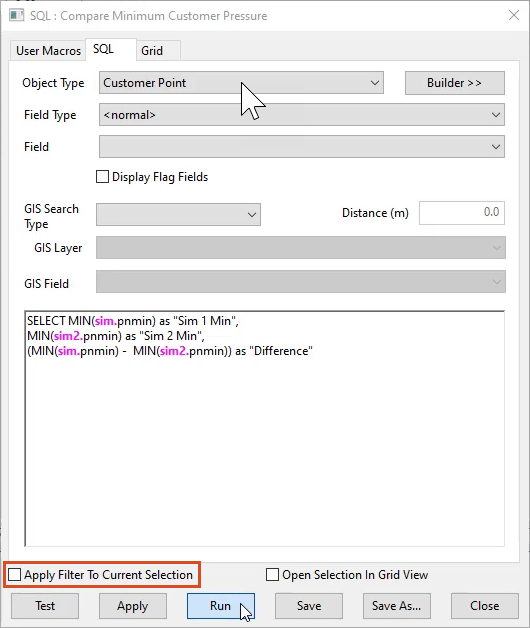
deselect the option, apply filter to current selection
03:33
and then run the SQL
03:37
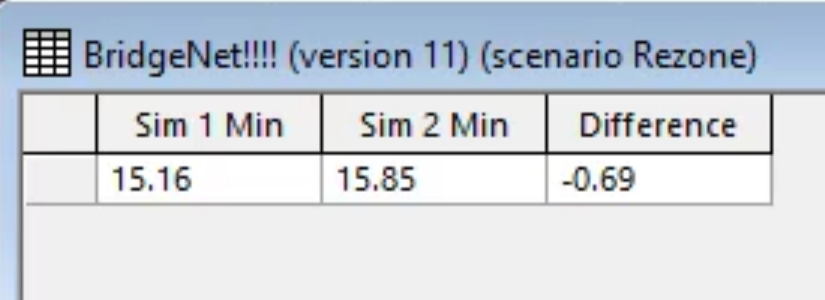
in the results window. The SIM one column represents the rezone run
03:41
and SIM two represents the base run.
03:45
You can see in the difference column, a value of minus 0.69,
03:50
meaning there was only a small drop in pressure.
03:53
This indicates the rezone was at least somewhat successful.
03:59
You can try different SQS if necessary.
04:01
For example, to view notable pressure across the network,
04:05
just remember that if you are running an SQL for a selected group of objects,
04:09
you need to re enable the apply filter to current selection option.