& Construction
Integrated BIM tools, including Revit, AutoCAD, and Civil 3D
& Manufacturing
Professional CAD/CAM tools built on Inventor and AutoCAD
Integrated BIM tools, including Revit, AutoCAD, and Civil 3D
Professional CAD/CAM tools built on Inventor and AutoCAD
Create a pump curve and add a pump to the model.
Type:
Tutorial
Length:
6 min.
Tutorial resources
These downloadable resources will be used to complete this tutorial:
Transcript
00:04
Pumps are widely used in water supply systems. So modeling them in info works W
00:08
S pro is vital.
00:10
A pump operates on a pump curve which governs a pump's operating characteristics.
00:16
In this example, the calculations have already been done for the pump rpm,
00:20
duty head and duty flow required to address
00:23
the pressure deficit in this small network.
00:26
Now you will add a pump curve and pump to the network
00:30
first create a new scenario
00:33
in the toolbar, click create scenario
00:36
and then in the create new scenario. Dialog box name it pump one
00:41
click. OK.
00:44
Now you need to add a pump curve
00:46
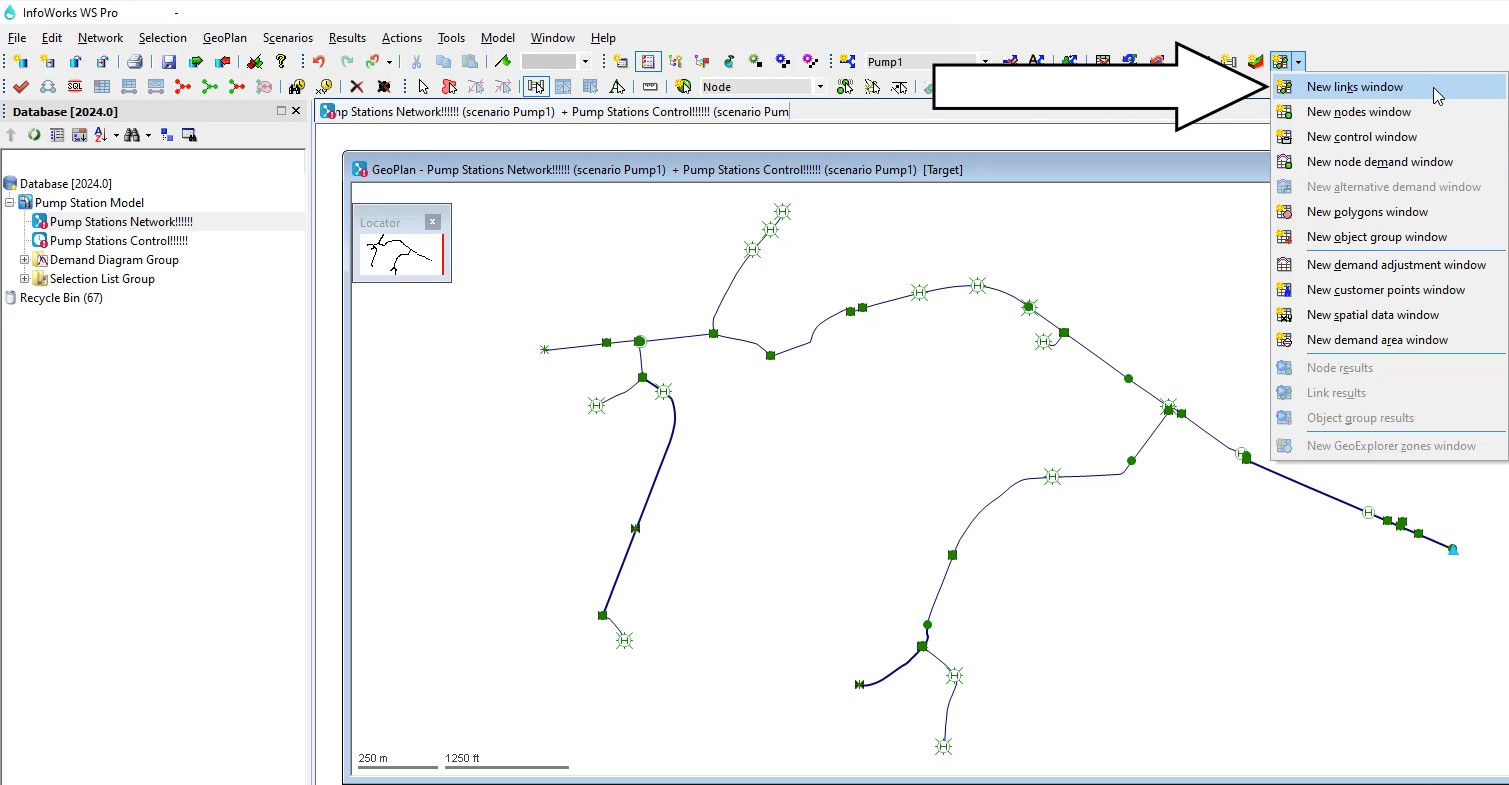
from the toolbar, expand the grid windows drop down and click new links window
00:52
or from the menu, click window and select grid windows. New links window,
00:59
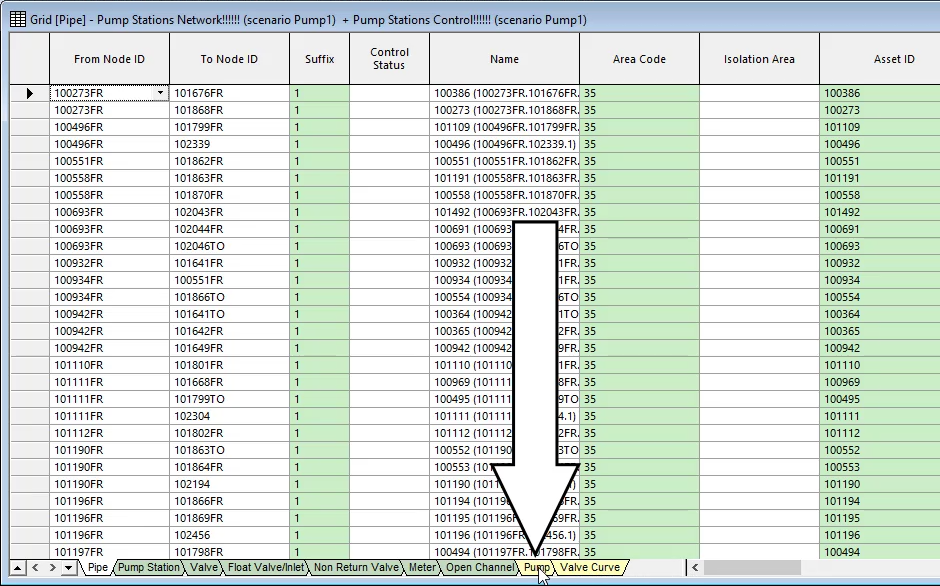
either method opens a grid with tabs along the bottom
01:03
tabs in green, contain network objects and those in yellow are data objects.
01:09
Click the pump tab
01:12
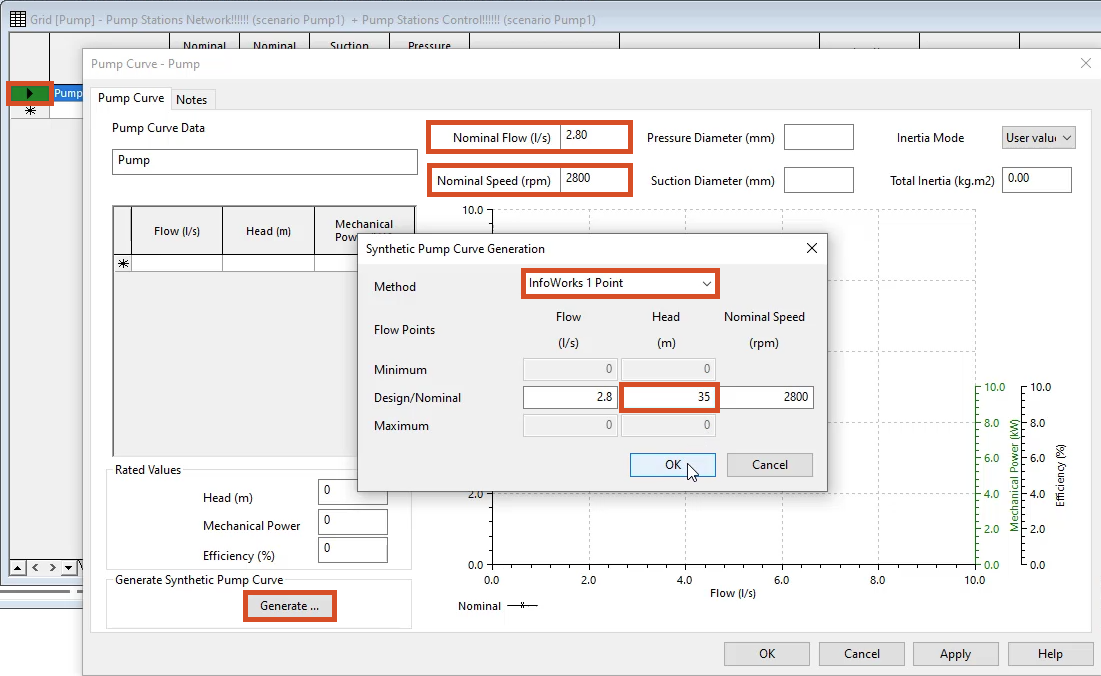
in the first row of the pump id column, enter pump,
01:16
then double click the cell to the left to open the pump curve editor for the new pump.
01:22
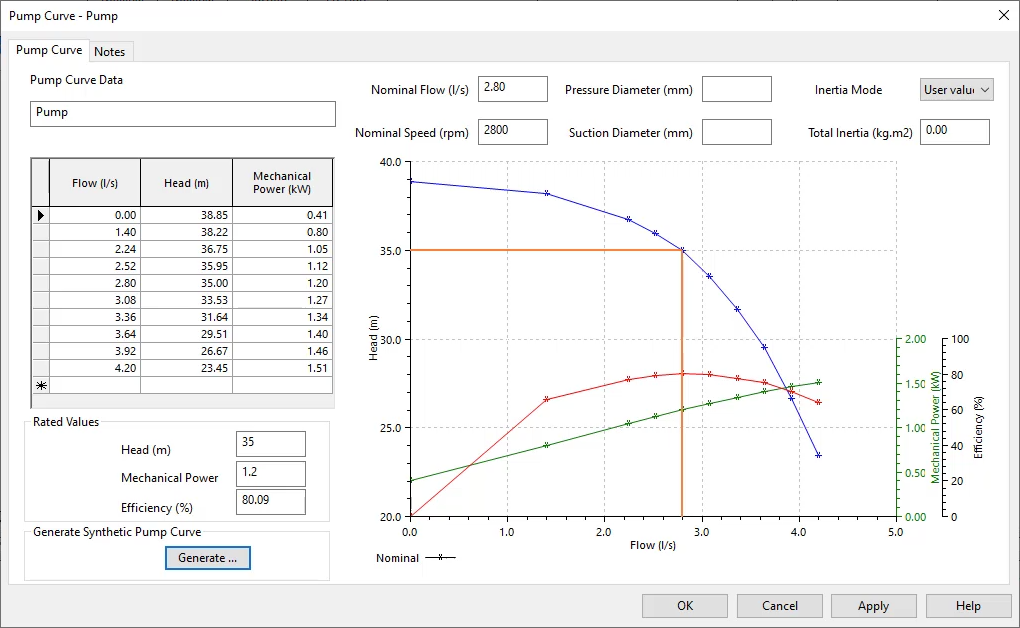
In the pump curve, pump dialog box enter a nominal speed. Value of 2800
01:28
and a nominal flow value of 2.8
01:32
in the generate synthetic pump curve group box. Click the generate button
01:37
in the synthetic pump curve generation dialogue.
01:40
Expand the method drop down and select info
01:43
works one point if it is not already selected
01:47
in the design slash nominal row head column, enter a value of 35
01:53
click. OK.
01:55
The pump curve editor updates to display the generated pump curve
01:60
click ok. To close the dialogue,
02:02
close the grid.
02:05
Next, add the pump station to the model
02:08
in the geo plan zoom in to the right side of the network and double click
02:12
the short pipe with an asset id of
02:20
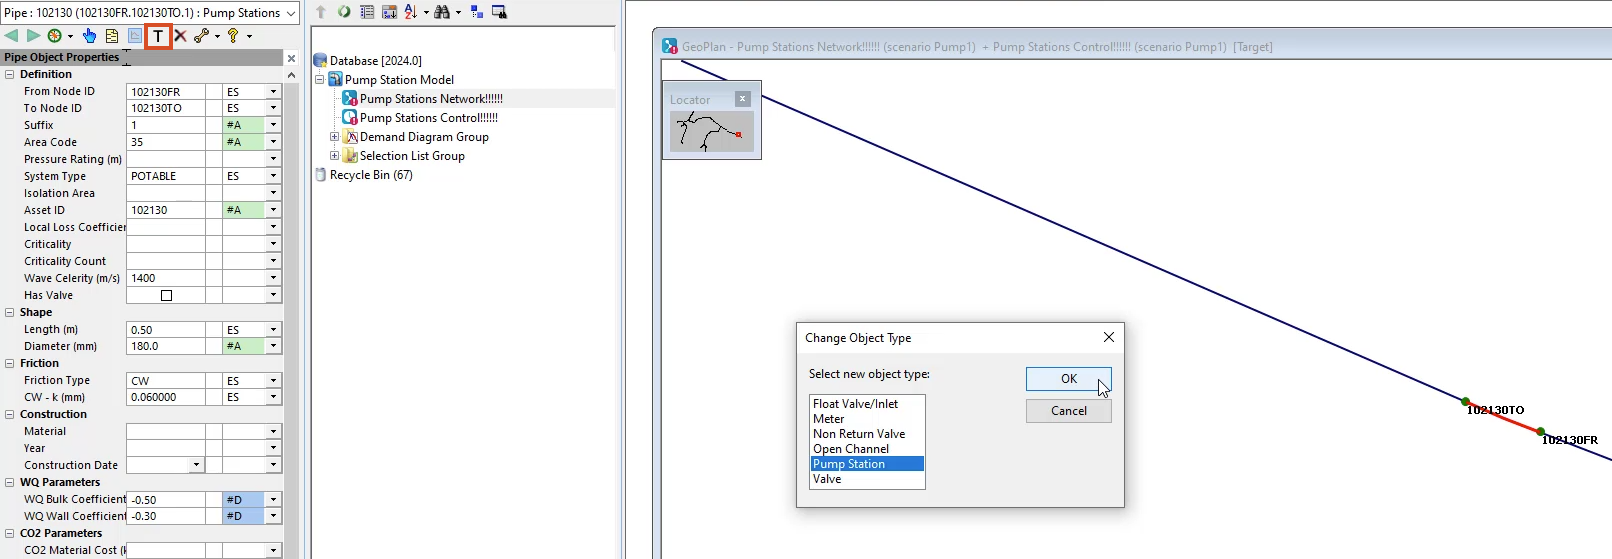
Then in the properties window toolbar, click change type
02:25
in the change object type dialogue select pump station
02:29
and then click. Ok.
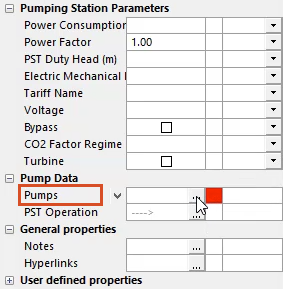
02:32
Notice that a red warning box appears in the pumps row.
02:36
This is because the pump station you just created needs at least one pump
02:41
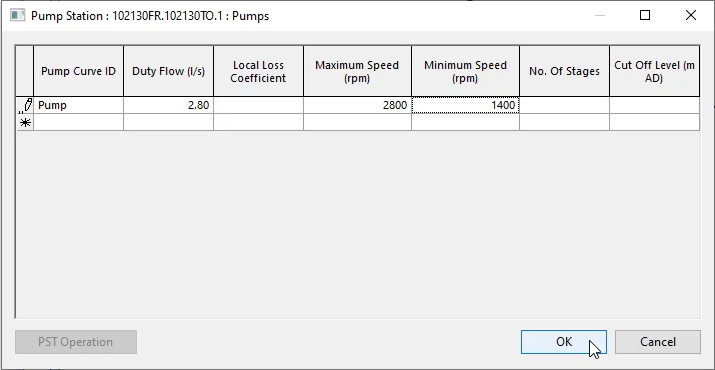
in the same row. Click the ellipsis to open the pump editor
02:46
in the first row of the pump curve id column, expand the dropdown and select pump
02:52
for duty flow. Enter a value of 2.80,
02:57
set the maximum speed to 2800
03:00
the minimum speed to 1400.
03:04
Click. Ok.
03:08
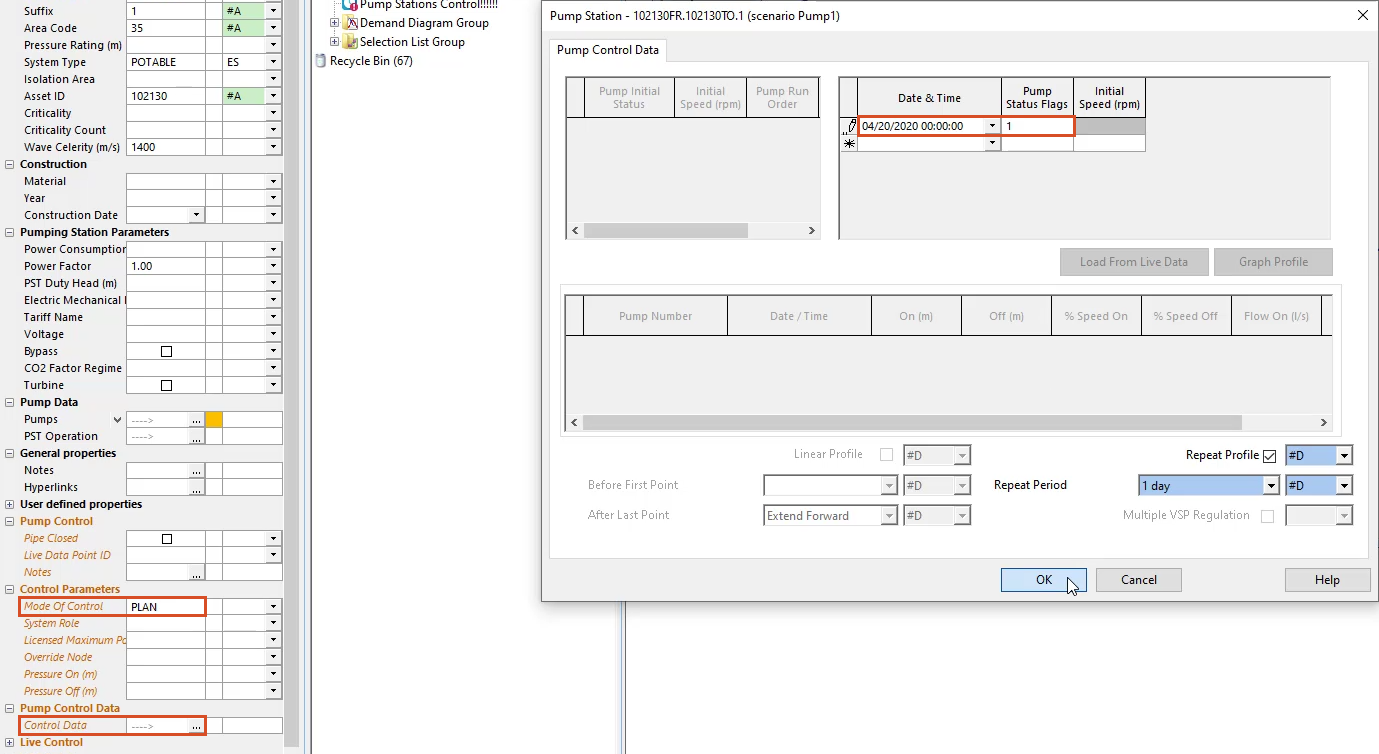
In the properties panel under pump control,
03:10
expand the dropdown next to mode of control and set it to plan units
03:17
under pump control data
03:19
in the control data row.
03:20
Click the ellipsis,
03:24
set the date and time 2 2004 2020 at midnight,
03:30
set pump status flags to one
03:34
click. Ok.
03:37
Before continuing commit your changes.
03:41
Click yes. In the following notifications,
03:46
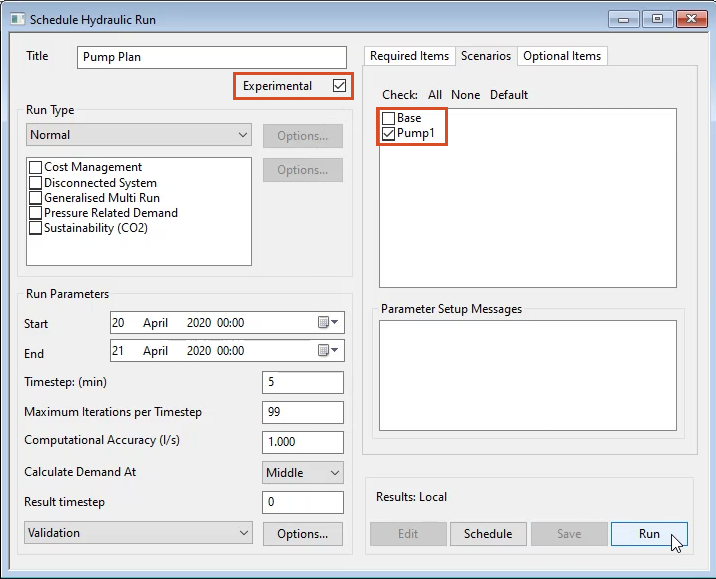
create and name a new run using the same network as before.
03:52
In this example, the run is titled pump plan
03:59
in the scenarios tab make sure only pump one is active
04:04
check the box. Next to experimental
04:08
click run.
04:11
Once the run is complete, open the results
04:14
zoom into the area of the network where you added the pump station
04:20
use the selection list you created earlier
04:23
and then click new long section
04:26
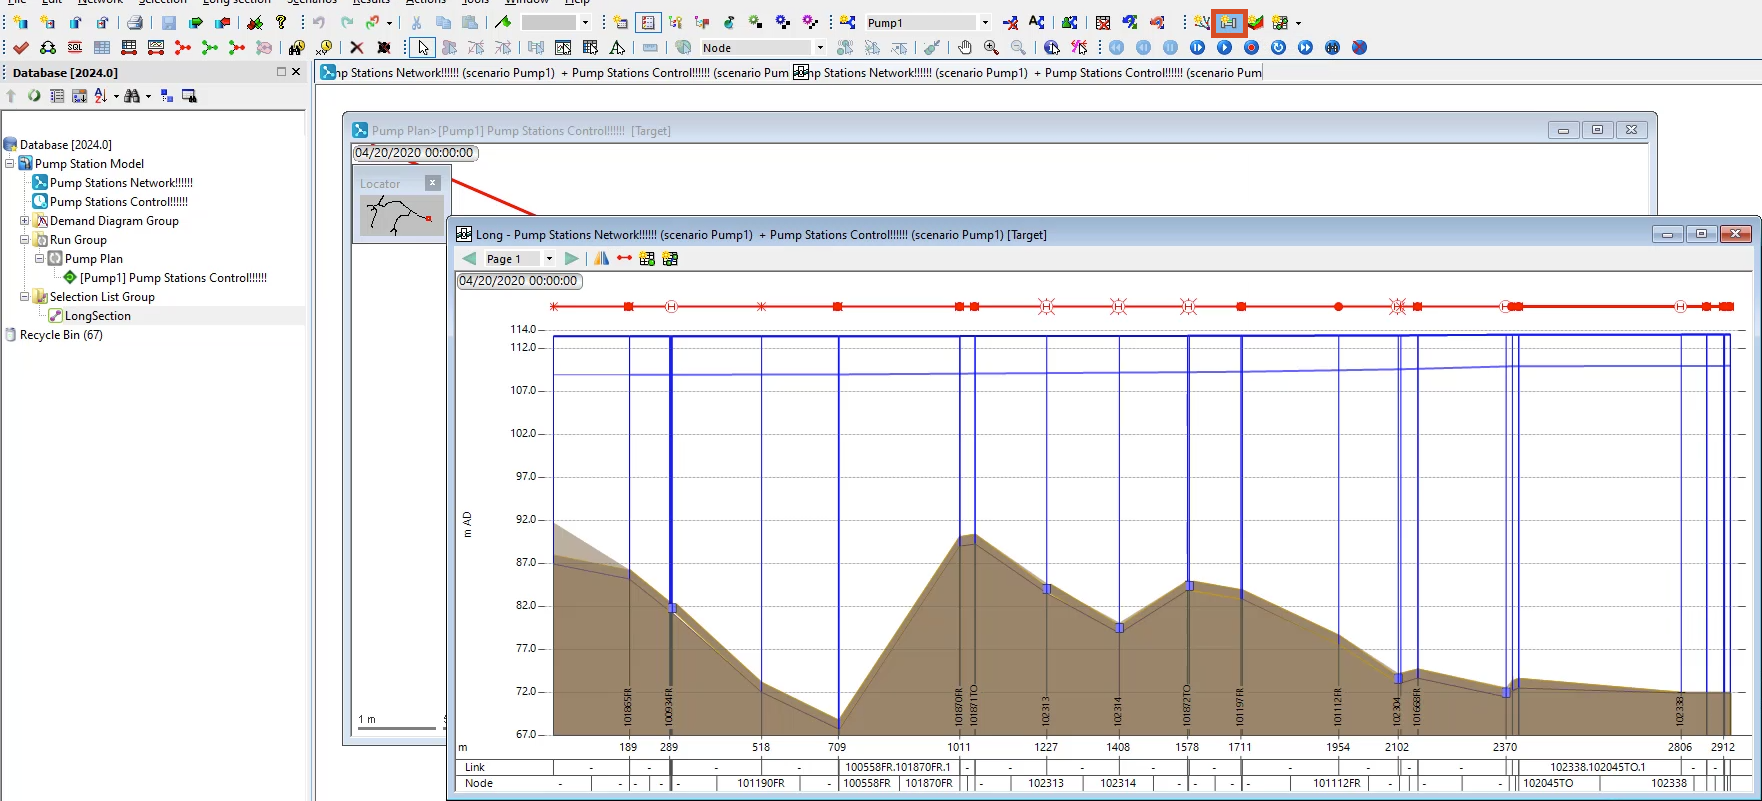
notice in the long section window that adding the pump station
04:29
dramatically raised the hydraulic grade line
04:32
providing more than enough pressure.
Video transcript
00:04
Pumps are widely used in water supply systems. So modeling them in info works W
00:08
S pro is vital.
00:10
A pump operates on a pump curve which governs a pump's operating characteristics.
00:16
In this example, the calculations have already been done for the pump rpm,
00:20
duty head and duty flow required to address
00:23
the pressure deficit in this small network.
00:26
Now you will add a pump curve and pump to the network
00:30
first create a new scenario
00:33
in the toolbar, click create scenario
00:36
and then in the create new scenario. Dialog box name it pump one
00:41
click. OK.
00:44
Now you need to add a pump curve
00:46
from the toolbar, expand the grid windows drop down and click new links window
00:52
or from the menu, click window and select grid windows. New links window,
00:59
either method opens a grid with tabs along the bottom
01:03
tabs in green, contain network objects and those in yellow are data objects.
01:09
Click the pump tab
01:12
in the first row of the pump id column, enter pump,
01:16
then double click the cell to the left to open the pump curve editor for the new pump.
01:22
In the pump curve, pump dialog box enter a nominal speed. Value of 2800
01:28
and a nominal flow value of 2.8
01:32
in the generate synthetic pump curve group box. Click the generate button
01:37
in the synthetic pump curve generation dialogue.
01:40
Expand the method drop down and select info
01:43
works one point if it is not already selected
01:47
in the design slash nominal row head column, enter a value of 35
01:53
click. OK.
01:55
The pump curve editor updates to display the generated pump curve
01:60
click ok. To close the dialogue,
02:02
close the grid.
02:05
Next, add the pump station to the model
02:08
in the geo plan zoom in to the right side of the network and double click
02:12
the short pipe with an asset id of
02:20
Then in the properties window toolbar, click change type
02:25
in the change object type dialogue select pump station
02:29
and then click. Ok.
02:32
Notice that a red warning box appears in the pumps row.
02:36
This is because the pump station you just created needs at least one pump
02:41
in the same row. Click the ellipsis to open the pump editor
02:46
in the first row of the pump curve id column, expand the dropdown and select pump
02:52
for duty flow. Enter a value of 2.80,
02:57
set the maximum speed to 2800
03:00
the minimum speed to 1400.
03:04
Click. Ok.
03:08
In the properties panel under pump control,
03:10
expand the dropdown next to mode of control and set it to plan units
03:17
under pump control data
03:19
in the control data row.
03:20
Click the ellipsis,
03:24
set the date and time 2 2004 2020 at midnight,
03:30
set pump status flags to one
03:34
click. Ok.
03:37
Before continuing commit your changes.
03:41
Click yes. In the following notifications,
03:46
create and name a new run using the same network as before.
03:52
In this example, the run is titled pump plan
03:59
in the scenarios tab make sure only pump one is active
04:04
check the box. Next to experimental
04:08
click run.
04:11
Once the run is complete, open the results
04:14
zoom into the area of the network where you added the pump station
04:20
use the selection list you created earlier
04:23
and then click new long section
04:26
notice in the long section window that adding the pump station
04:29
dramatically raised the hydraulic grade line
04:32
providing more than enough pressure.
Pumps are widely used in water supply systems, so modelling them in InfoWorks WS Pro is vital. A Pump operates on a pump curve, which governs a pump’s operating characteristics.
In this example, there is a pressure deficit in a small network. Calculations are done for the pump RPM, duty head, and duty flow required to address the issue. The next step is to add a pump curve and a pump to the network.
First, create a new scenario:
Next, add a pump curve:
A grid opens with tabs along the bottom. Green tabs contain network objects and yellow tabs indicate data objects.
The Pump Curve page updates to display the generated pump curve.
Next, add the pump station to the model:
A red warning box appears in the Pumps row, because the created pump station needs at least one pump.
Next, create a new run using the same network:
To view the results:
Notice in the long section window that adding the pump station dramatically raised the hydraulic grade line, providing more than enough pressure.
How to buy
Privacy | Do not sell or share my personal information | Cookie preferences | Report noncompliance | Terms of use | Legal | © 2025 Autodesk Inc. All rights reserved
Sign in for the best experience
Save your progress
Get access to courses
Receive personalized recommendations
May we collect and use your data?
Learn more about the Third Party Services we use and our Privacy Statement.May we collect and use your data to tailor your experience?
Explore the benefits of a customized experience by managing your privacy settings for this site or visit our Privacy Statement to learn more about your options.