00:05
WS pro demand area analysis provides the demand
00:08
profile input that is necessary for simulation runs
00:12
before carrying out a demand area analysis. However, several steps must be taken.
00:18
These steps include allocating all known demand to the network,
00:21
assigning any direct demand for large metered customers
00:25
and creating a template demand diagram that includes
00:28
demand categories for all unp profiled and leakage demand
00:34
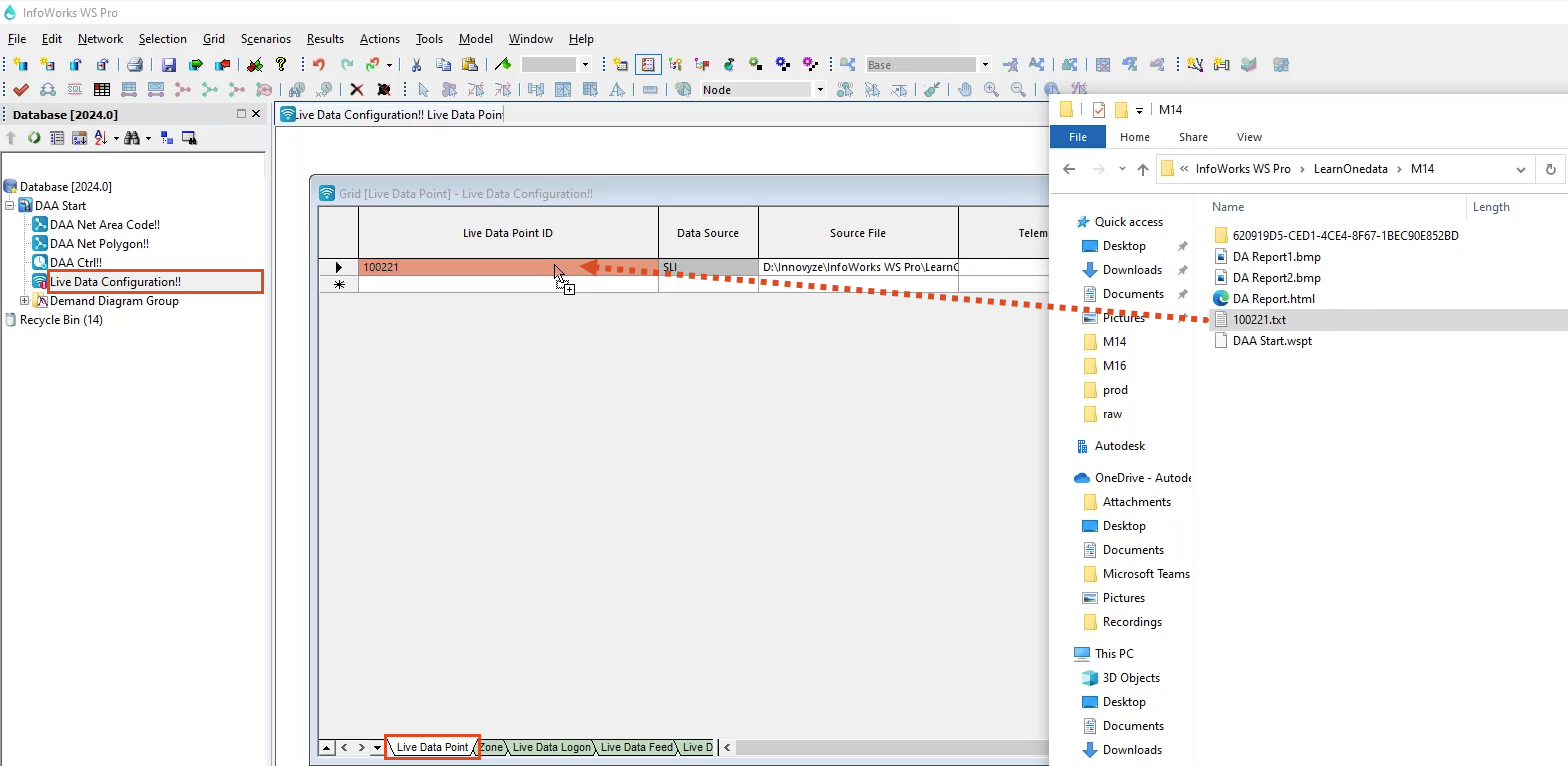
allocate demand to the network using data configuration from the database,
00:38
expand DAAs start and then open live data configuration.
00:43
Then open your file browser and navigate to the demand area analysis folder.
00:48
Select the text file named 100221 dot TXT.
00:54
Then drag and drop it into the first cell in the live
00:57
data point tab in the live data configuration within the program.
01:01
To perform a demand area analysis.
01:03
You must have the demand diagram,
01:05
the network and control and live data configuration open in the background.
01:10
Open the demand diagram
01:12
finally open and bring the DAA net area code and D control GEO plan to the front
01:18
with these requirements fulfilled.
01:20
You are now ready to perform a demand area analysis
01:24
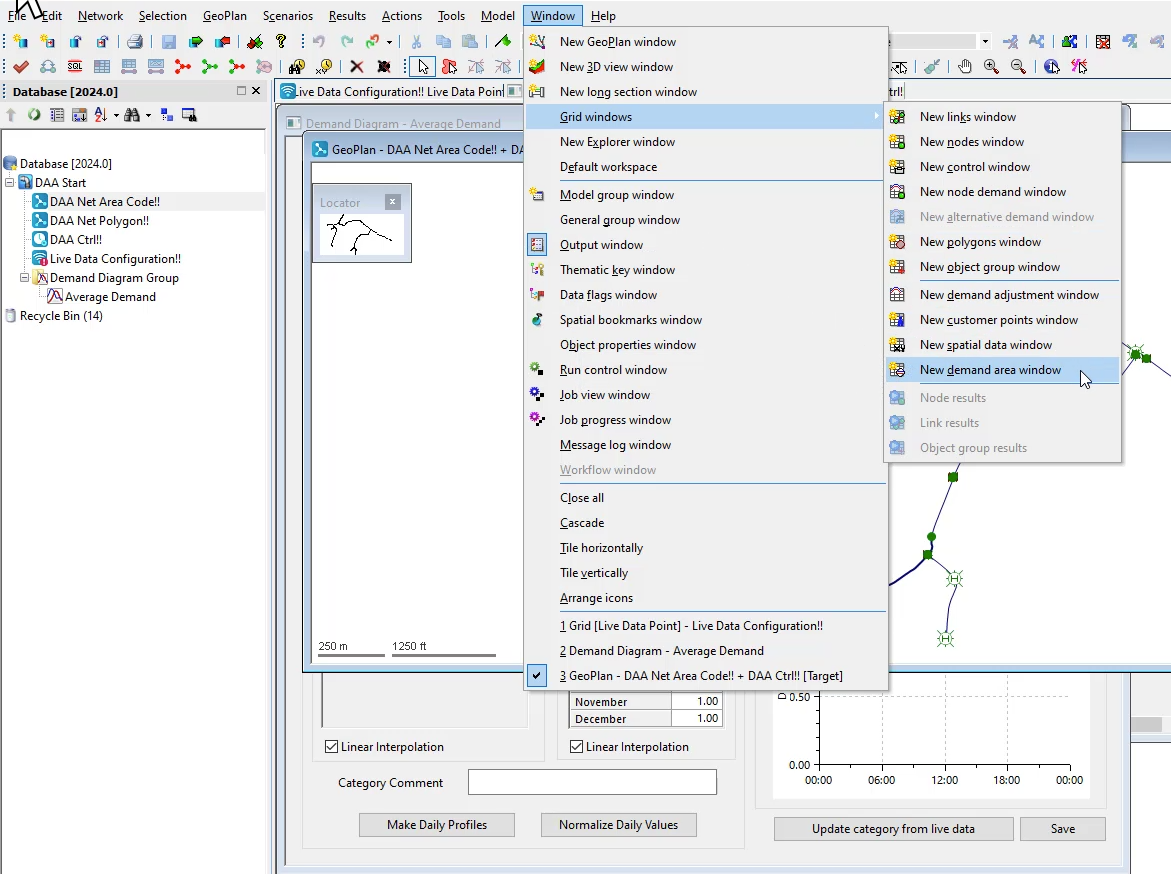
to begin from the toolbar select window
01:27
grid windows, new demand area window.
01:33
The grid demand area window displays
01:37
the demand area grid view is used for viewing editing and analyzing demand areas.
01:42
Currently, the grid is empty
01:44
in the demand area id column,
01:46
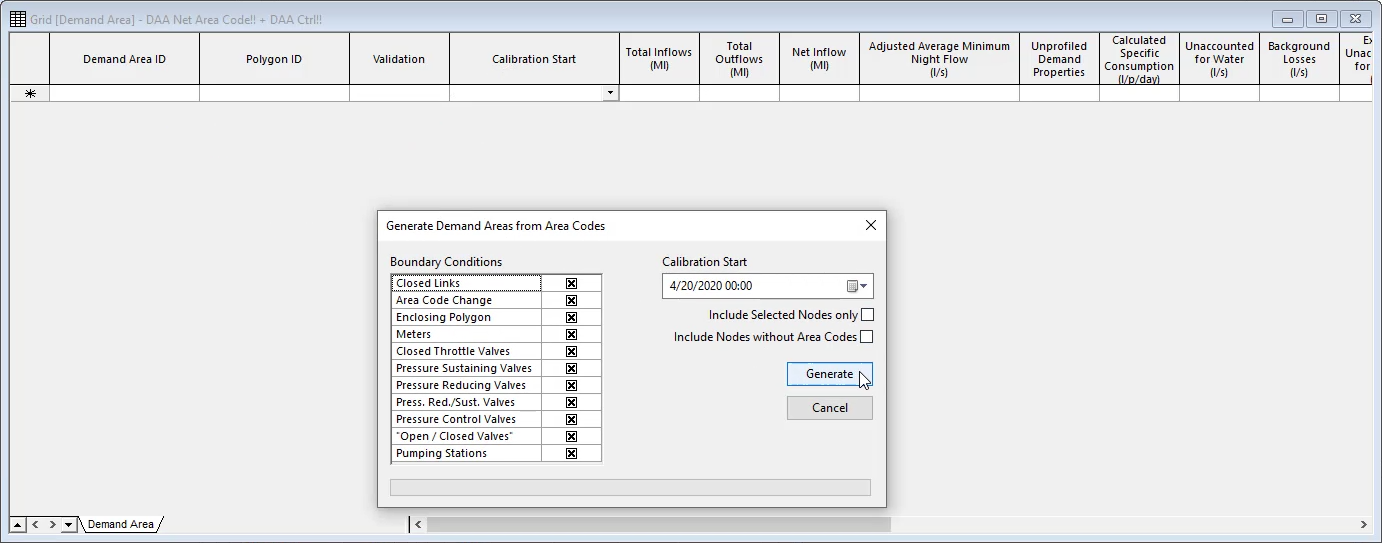
right click and from the shortcut menu
01:49
select generate demand areas from area codes.
01:52
From here, you can configure boundary conditions
01:55
for now. Leave it as is and then click generate
01:59
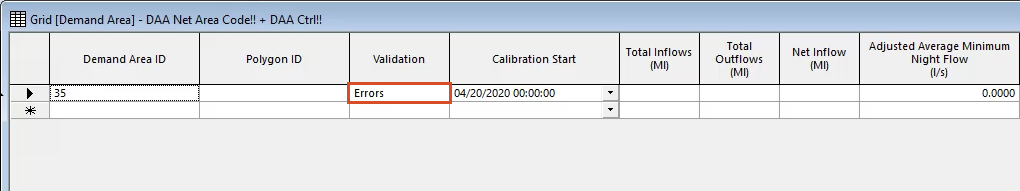
the demand area grid will then automatically populate
02:03
from the validation column. You can see that there are some errors
02:07
to remedy the errors. You can make changes within the grid.
02:11
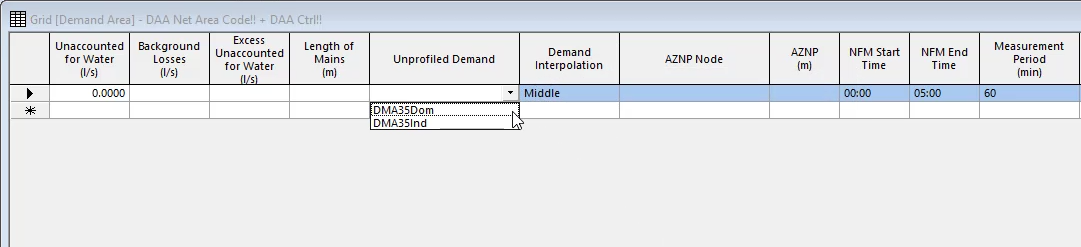
Navigate to the unp profiled demand column.
02:13
This is where you specify the demand profile
02:16
for the demand area analysis process to update,
02:19
expand the unp profiled demand dropdown and select DMA 35 dom
02:27
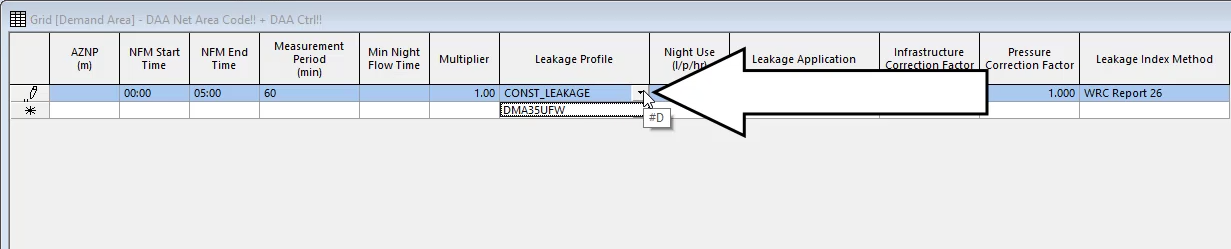
navigate to the leakage profile column and notice that
02:30
each demand area is assigned a constant leakage,
02:34
expand the leakage profile dropdown and select DMA 35 UFW for area 35
02:41
the specified profiles are existing leakage profiles generally determined
02:46
from minimum nightly flows within the demand diagram.
02:50
expand the leakage application dropdown and set
02:53
the demand area to unp profiled demand
02:56
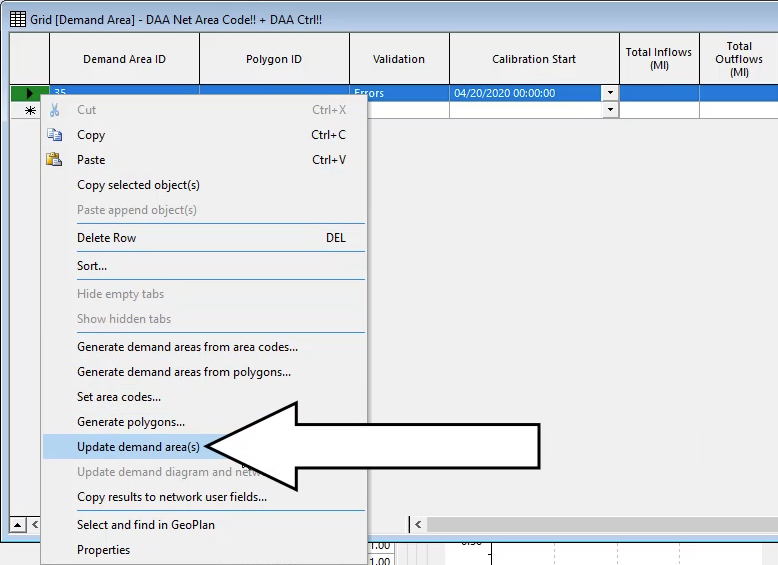
with the leakage profiles and applications updated.
02:59
Navigate back to the demand area id column and select each row from the table margin.
03:04
Then right click and select update demand areas.
03:09
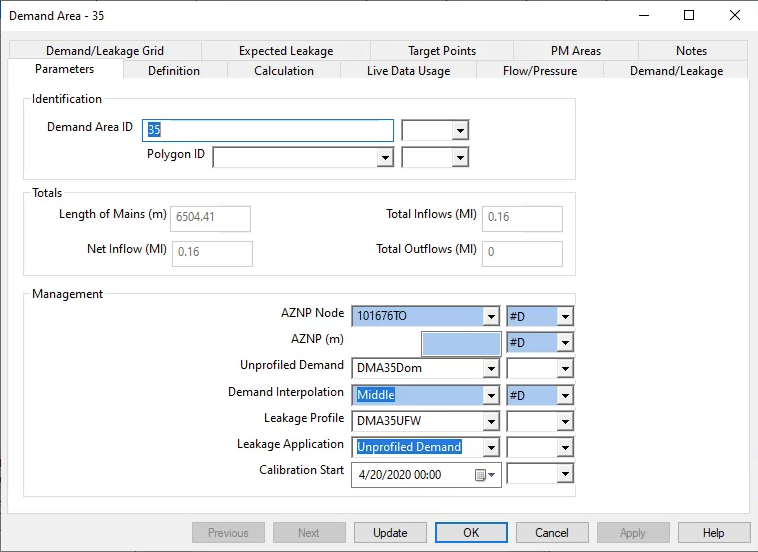
More detailed information on each demand area can be viewed via the grid view,
03:14
right, click demand area 35 and select properties,
03:18
the properties dialogue for the specific demand area displays.