& Construction

Integrated BIM tools, including Revit, AutoCAD, and Civil 3D
& Manufacturing

Professional CAD/CAM tools built on Inventor and AutoCAD

Integrated BIM tools, including Revit, AutoCAD, and Civil 3D

Professional CAD/CAM tools built on Inventor and AutoCAD
Create new demand categories using direct, manual data links.
Type:
Tutorial
Length:
5 min.
Tutorial resources
These downloadable resources will be used to complete this tutorial:
Transcript
00:04
Categorizing demand and info works W S pro allows you to easily
00:08
visualize different demand profiles which can
00:11
be crucial for planning new developments.
00:14
In this example,
00:15
you will create a new demand category representing
00:18
a school within a planned housing development.
00:21
Before starting be sure to copy session five dot wpt into your database.
00:26
Open the bridge net GEO plan and work
00:28
within a new scenario named housing development.
00:32
This new scenario will need a node
00:34
with allocated demand linked to the existing network
00:38
from the model group window under demand diagram group select
00:42
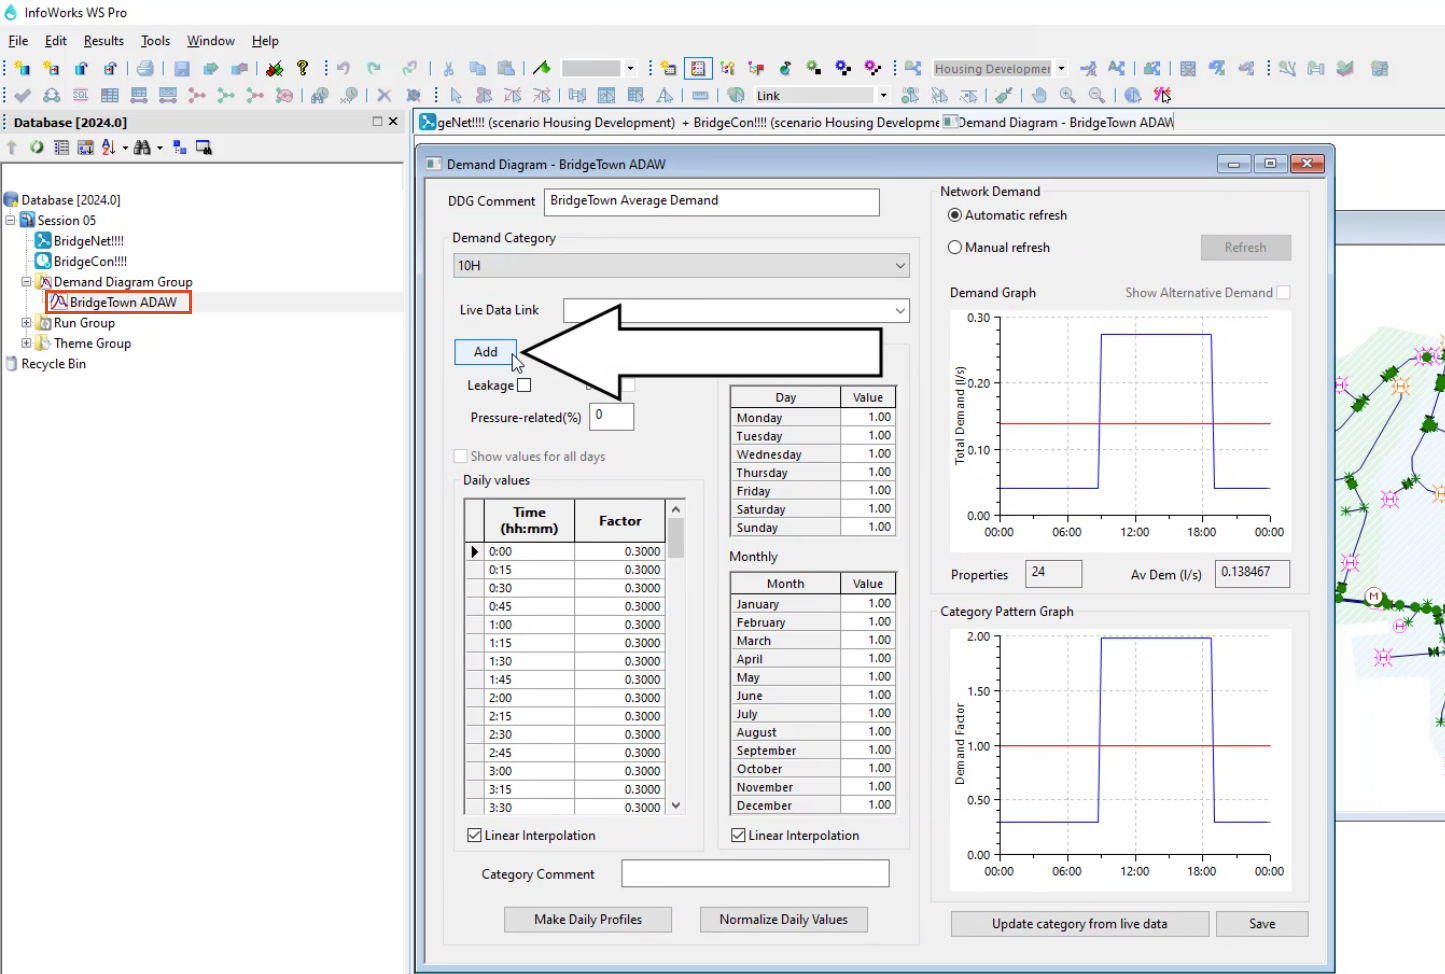
Bridgetown ad A W to open the demand diagram.
00:48
Click add
00:51
this displays the new demand category dialogue
00:55
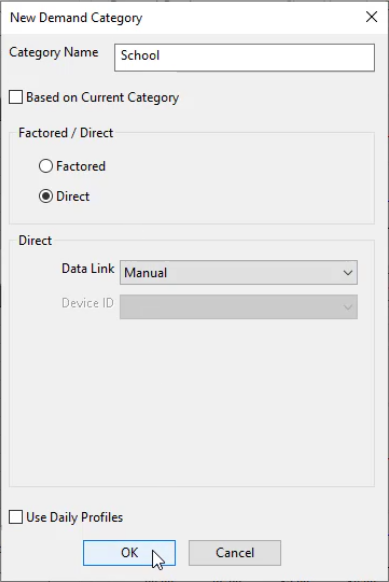
from here in the category name field.
00:58
Enter a descriptive name for the new category such as school
01:02
to use demand data from a live data
01:05
source from the factored direct section select direct
01:10
ensure the data link is set to manual which allows the
01:13
category data in the demand diagram editor to be entered manually.
01:19
Click. OK.
01:21
The demand diagram opens again with the demand category set to
01:25
the newly created category which in this case is named school.
01:30
Now you can manually enter the data for the new demand category
01:34
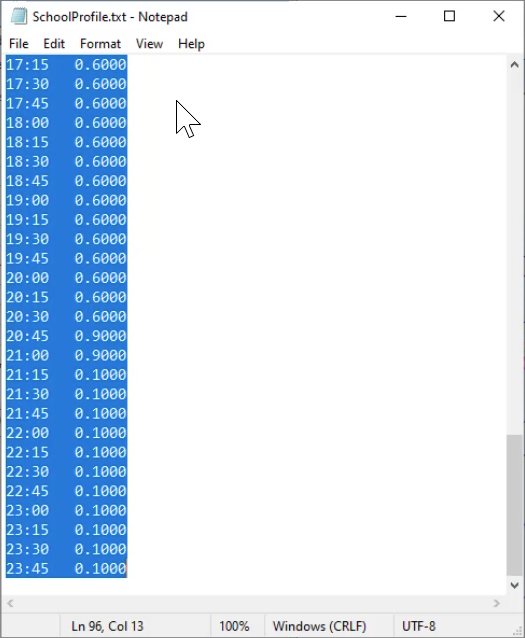
from your devices, file explorer, open the school profile text document.
01:40
The data in this document represents a demand pattern for a 24 hour period
01:46
from the document, select all the data and copy it.
01:50
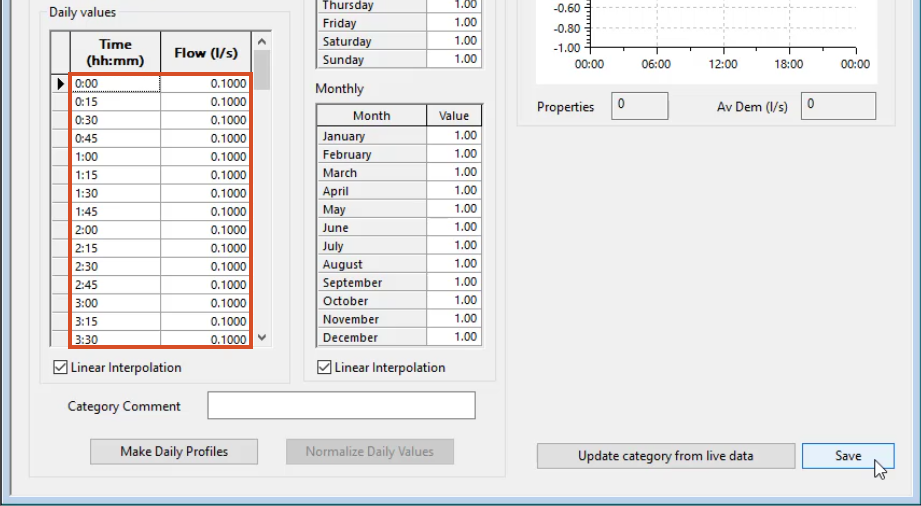
Then back in info works ws pro demand diagram under daily values,
01:56
select the top left cell and paste the data
02:00
with the data pasted into the diagram. Click save.
02:05
You can now use this new demand category.
02:08
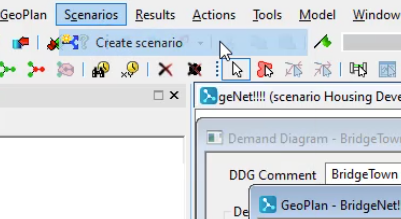
Return to the GEO plan and create a new scenario
02:13
from the toolbar select scenario,
02:15
create scenario
02:18
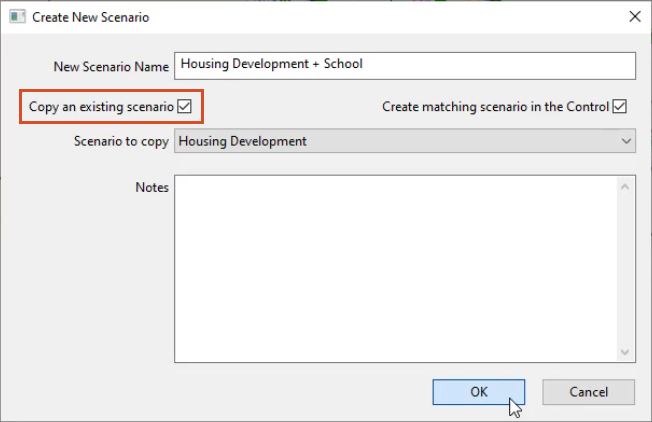
in the create new scenario, dialogue name this scenario,
02:22
housing development plus school and select copy an existing scenario
02:28
from the scenario to copy drop down. Ensure housing development is selected
02:34
click OK.
02:37
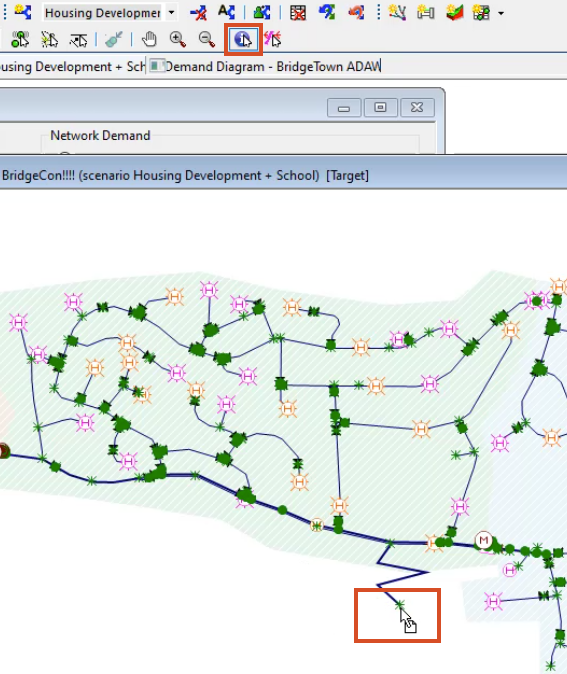
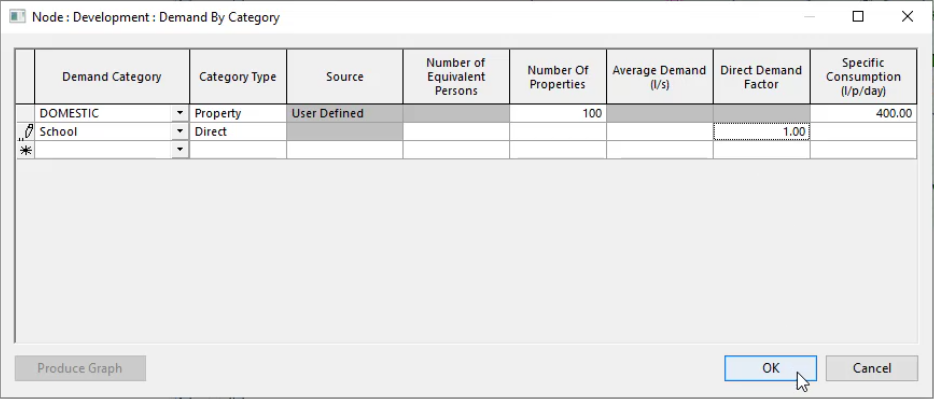
Now in the toolbar select properties and then in the
02:41
GEO plan select the node that represents the planned development
02:46
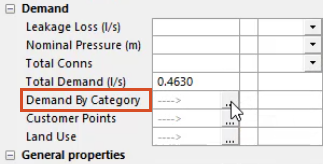
from the development nodes properties window under demand,
02:50
select the demand by category ellipsis button,
02:54
the demand by category dialogue displays
02:58
in the second row, expand the demand category drop down and select school
03:05
set category type two direct
03:09
in the direct demand factor cell enter one
03:12
so that it is not given a multiplier
03:16
click. OK.
03:18
Commit the changes to both the bridge net network and the bridge con control.
03:24
Now that there are three scenarios in this model,
03:27
you can create a new run to simulate all three of them
03:32
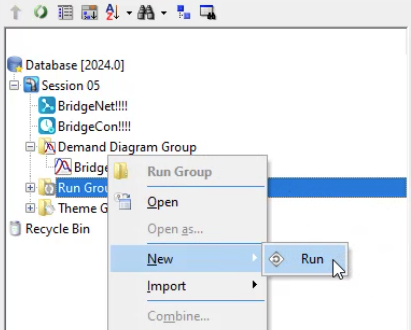
from the model group window, right, click run group and select new
03:36
run
03:41
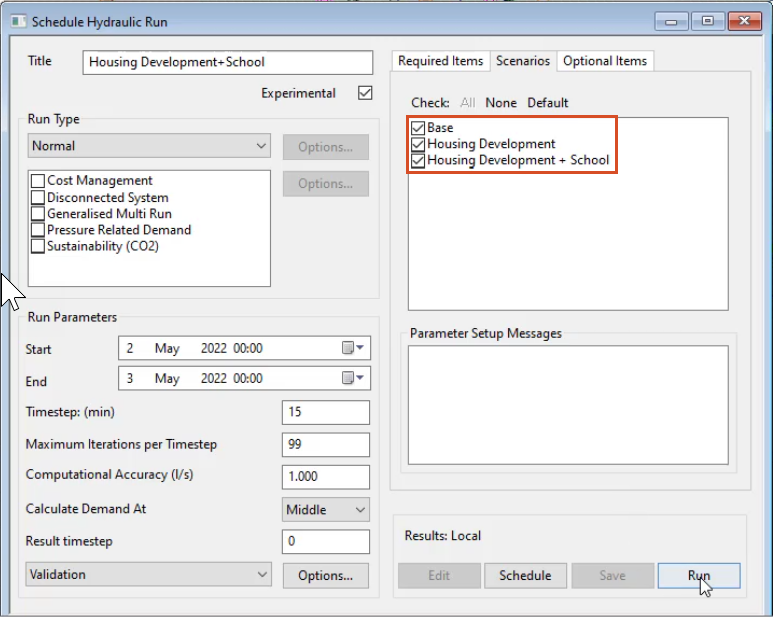
in the schedule. Hydraulic run dialogue
03:43
name the run housing development plus school and set two experimental
03:50
drag the bridge net network into the network section.
03:54
And from the scenarios tab select all three scenarios and then click run
04:02
in the warning dialogue, click yes to continue.
04:06
Once the run is processed, it displays in the model group window.
04:12
You may need to expand the link tree in order to navigate to it.
04:17
You can now open the base scenario simulation
04:20
and then open the other two simulations.
04:22
As alternate results. For comparison
04:28
to compare results,
04:29
you could use the graph command to select the development node to
04:32
visualize the differences in flow or pressure for the three scenarios.
Video transcript
00:04
Categorizing demand and info works W S pro allows you to easily
00:08
visualize different demand profiles which can
00:11
be crucial for planning new developments.
00:14
In this example,
00:15
you will create a new demand category representing
00:18
a school within a planned housing development.
00:21
Before starting be sure to copy session five dot wpt into your database.
00:26
Open the bridge net GEO plan and work
00:28
within a new scenario named housing development.
00:32
This new scenario will need a node
00:34
with allocated demand linked to the existing network
00:38
from the model group window under demand diagram group select
00:42
Bridgetown ad A W to open the demand diagram.
00:48
Click add
00:51
this displays the new demand category dialogue
00:55
from here in the category name field.
00:58
Enter a descriptive name for the new category such as school
01:02
to use demand data from a live data
01:05
source from the factored direct section select direct
01:10
ensure the data link is set to manual which allows the
01:13
category data in the demand diagram editor to be entered manually.
01:19
Click. OK.
01:21
The demand diagram opens again with the demand category set to
01:25
the newly created category which in this case is named school.
01:30
Now you can manually enter the data for the new demand category
01:34
from your devices, file explorer, open the school profile text document.
01:40
The data in this document represents a demand pattern for a 24 hour period
01:46
from the document, select all the data and copy it.
01:50
Then back in info works ws pro demand diagram under daily values,
01:56
select the top left cell and paste the data
02:00
with the data pasted into the diagram. Click save.
02:05
You can now use this new demand category.
02:08
Return to the GEO plan and create a new scenario
02:13
from the toolbar select scenario,
02:15
create scenario
02:18
in the create new scenario, dialogue name this scenario,
02:22
housing development plus school and select copy an existing scenario
02:28
from the scenario to copy drop down. Ensure housing development is selected
02:34
click OK.
02:37
Now in the toolbar select properties and then in the
02:41
GEO plan select the node that represents the planned development
02:46
from the development nodes properties window under demand,
02:50
select the demand by category ellipsis button,
02:54
the demand by category dialogue displays
02:58
in the second row, expand the demand category drop down and select school
03:05
set category type two direct
03:09
in the direct demand factor cell enter one
03:12
so that it is not given a multiplier
03:16
click. OK.
03:18
Commit the changes to both the bridge net network and the bridge con control.
03:24
Now that there are three scenarios in this model,
03:27
you can create a new run to simulate all three of them
03:32
from the model group window, right, click run group and select new
03:36
run
03:41
in the schedule. Hydraulic run dialogue
03:43
name the run housing development plus school and set two experimental
03:50
drag the bridge net network into the network section.
03:54
And from the scenarios tab select all three scenarios and then click run
04:02
in the warning dialogue, click yes to continue.
04:06
Once the run is processed, it displays in the model group window.
04:12
You may need to expand the link tree in order to navigate to it.
04:17
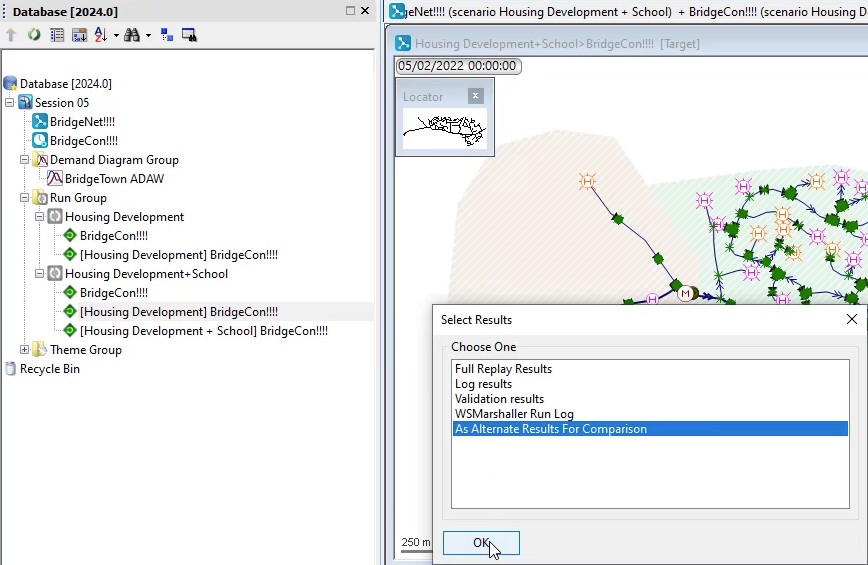
You can now open the base scenario simulation
04:20
and then open the other two simulations.
04:22
As alternate results. For comparison
04:28
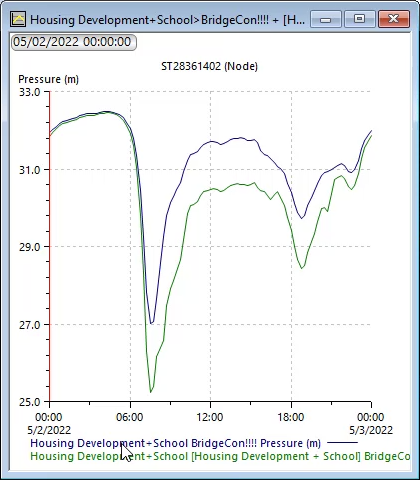
to compare results,
04:29
you could use the graph command to select the development node to
04:32
visualize the differences in flow or pressure for the three scenarios.
Categorizing demand in InfoWorks WS Pro allows you to easily visualize different demand profiles, which can be crucial for planning new developments. In this example, you will create a new demand category representing a school within a planned housing development.
To create a new demand category:
Note: This setting allows you to enter category data in the Demand Diagram editor manually.
The Demand Diagram opens again with the Demand Category set to the newly created category, School.

To manually enter the data for the new demand category:
Note: The data in this document represents a demand pattern for a 24-hour period.
To use the new demand category:
To create a new run to simulate all three scenarios in the model:
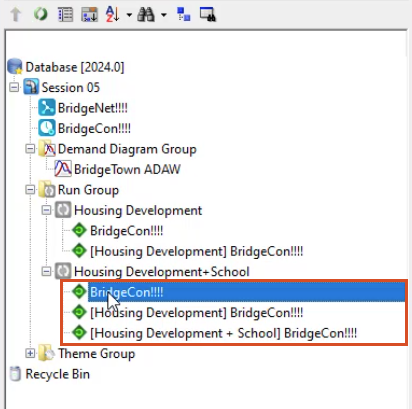
To open the three simulations for comparison:
To graph the differences in pressure for the simulations:
How to buy
Privacy | Do not sell or share my personal information | Cookie preferences | Report noncompliance | Terms of use | Legal | © 2025 Autodesk Inc. All rights reserved
Sign in for the best experience
Save your progress
Get access to courses
Receive personalized recommendations
May we collect and use your data?
Learn more about the Third Party Services we use and our Privacy Statement.May we collect and use your data to tailor your experience?
Explore the benefits of a customized experience by managing your privacy settings for this site or visit our Privacy Statement to learn more about your options.