Step-by-step guide
When working in InfoSurge Pro, editing the stem change curve of a valve can significantly impact the pressures resulting from a surge. This example uses the optimal valve closure procedure—a two-stage valve closure—to close a 12-inch gate valve using different valve operation times.
- Double-click the desired project .aprx file to open ArcGIS Pro.
- Click the InfoWater Pro tab to open the InfoWater Pro ribbon.
- In the Project panel, click Initialize.
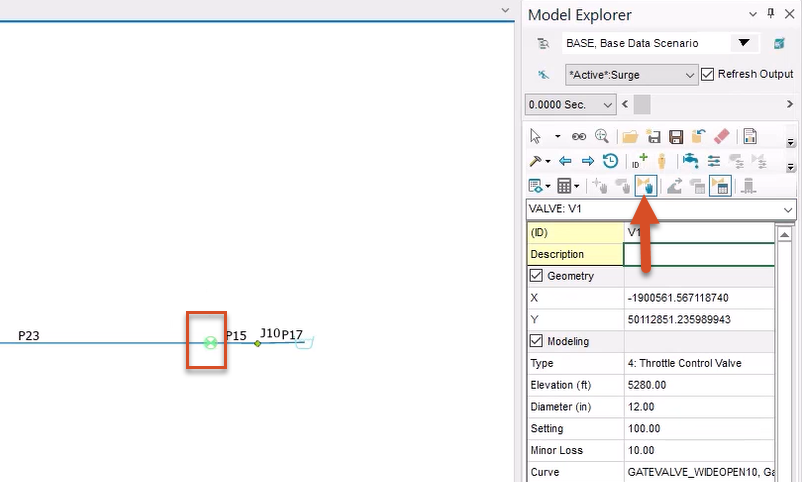
- From the map, select the valve with the ID V1.
- From the Model Explorer toolbar, click AV (TCV) Operation Change.
- In the dialog box that opens, next to the Stem Change Curve drop-down, click Browse (…) to open the Curve dialog box.
- With STEMCHANGECURVE selected, in the toolbar above the curve table, click Set Rows.
- In the Curve popup, in the Value field, enter a value of 4.
- Click OK.
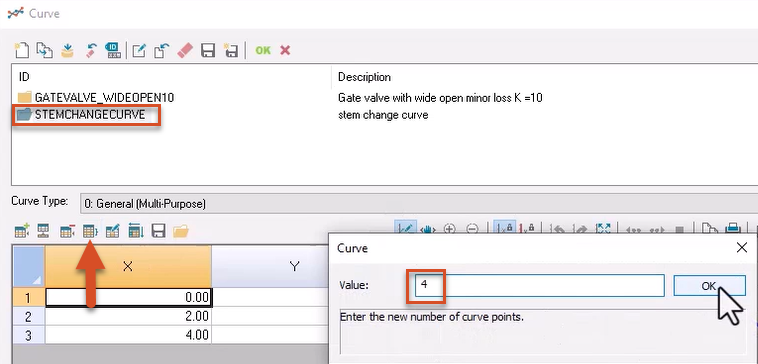
The table updates to include a fourth row.
- In the third row of the X column, enter a value of 4.00.
- In the third row of the Y column, enter 40.00.
- In the fourth row of the X column, enter 12.00.
- In the fourth row of the Y column, enter 0.
- Click elsewhere in the table to update the graph to reflect the new curve values.
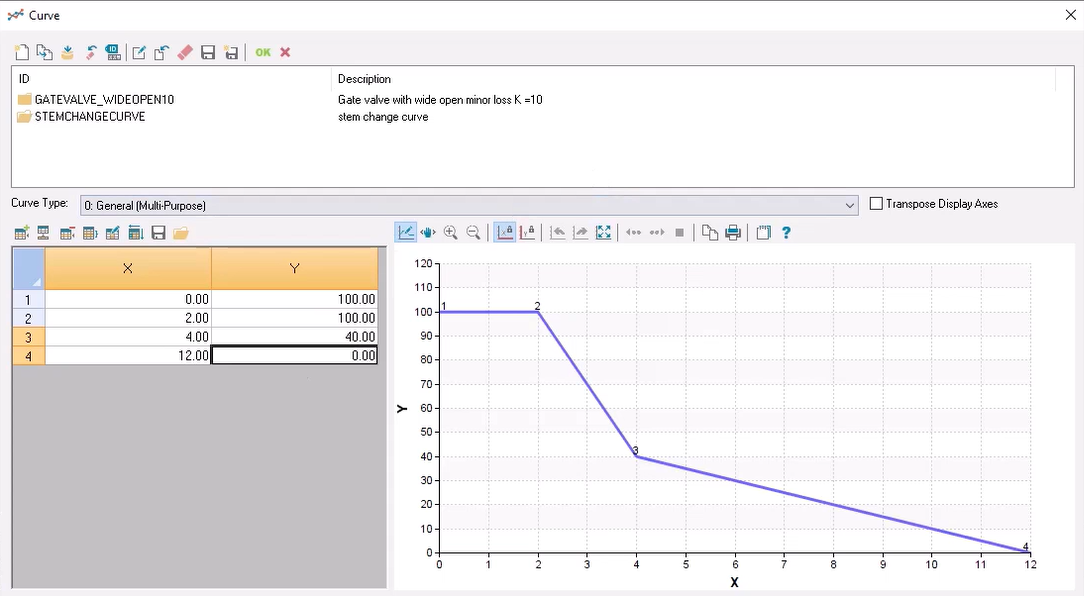
The updated stem change curve closes valve V1 60% from 2 seconds to 4 seconds, and then closes the remaining 40% from 4 to 12 seconds.
- Click OK to close the Curve dialog box.
- In the AV (TCV) Operation Change Data dialog box, click Update.
To run a surge analysis with the extended operation time:
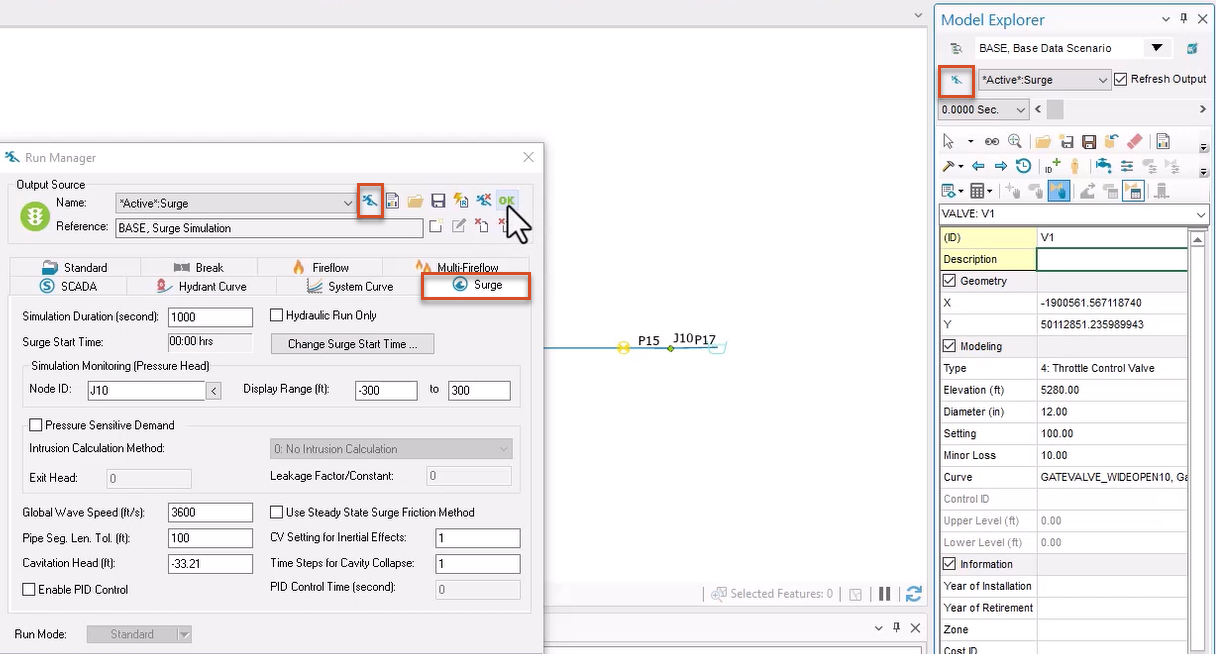
- From the Model Explorer, click Run Manager.
- In the Run Manager dialog box, switch to the Surge tab.
- Click Run.
- When the analysis is complete, click OK to close the dialog box.
- From the InfoWater Pro ribbon, View panel, click Report Manager.
- In the Report Manager dialog box, click New.
- In the Output/Report Graph dialog box, under Available Output Source, select *Active*:Surge.
- From the Graph Report tab, pick Surge Pump/AV Graph.
- Click Open.
- From the map, select valve V1.
- Click Report to see the results in a table format.
- Right-click the Upstream Pressure (psi) column header and pick Sort Descending.
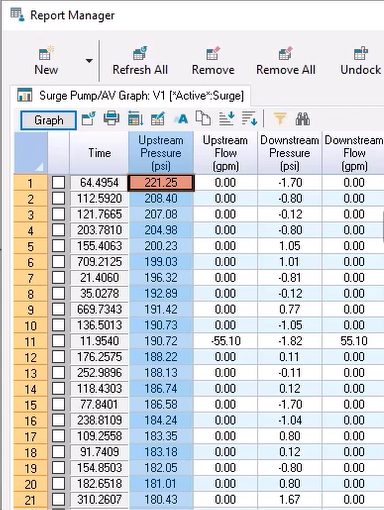
In this example, the maximum surge pressure upstream is 221.25.
Now, edit the valve stem change curve for valve V1:
- Repeat steps 4-6 to return to the Curve dialog box.
- Change the value in the fourth row of the X column to 22.
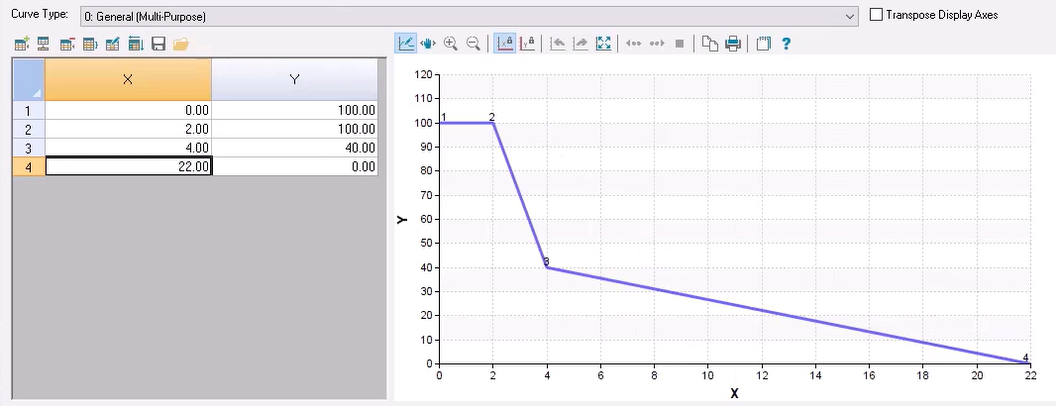
This updated curve closes the valve by 60% from 2 seconds to 4 seconds, and then closes the remaining 40% from 4 seconds to 22 seconds.
- Open the Run Manager and Run another surge analysis.
- Reopen the Report Manager and click Refresh All to review the results.
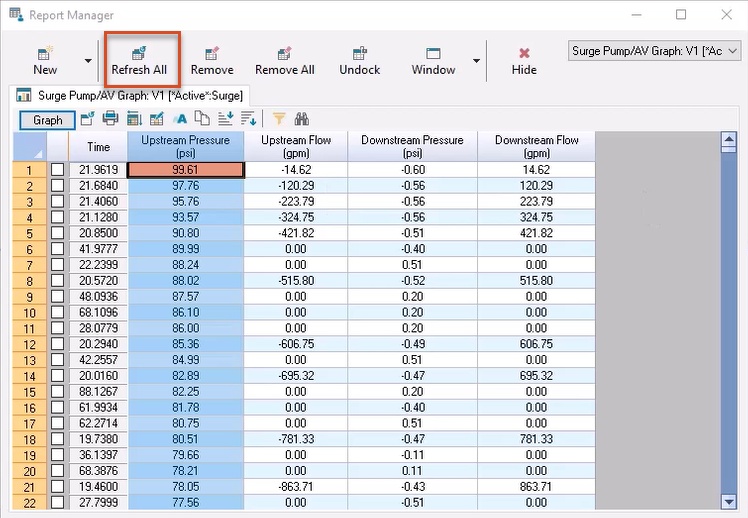
Note that optimizing valve operation times resulted in a drop in maximum upstream pressure to 99.61 psi.


