Step-by-step guide
Use the Steady State calibration mode in InfoWater Pro to specify the desired pipe roughness, junction demands, unknown pipe statuses, junction pressures, and pipe flows obtained from field measurement data. Once the modeling parameters have been specified, a calibration simulation can be run, and the results exported to any project data set. This example calibrates pipe roughness in a junction pressure zone.
- Double-click the desired project .aprx file to open ArcGIS Pro.
- Click the InfoWater Pro tab to open the InfoWater Pro ribbon.
- In the Project panel, click Initialize.
Start by running a simulation for the current scenario:
- On the InfoWater Pro ribbon, Analysis panel, click Run to open the Run Manager.
- Click Run to run the simulation and create an output for the current scenario.
- Click OK to close the Run Manager.
Set up a calibration run for the active scenario:
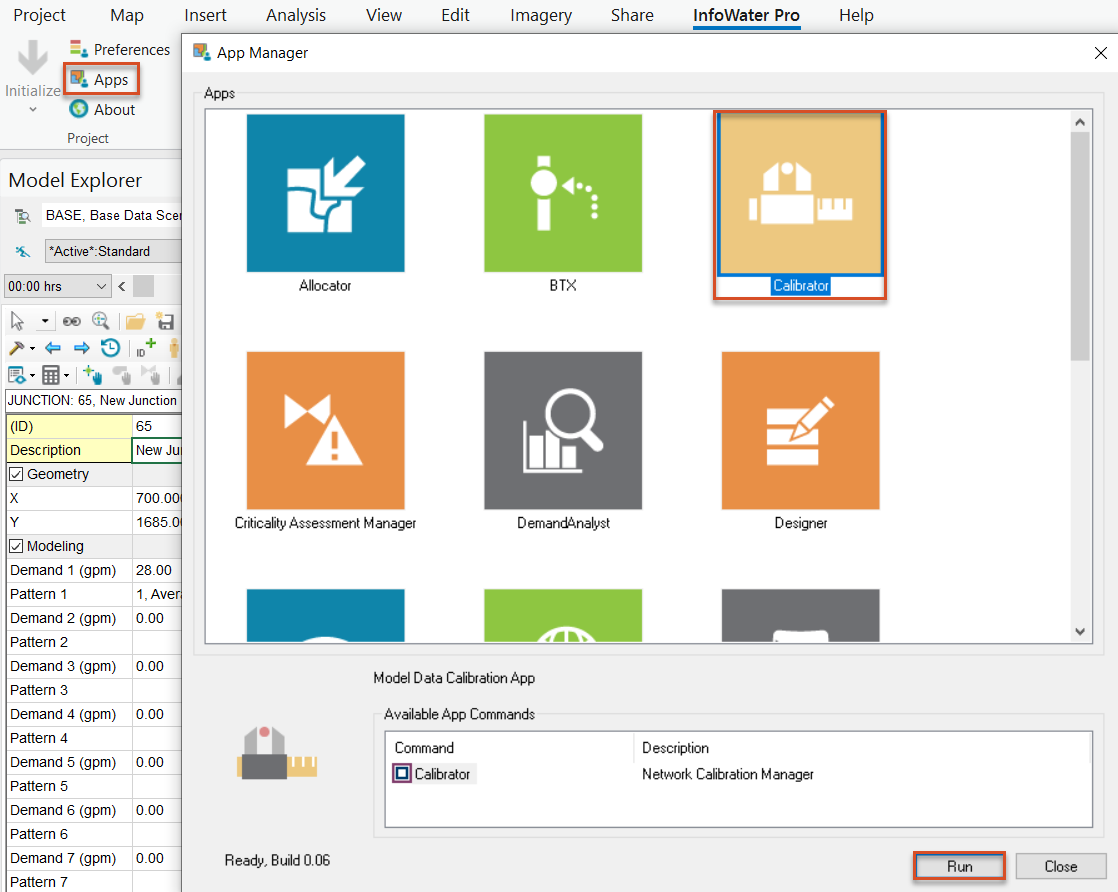
- On the InfoWater Pro ribbon, in the Project group, click Apps.
- From the Apps Manager, select Calibrator.
- Click Run to open the Calibrator app.
- From the Mode menu, select Steady State.
To create a new pipe database information field:
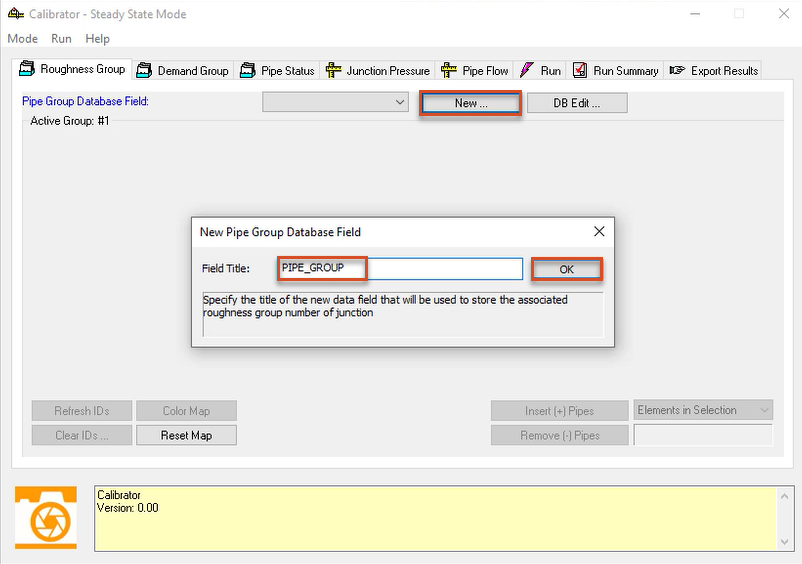
- In the Roughness Group tab, click New.
- In the New Pipe Group Database Field dialog box, add a title, such as “PIPE_GROUP”.
- Click OK.
In this example, all pipes have the same material and were installed in the same year, so four groups will be created for this calibration.
- In the table, select the Min column.
- Right-click and select Block Edit.
- In the Block Edit dialog box, change the Operation to Set Equal (=).
- Set the Value to 50.
- Click OK.
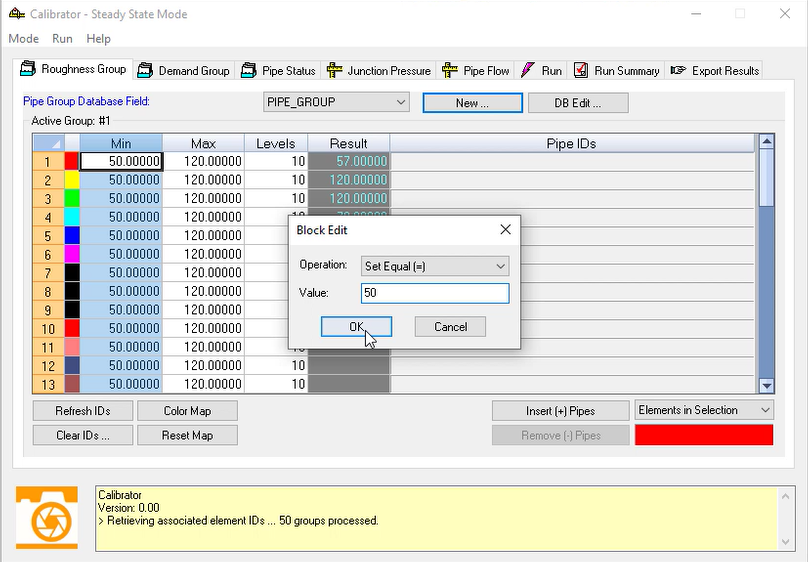
- Repeat steps 14-18 for the Max column, setting the Value to 120.
- Repeat the same steps for the Levels column, setting the Value to 10.
The increment for the calibration from Min to Max is determined by Levels, where each increment equals [Max-Min] divided by Levels.
- Close the Calibrator.
- On the InfoWater Pro ribbon, in the Domain group, click Domain Manager.
- In the Domain Manager, enable the DB query option.
- Use the drop-down to select the query 4INCH_PZM3.
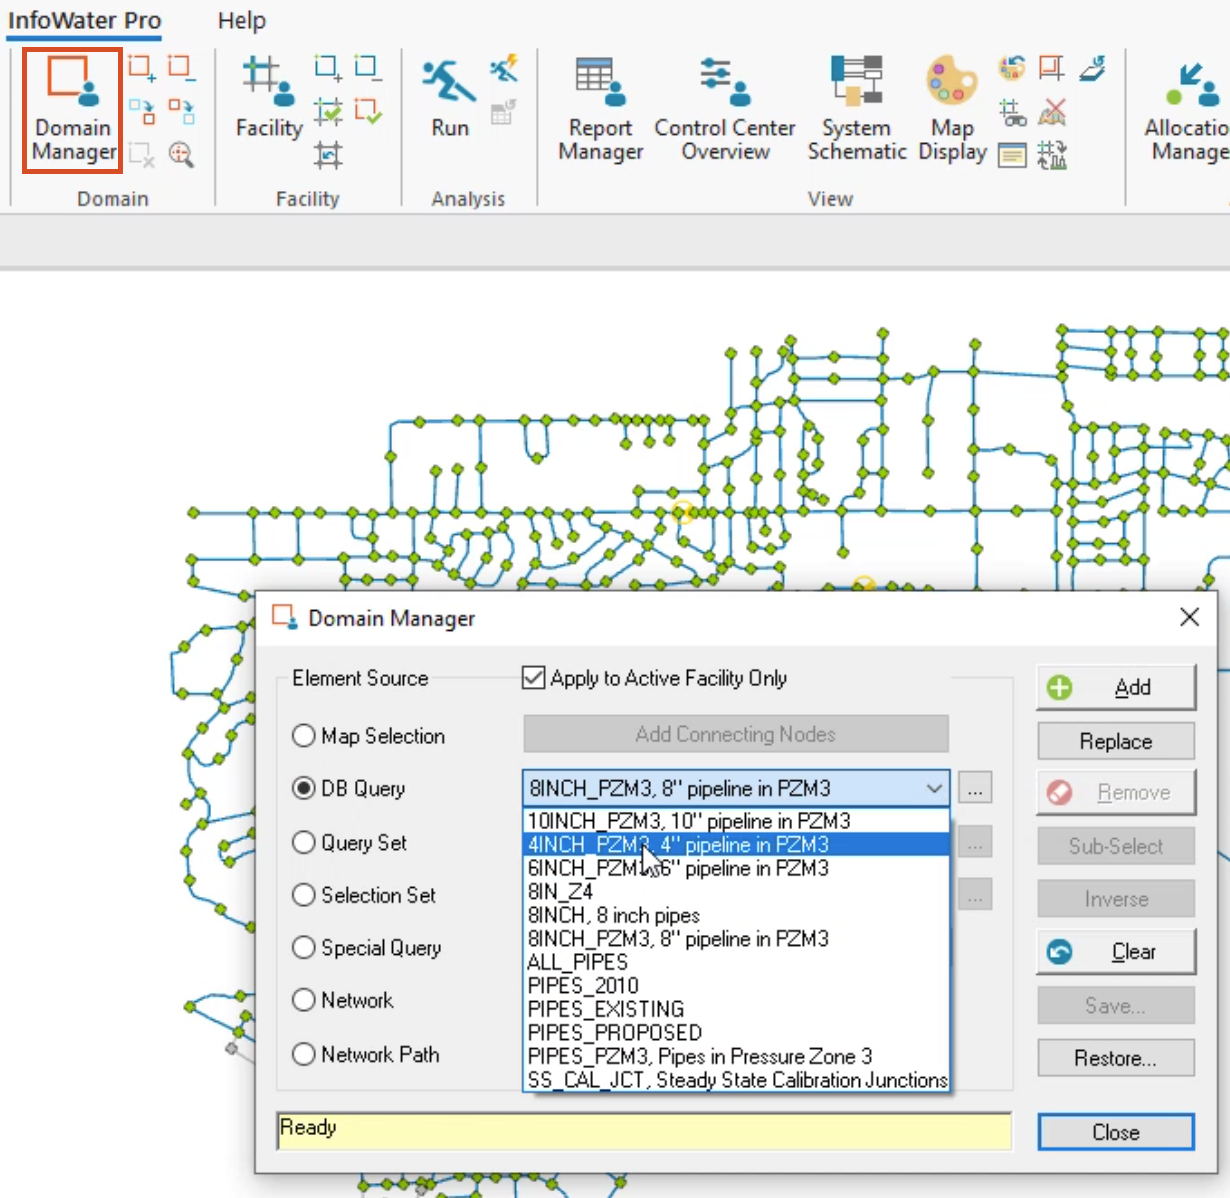
This query has already been created in the model.
- Ensure that Apply to Active Facility Only is enabled.
- Click Add.
All 4-inch pipes in Pressure Zone 3 are added to the domain.
- Close the Domain Manager.
Now, edit the domain to add these pipes to a pipe group.
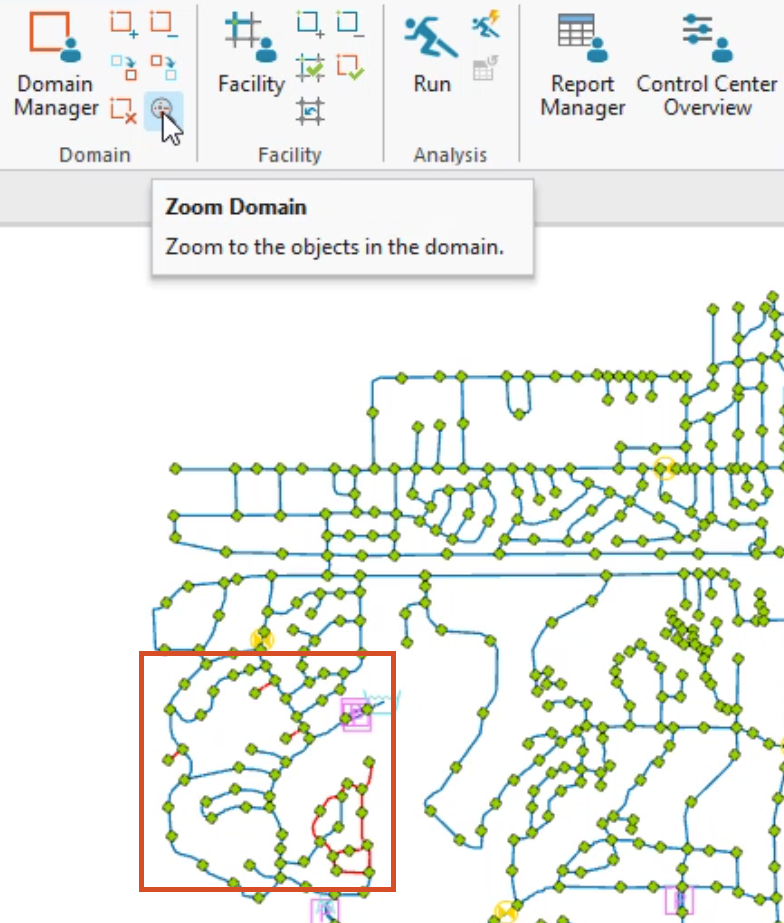
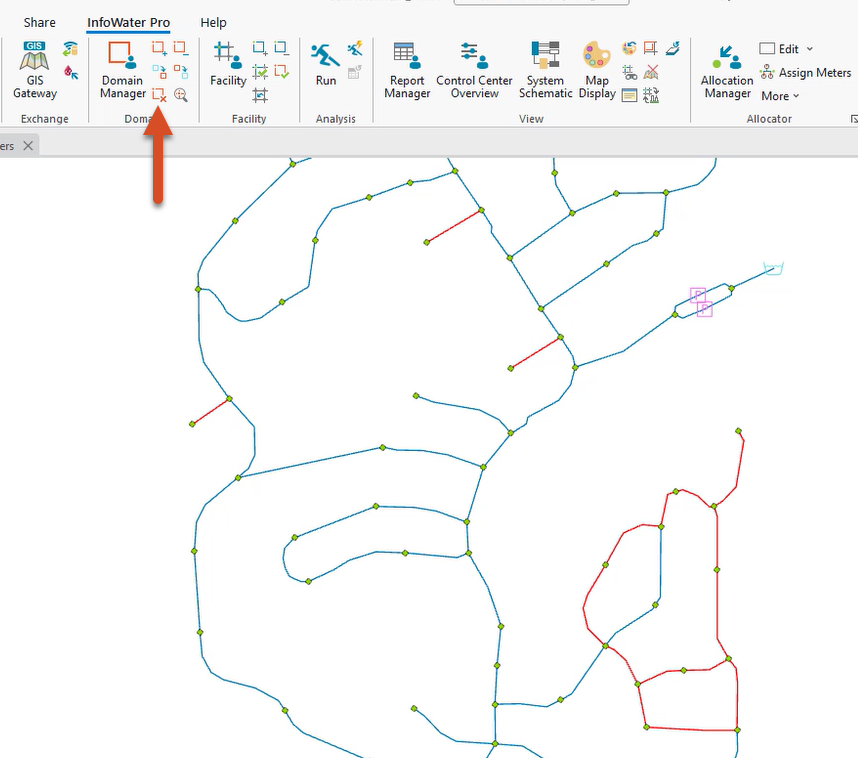
- From the ribbon, Domain panel, click Zoom Domain to zoom the map view to the domain of 4-inch pipes.
- From the ribbon, Edit panel, click Edit Domain.
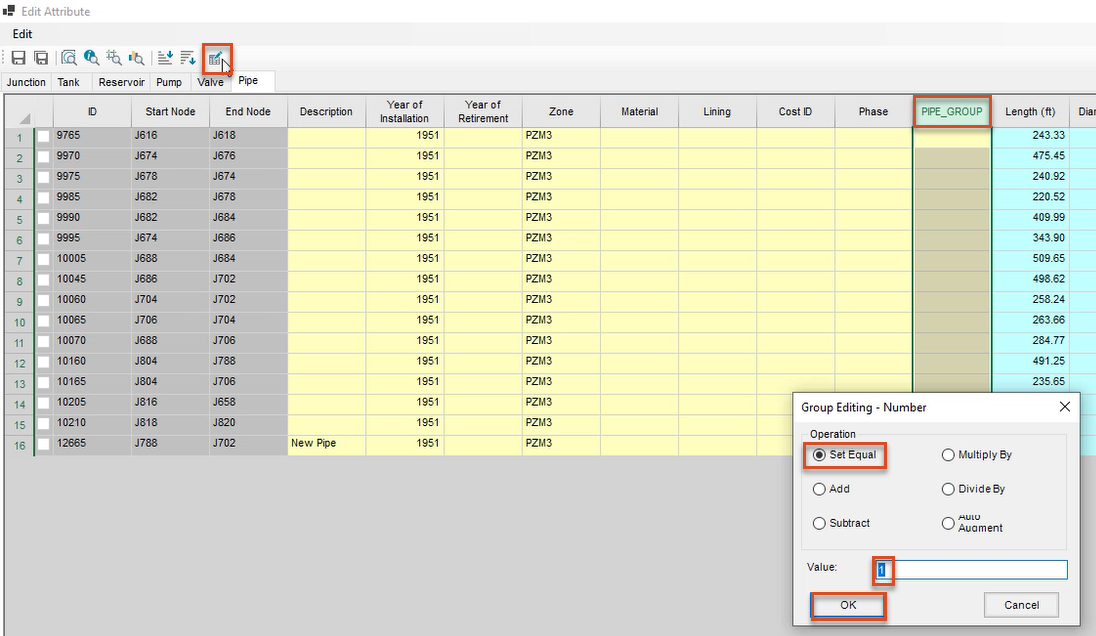
- Maximize the Edit Attribute dialog box, and click the Pipe tab.
- Select the PIPE_GROUP column.
- In the toolbar, click Block Editing.
- In the Group Editing dialog box, under Operation, enable Set Equal.
- Set the Value to 1.
- Click OK.
- Click Save.
- Close the Edit Attribute dialog box.
- From the ribbon, Domain panel, click Clear Domain.
- Repeat steps 22-38 for each of the remaining three pipe sizes
Be sure to select and add each as a DB Query in the Domain Manager before editing the domain to add the PIPE_GROUP values. For step 34, in the Edit Attribute dialog box, set the following:
- For 6INCH_PZM3, set the PIPE_GROUP value to 2.
- For 8INCH_PZM3, set the PIPE_GROUP value to 3.
- For 10INCH_PZM3, set the PIPE_GROUP value to 4.
Remember to Save the model and clear the domain after each operation.
Return to the Calibrator to complete the setup:
- In the Project panel, click Apps.
- From the Apps Manager, select Calibrator, and then click Run.
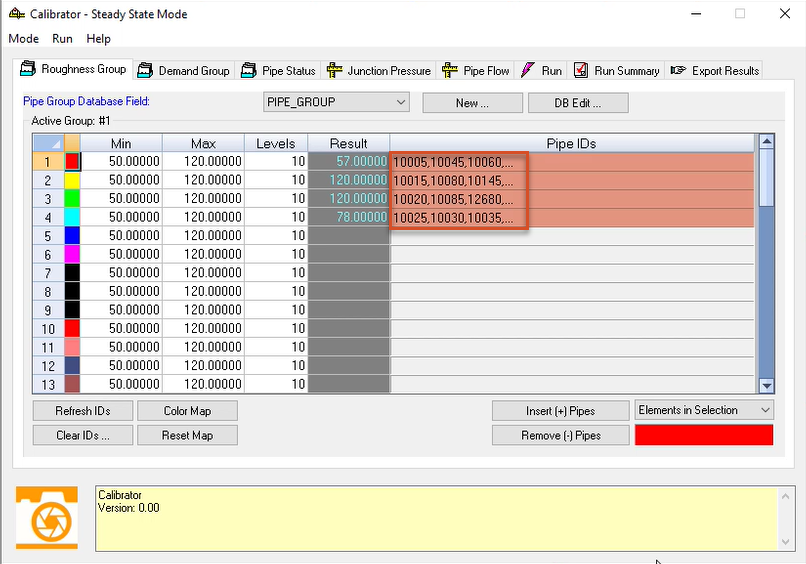
In the Roughness Group tab, the first four lines in the Pipe IDs column are now populated.
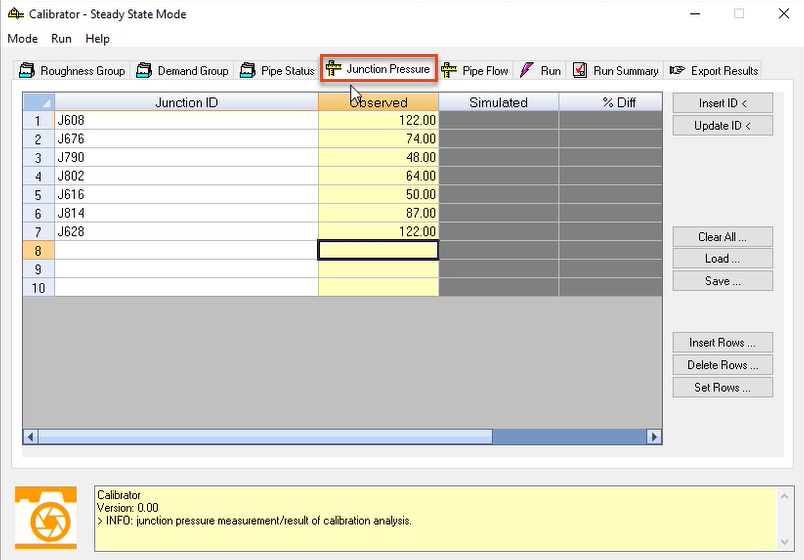
- Switch to the Junction Pressure tab.
This tab allows for entering measured field pressures for specific junctions across the distribution system. In this example, the junctions shown represent pressure measurements within PZM3.
- In the Junction ID column, enter these IDs in the first 7 rows: J608, J676, J790, J802, J616, J814, and J628.
- In the Observed column, enter these values in the first 7 rows: 122, 74, 48, 64, 50, 87, and 122.
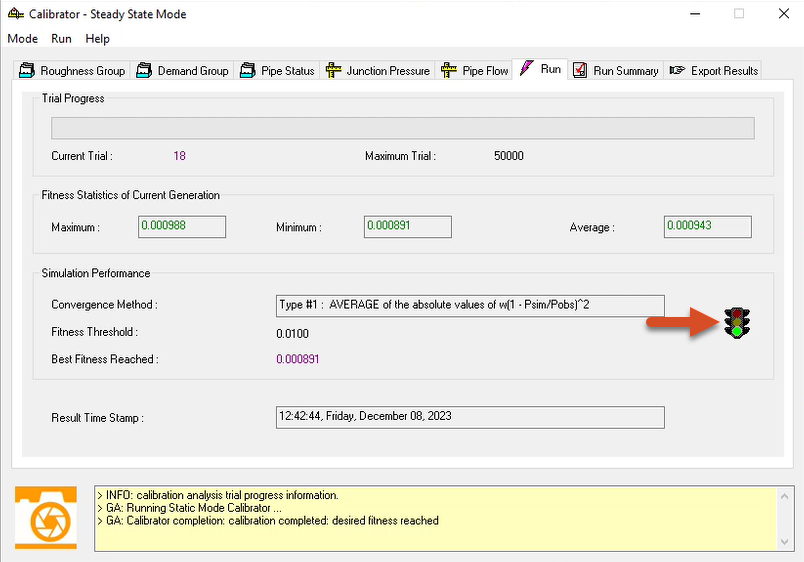
Now, run the calibration simulation:
- From the Run menu, click Start to begin the calibration simulation process.
- On the Run tab, look for the green traffic light to indicate success.
Once complete, review the results on the tabs where data was entered for this example:
- Select the Roughness Group tab to view the simulated roughness for the four pipe groups, based on observed junction pressure results.
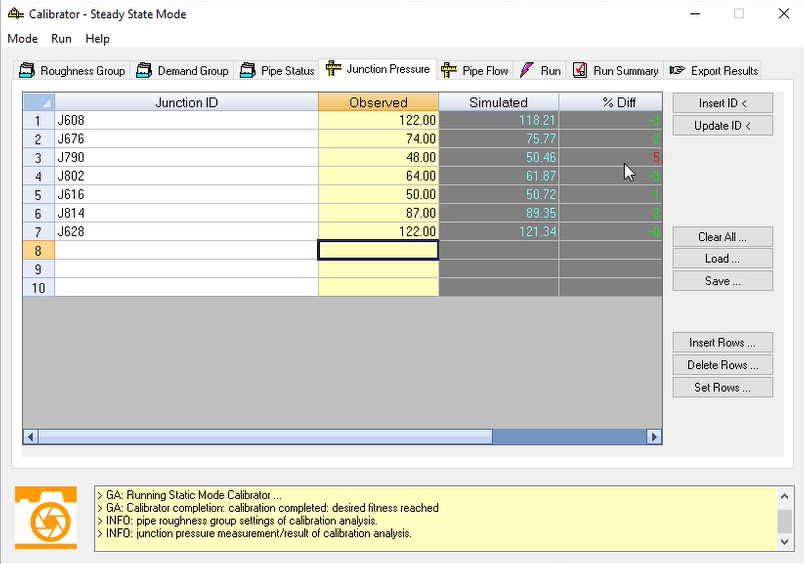
- Select the Junction Pressure tab to view the simulated pressure results at each specified junction, based on the new calibrated roughness, as well as the percent difference between observed pressure and simulated pressure.
Values in red in the % Diff column indicate values outside the evaluation thresholds set in the Calibration Options.
Once satisfied that the calculated roughness factors are reasonable, export the results to an existing or new pipe set.
- Switch to the Export Results tab.
- Enable Apply New Roughness Settings in.
- Click Browse (…) to open the Pipe Set dialog box
- Click New.
- Add a New ID of “NEW_PIPE_SET”.
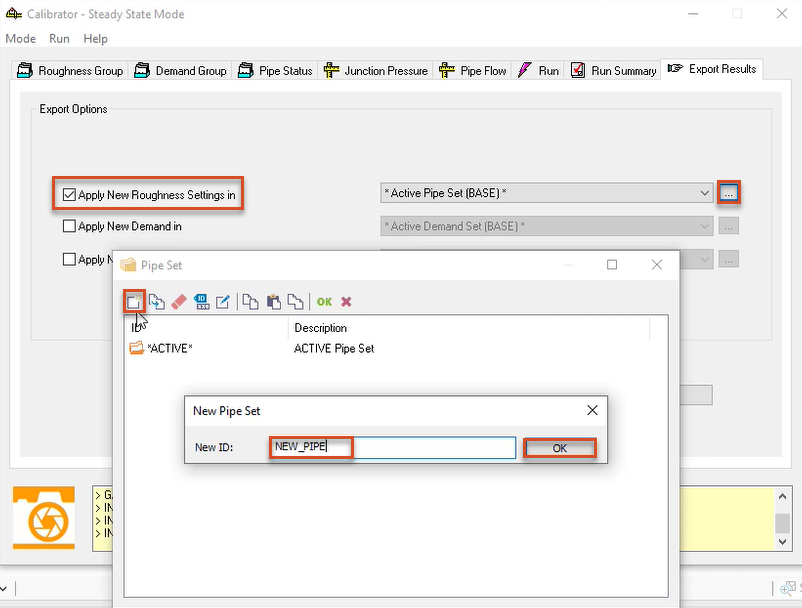
- Click OK.
- Click OK again to close the Pipe Set dialog box.
- Ensure that the new pipe set is selected in the drop-down.
- Click Export.
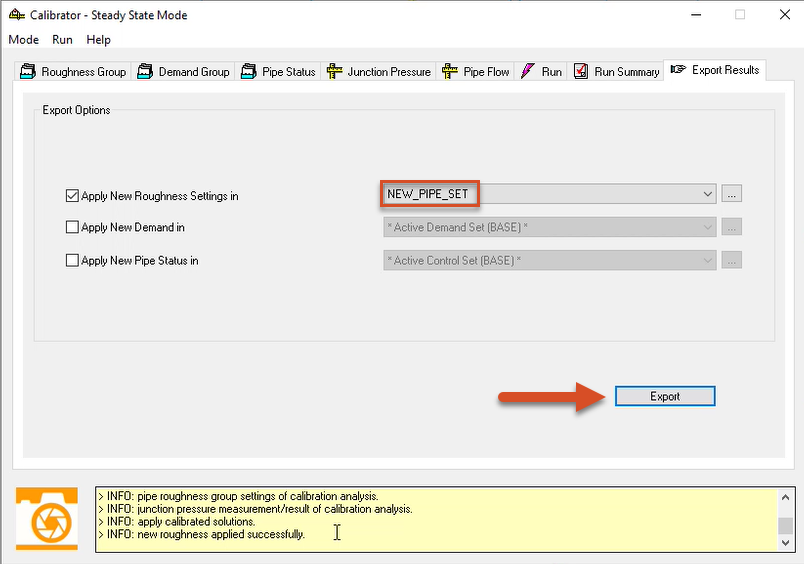
All roughness coefficients are applied to the various pipe groups.
- Close the Calibrator.
- Save the model.


