00:03
In this example, you perform a Water Quality calibration using InfoWater Pro’s Water Quality (WQ) Calibrator
00:12
to calibrate pipe wall coefficients for a pressure zone.
00:16
To begin, double-click the desired .aprx file to open ArcGIS Pro.
00:24
Once the project starts, click the InfoWater Pro tab to open the InfoWater Pro ribbon.
00:32
In the Project panel, click Initialize.
00:35
Start by running, initialized, and a simulation run completed for the current scenario.
00:40
On the InfoWater Pro ribbon, in the Analysis panel, click Run to open the Run Manager.
00:47
Click Run to run the simulation and create an output for the current scenario
00:53
Leave the Run Manager open.
00:56
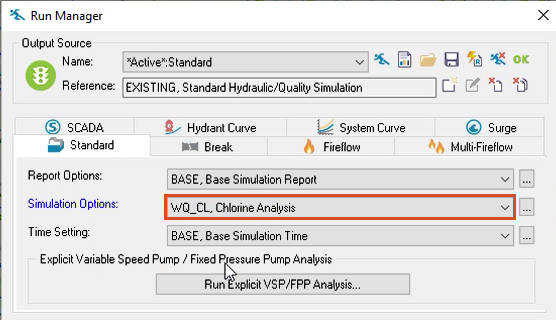
Next, run a chlorine Water Quality simulation for the current scenario.
01:02
In the Simulation Options drop-down, select WQ_CL, Chlorine Analysis.
01:10
In the Time Setting dropdown, select BASE, Base Simulation Time.
01:17
Click Run to run the simulation and create an output for the Water Quality simulation.
01:23
Close the Run Manager.
01:26
You can now access the WQ Calibrator.
01:30
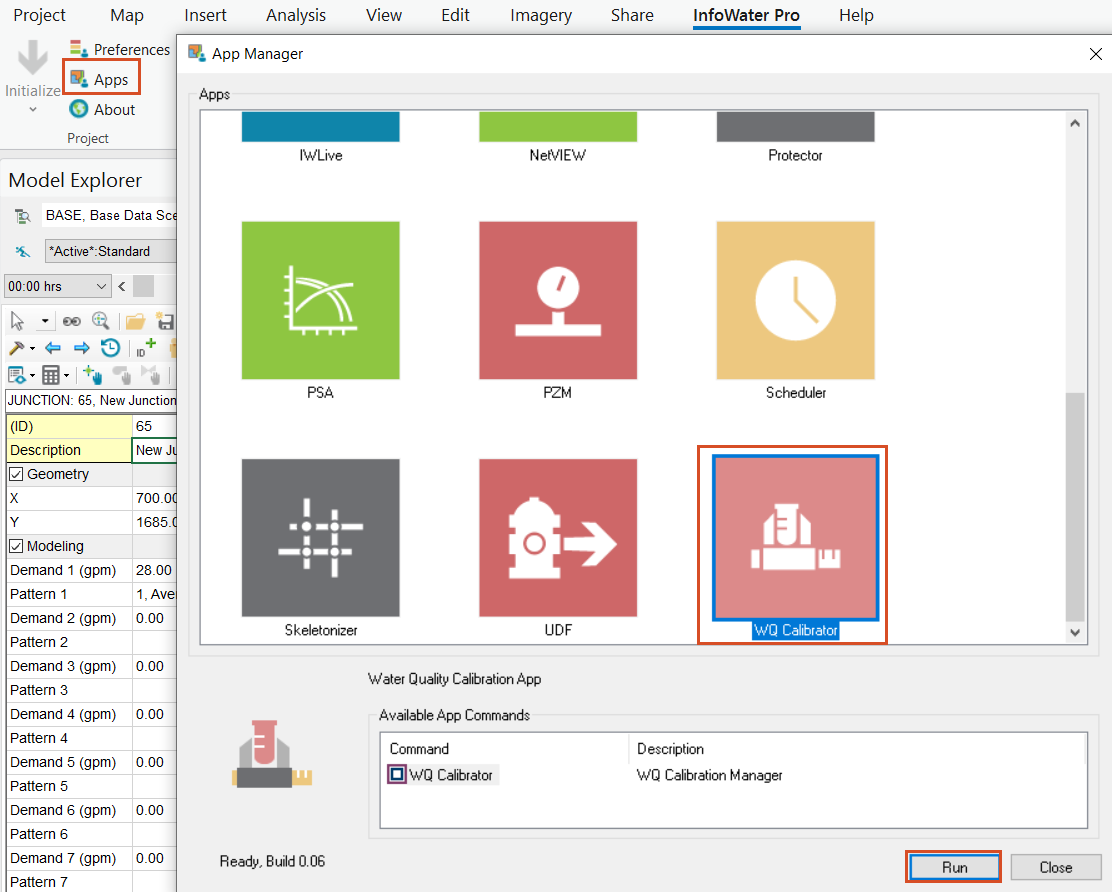
On the InfoWater Pro ribbon, in the Project panel, click Apps.
01:35
From the Apps Manager, select WQ Calibrator, and then click Run to open the Water Quality Calibrator app.
01:45
Start setting up the calibration.
01:47
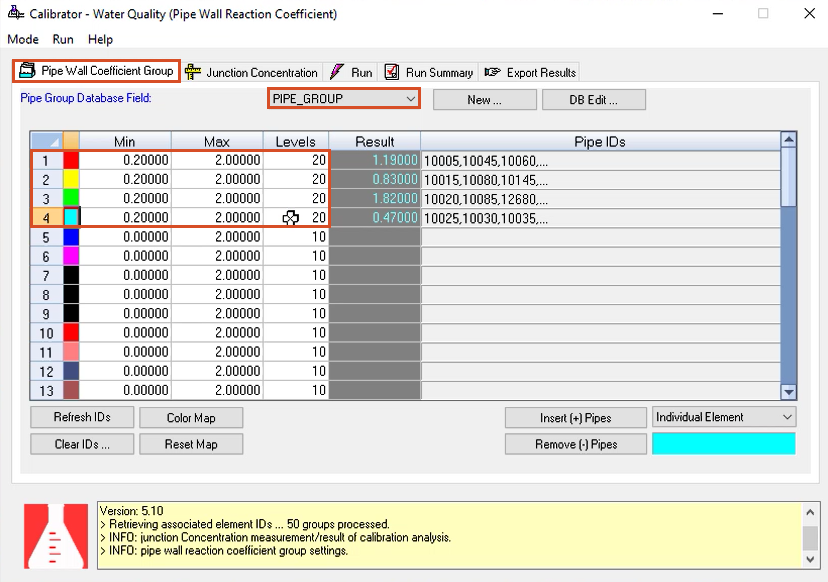
In the Pipe Wall Coefficient Group tab, you define the pipe groups to be used in the calibration analysis.
01:55
In the Pipe Group Database Field drop-down, select PIPE_GROUP.
02:01
The PIPE_GROUP was already created and consists of four pipe groups in the model of varying sizes.
02:08
For each of the four rows in the Pipe Group Database field, set the following:
02:14
Minimum wall coefficient roughness to 0.2
02:19
Maximum wall coefficient roughness to 2
02:26
The increment for the calibration from Min to Max is determined by Levels (each increment = [Max-Min] divided by Levels).
02:36
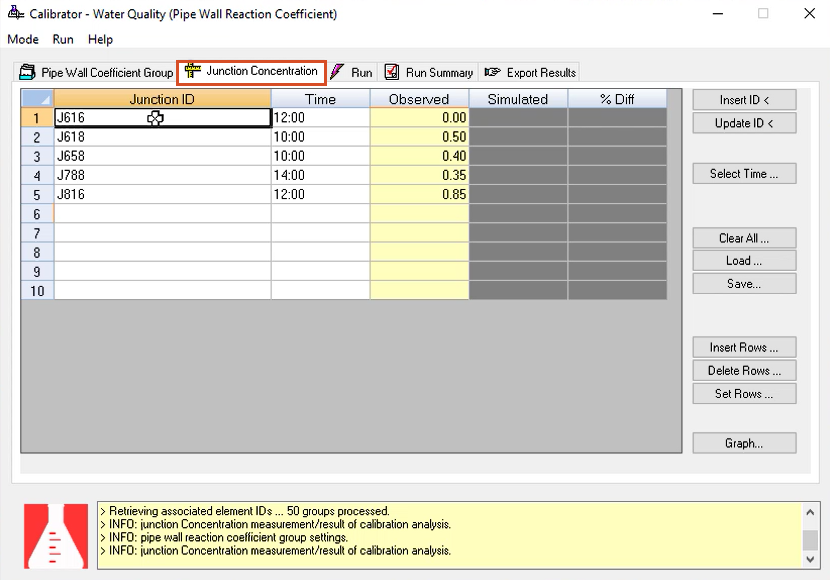
Switch to the Junction Concentration tab.
02:39
In this tab, you define the target field measurements for selected junctions that are to be matched in the calibration analysis.
02:48
Add the time and observed residual pressure for the following five junctions:
02:54
Junction ID J616, Time 12, Observed 0.00
03:03
Junction ID J618, Time 10, Observed 0.50
03:12
Junction ID J658, Time 10, Observed 0.40
03:21
Junction ID J788, Time 14, Observed 0.35
03:30
Junction ID J816, Time 12, Observed 0.85
03:39
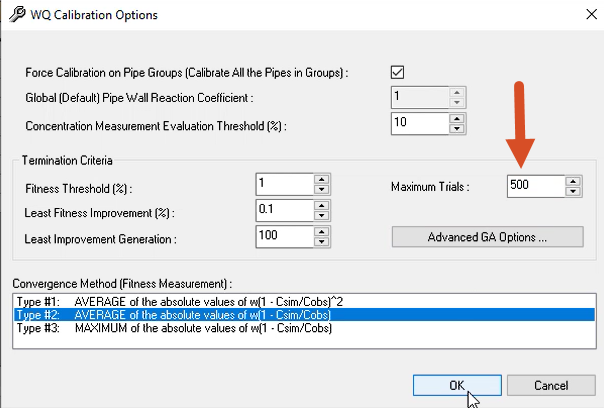
From the Run menu, select Options to open the WQ Calibration Options dialog.
03:46
In the Termination Criteria section, set the Maximum Trials to 500, and then click OK.
03:54
You are now ready to run the WQ calibration simulation.
03:59
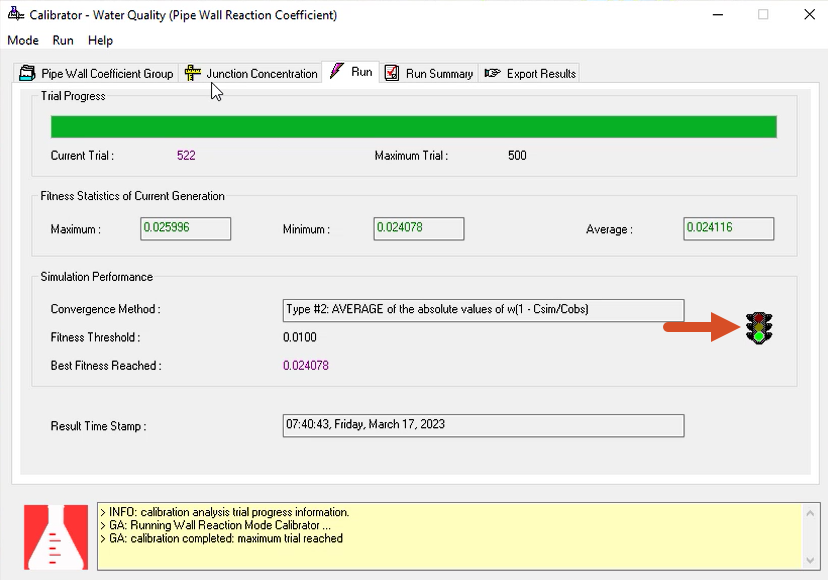
From the Run menu, click Start to start the WQ calibration simulation process.
04:07
On the Run tab, look for the green traffic light to indicate success.
04:12
Once complete, you can review the results on the Pipe Wall Coefficient Group
04:17
and Junction Concentration tabs where you previously entered data.
04:22
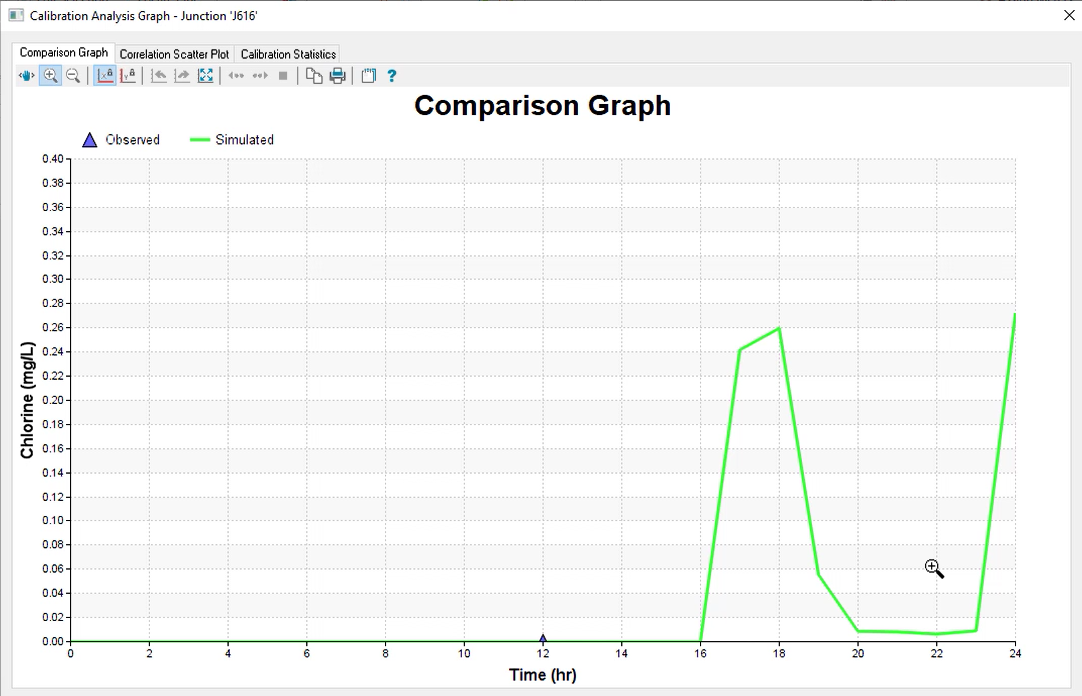
On the Junction Concentration tab, click Graph to show the correlation between observed and simulated junction concentrations.
04:32
Once you are finished reviewing the results, Close the graph and WQ Calibrator.