Step-by-step guide
Create and edit duct and pipe color fill legends.
- Open the project M05_01.rvt.
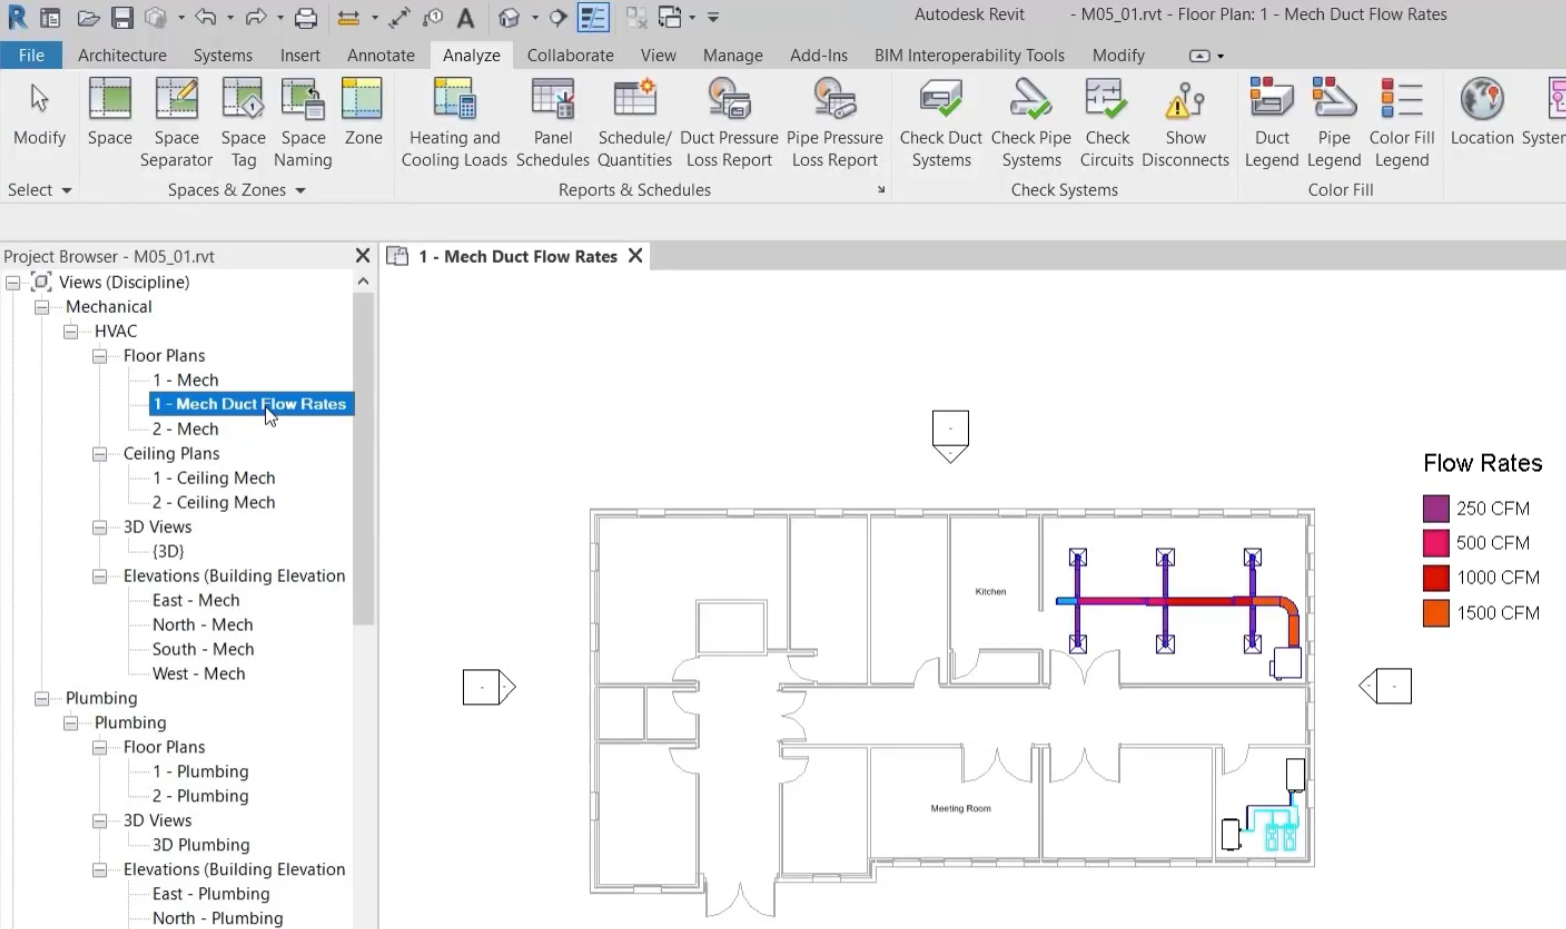
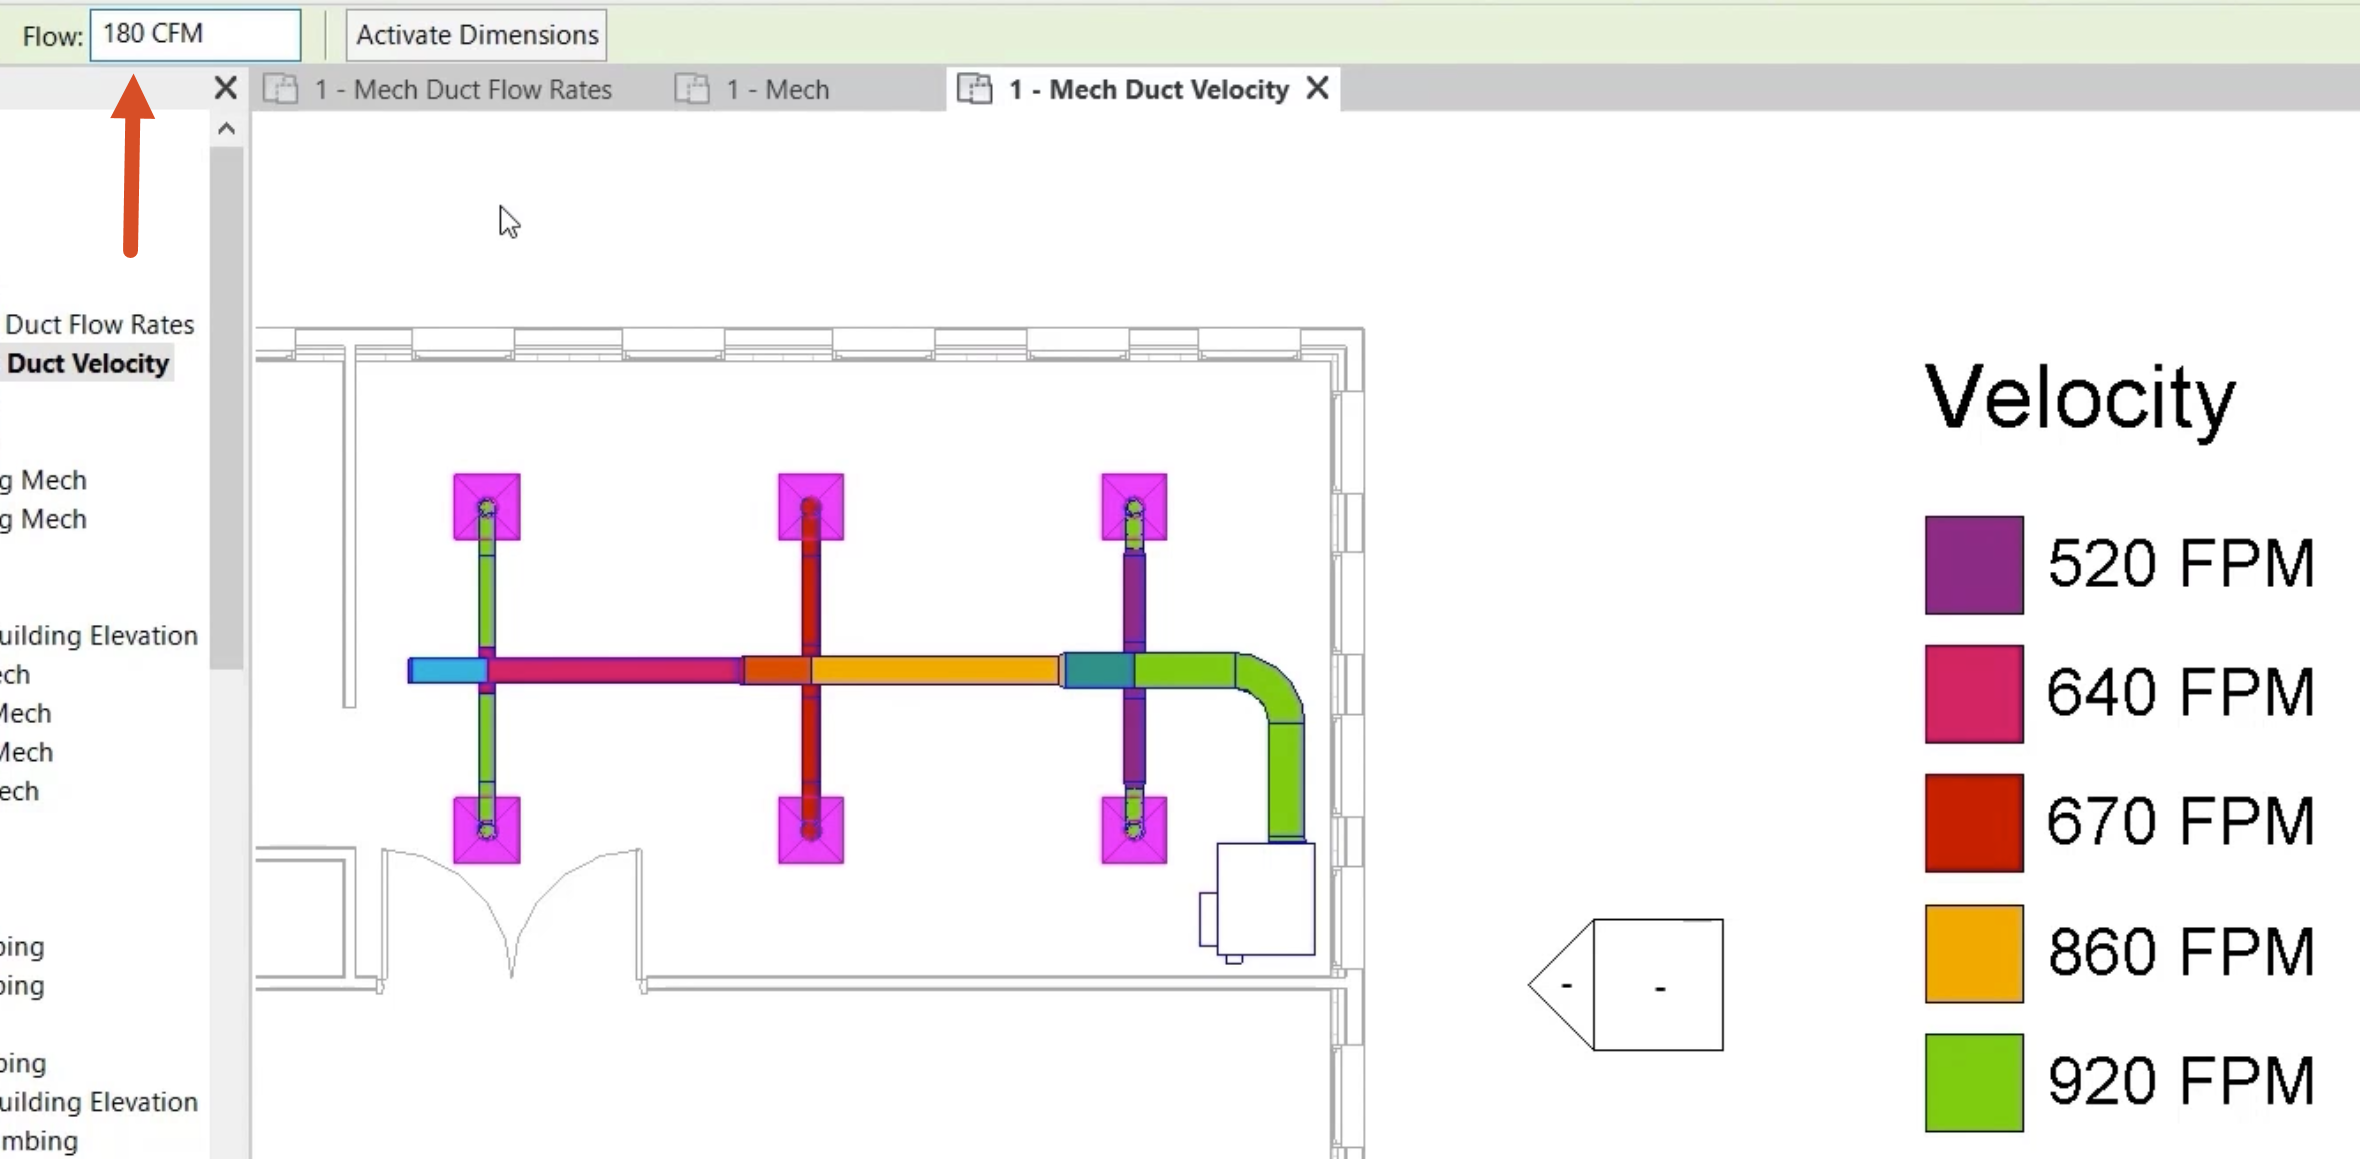
- Ensure that the current view is HVAC > Floor Plans > 1 – Mech Duct Flow Rates.
The duct color fill legend shows the air flow rates for the associated system. The rates range from 250 CFM at the air terminals to 1500 CFM at the fan VAV unit.
Create a duplicate view of the floor plan:
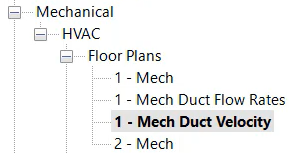
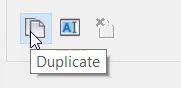
- Right-click 1 – Mech, and select Duplicate.
- Rename the view to "1 – Mech Duct Velocity".
- From the ribbon, Analyze tab, Color Fill panel, click Duct Legend.
- Click to place the legend to the right side of the floor plan. If necessary, move the floor plan to make room for the legend.
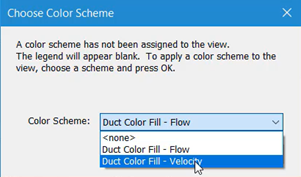
- Change the color scheme to Duct Color Fill – Velocity.
- Click OK.
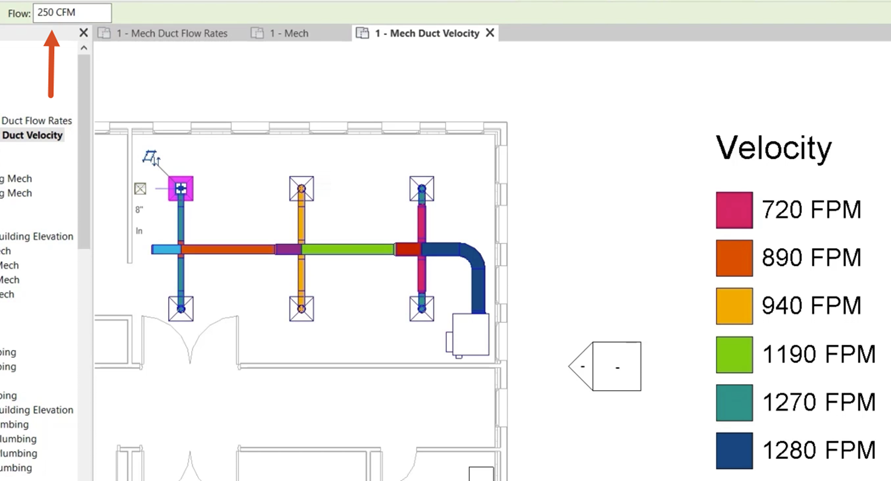
- Note the current velocities through the system, as well as the flow rate, which is 250 CFM at each air terminal.
- Select all the air terminals in the system.
- Change the flow rate to 180 CFM.
The legend automatically updates to show the new values for velocity in the system.
- Increase the flow rate at the air terminals to 200 CFM and note the slight increase in the velocity values in the system.
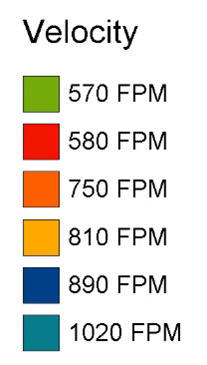
To reduce the Velocity in the system without reducing the flow rate to a level that is too low, increase the duct size:
- Select the sections of duct from the VAV unit.
- Increase the width to 15ʺ.
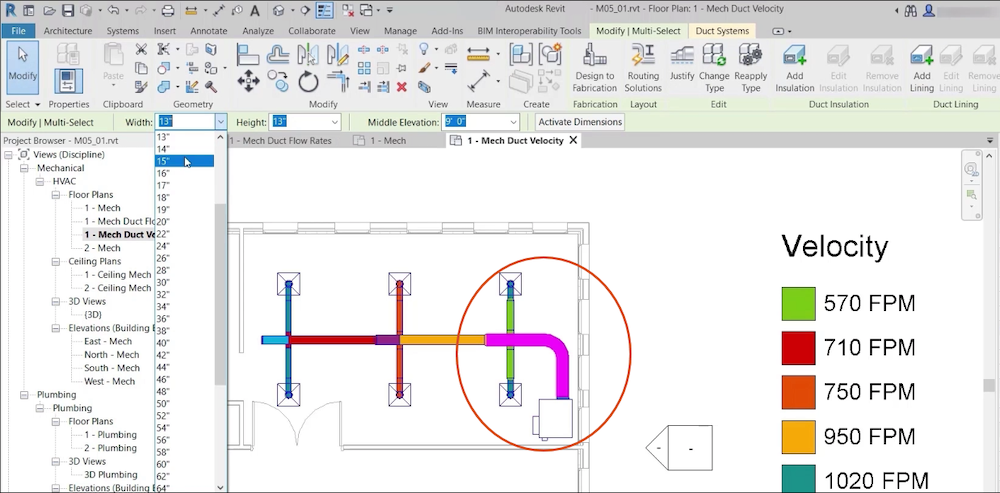
- Select the next section of duct to the left and increase the width to 13ʺ.
- Select the next section of duct to the left and increase the width to 11ʺ.
- Review the legend to see the reduction in velocity through specific sections of the network, corresponding with increases in duct size.
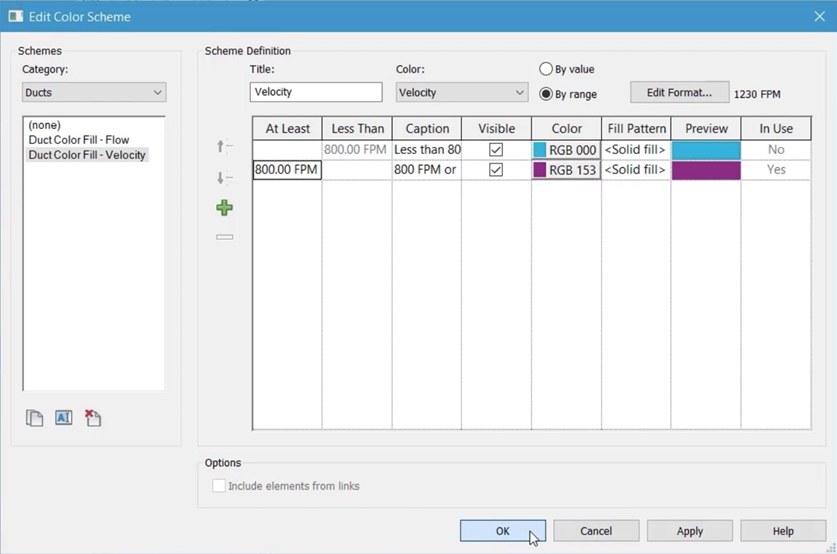
Edit the legend to make the information easier to assess and evaluate:
- Select the legend.
- On the ribbon, click Edit Scheme.
- In the Edit Color Scheme dialog box, change the Scheme Definition to By Range.
- Change the At Least value to 800 FPM.
- Click Apply.
- Click OK.
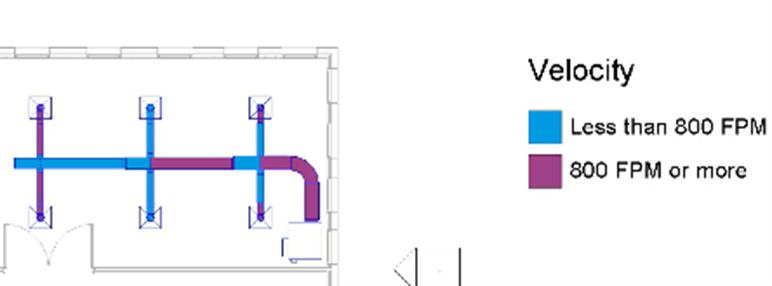
- Review the duct color fill legend, which now shows the values that are less than or more than 800 FPM.
- Create another duplicate view of the floor plan 1 – Mech, named "1 – Mech Pipe Flow Rates".
- From the Analyze tab, Color Fill panel, click Pipe Legend.
- Click to place the legend to the right side of the floor plan. If necessary, move the floor plan to make room for the legend.
- Click OK to accept the default color scheme.
- Select the legend.
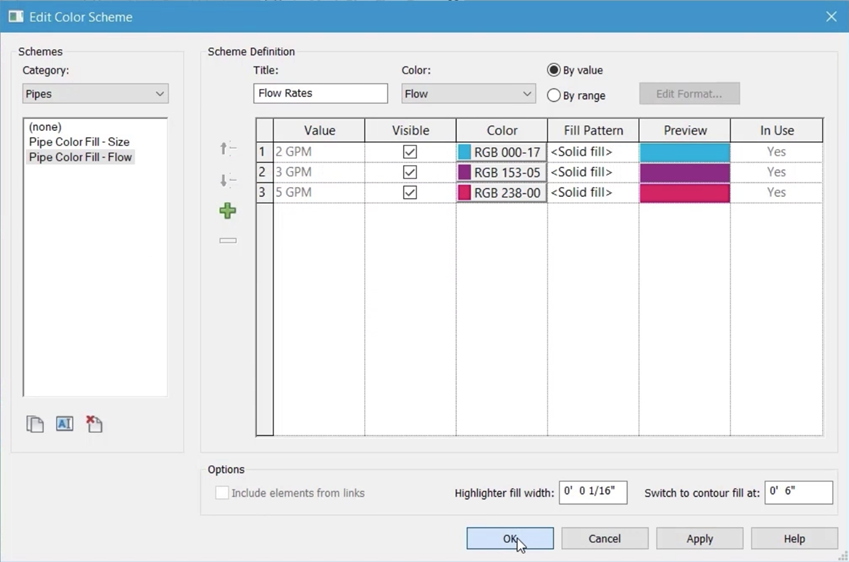
- Click Edit Scheme.
- In the Edit Color Scheme dialog box, click Duplicate to copy the existing Pipe Color Fill – Size scheme.
- Rename the new scheme to "Pipe Color Fill – Flow".
- Edit the Title to "Flow Rates".
- Set the Color drop-down to Flow.
- After reading the message that appears, click OK to close all dialog boxes.
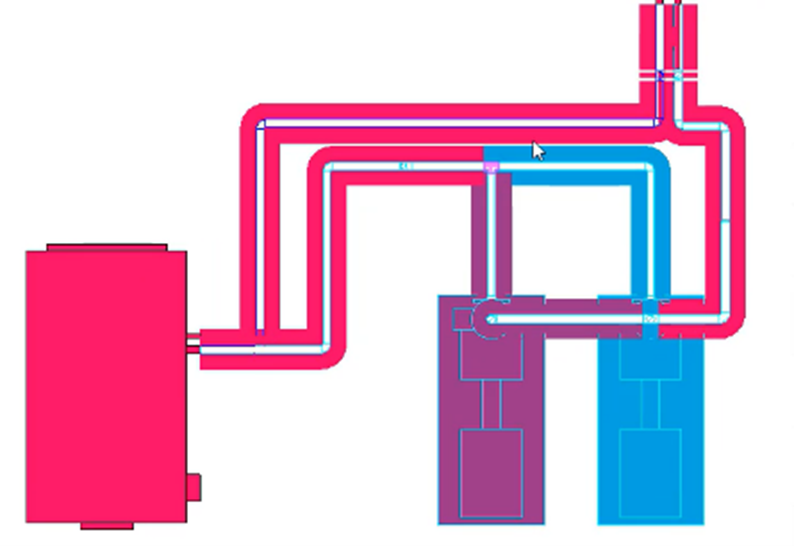
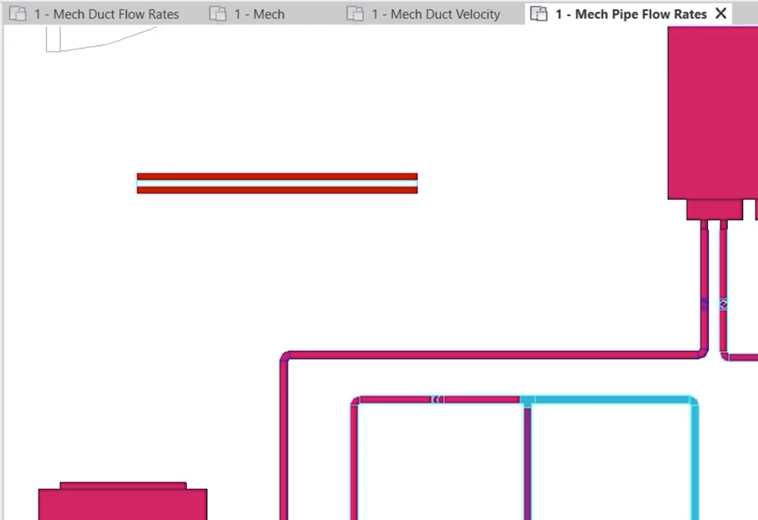
For smaller pipes, it may be preferable to have the color fill set to a contour on the outside of the pipes, which can be seen in the floor plan below:
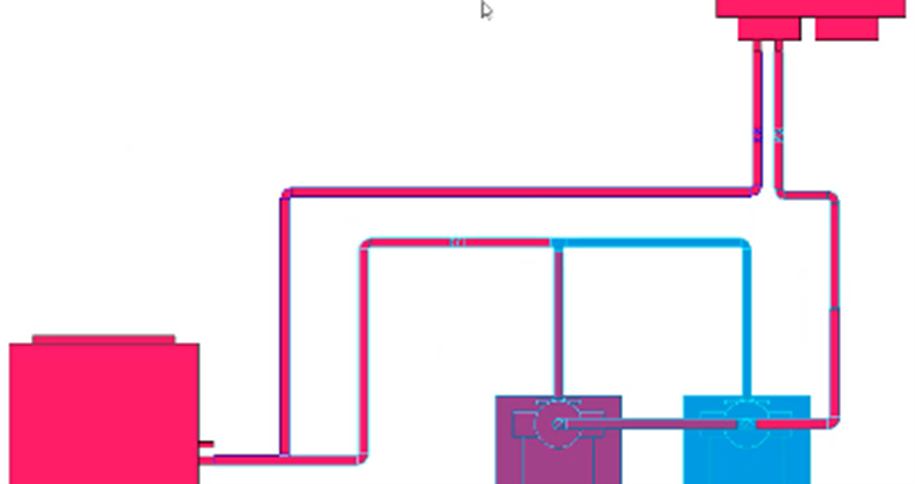
For larger pipe sizes, it may be preferable to have the color fill inside the pipe. To change the display:
- Select the legend.
- Click Edit Scheme.
- In the Edit Color Scheme dialog box, change the Highlighter fill width to 1/32ʺ.
- Switch to contour fill at 1ʺ.

- Click Apply.
- Click OK.
The display has changed from contour to fill because all of the pipes in this system are larger than 1ʺ.
- From the ribbon, Systems tab, click Pipe.
- Draw a short section of pipe with a diameter of less than 1ʺ.
As this pipe is less than 1ʺ, the color fill is set to contour, and the highlighter fill width is 1/32ʺ, rather than the default 1/16ʺ.
- Save the project.