Step-by-step Guide
InfoWorks WS Pro allows you to create contour themes for simulations that have been run. Contour themes allow you to color-code a range of values—in this case, those of concentrations of a dissolved substance—to create a color-graded visual representation of those values in a network.
- From the Model Group window, under the Water Quality-Chlorine run, drag-and-drop the Water Quality results into the GeoPlan.
- In the Docking windows toolbar, click Thematic Key window.

To remove some visual clutter in the GeoPlan:
- In the Thematic Key, right-click Polygons and deselect Display.

- Right-click Node and deselect Display.
- Right-click Hydrant and deselect Display.
To create a new theme:
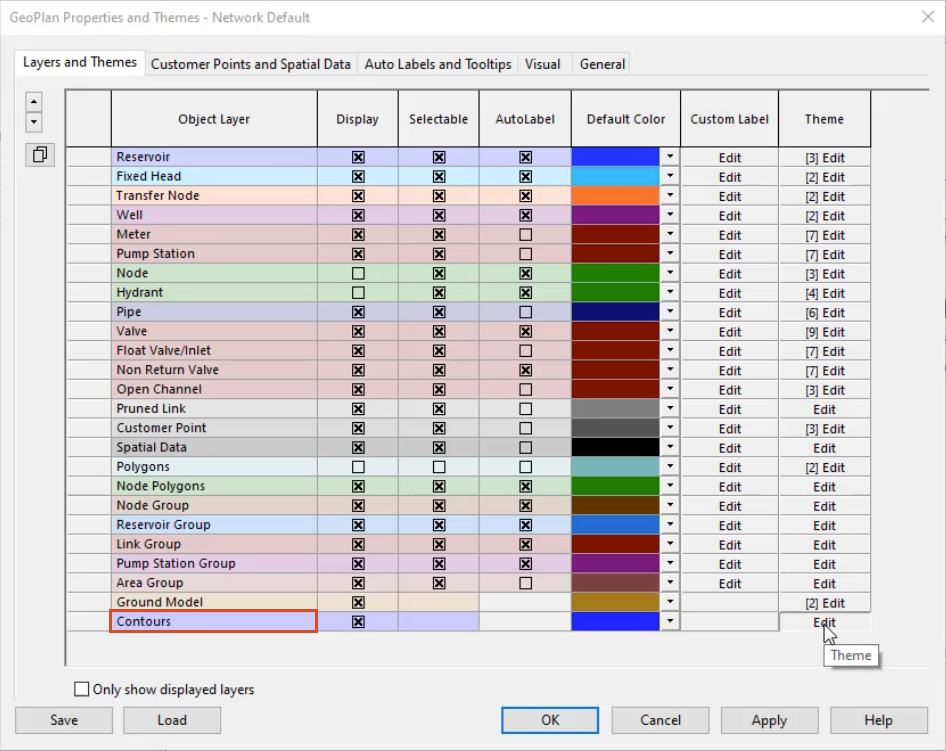
- Right-click an empty part of the GeoPlan and select Properties & Themes.

- In the GeoPlan Properties and Themes dialog box, Contours row, Theme column, click Edit.
- In the Contours: Base Theme dialog box, in the toolbar, click Add New.
- In the Name field, enter the name “Concentration”.
- Expand the Field drop-down and select sim.conc01 (Concentration01) as the source result for the theme.

The other properties in the dialog box populate with options.
- In the Ranged Themes group box, click the plus symbol (+) repeatedly to set the Value count to 10.
Notice each added value gets its own color, with a concentration range of between 1 and 100.

To customize these colors:
- Expand the palettes on both ends.
- Click Auto-Theme to re-grade the colors in between.
In this example, orange and blue now represent the low and high concentrations, respectively.

- Click Apply.
- In the GeoPlan Properties and Themes dialog box, click OK.
- In the notification asking if you want to save the new settings to the network, click No.
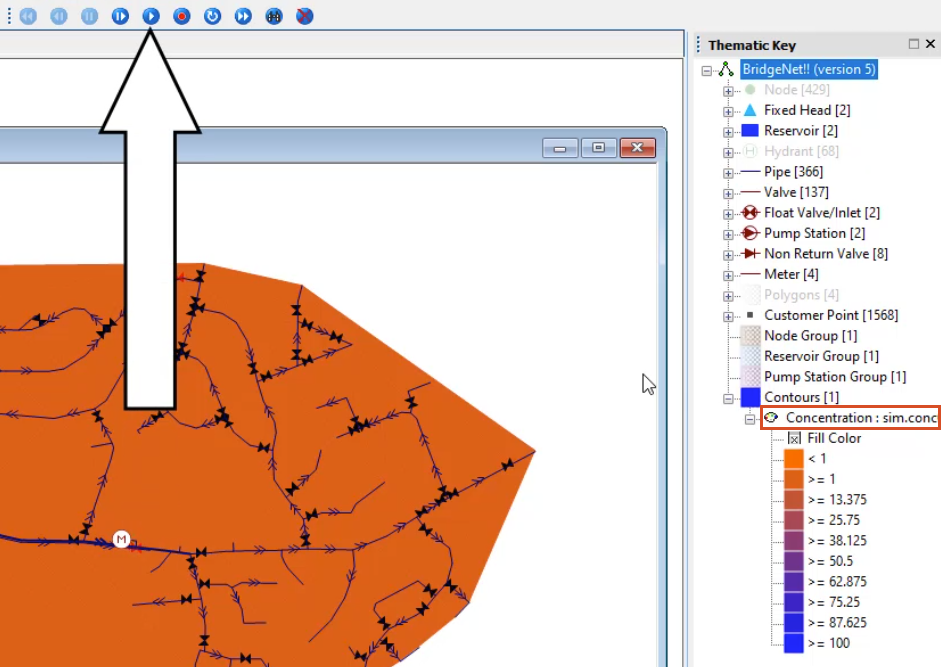
The GeoPlan now has a contour theme with a color gradation representing high and low areas of chlorine concentration. To view the concentration level each color represents:
- In the Thematic Key, expand Contours [1].
- Expand Concentration: sim.conc01.
- In the Replay toolbar, click Play to see how concentration changes over time.
Zoom in to various parts of the network to see how concentrations vary. In the Thematic Key, display the nodes and graph one of them to see how concentrations change over the course of the simulation.
To save the Contour Theme:
- In the Model Group window, right-click Session 02 and select New > Theme Group.

- In the New Name – Theme Group dialog box, click OK to accept the default name of Theme Group.
- Right-click an empty part of the GeoPlan and select Properties & Themes.
- In the GeoPlan Properties and Themes dialog box, click Save.
- In the Network editing properties dialog box, ensure Save to database object is selected.
- Click OK.

- In the Save Theme As dialog box, expand Session 02.
- Click Theme Group to highlight it.
- In the type box at the top, enter the name “WQ Contours”.
- Click Save.

- In the Select Properties to Save dialog box, deselect Properties and Themes.
- Click the plus symbol (+) to expand Themes.
- Under Contours, select Concentration.
- Click OK.

- In the GeoPlan Properties and Themes dialog box, click OK to close it.


